Review
. 2021 Jul;18(7):747-756.
doi: 10.1038/s41592-021-01197-1. Epub 2021 Jul 8.

Mass spectrometry-based metabolomics: a guide for annotation, quantification and best reporting practices

Affiliations
Review

Mass spectrometry-based metabolomics: a guide for annotation, quantification and best reporting practices

Saleh Alseekh et al. Nat Methods. 2021 Jul.

Abstract

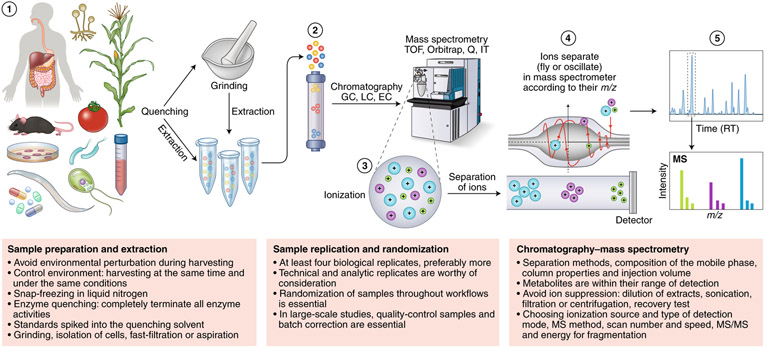
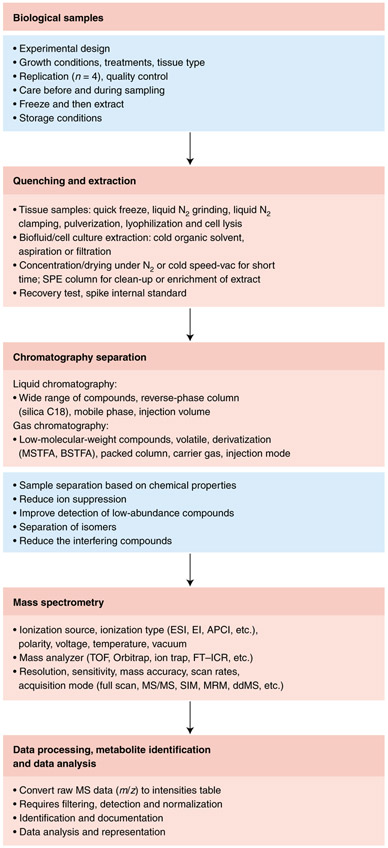
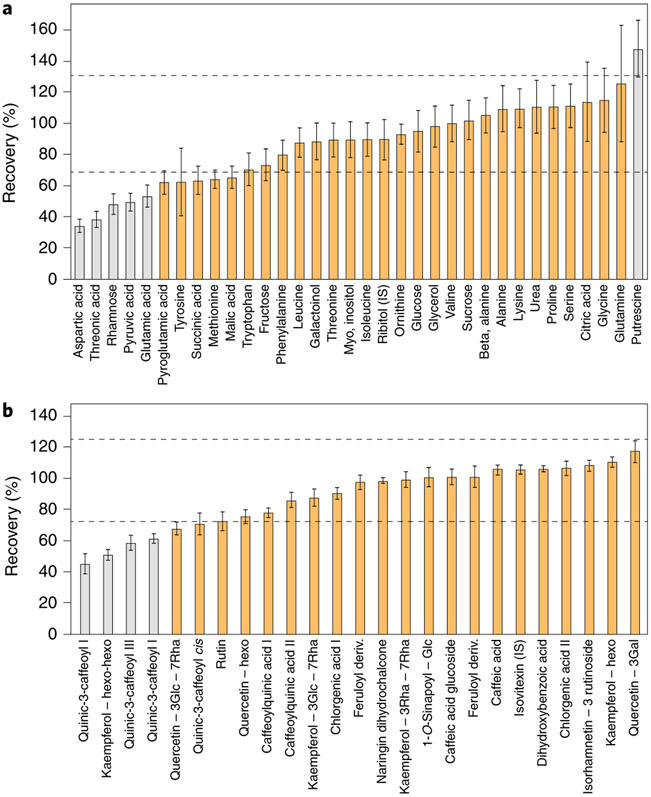
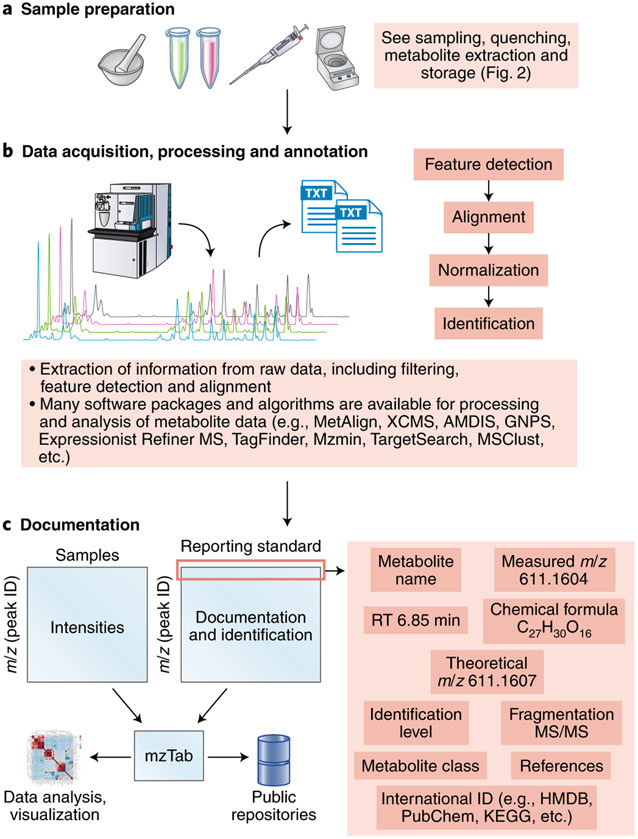
Mass spectrometry-based metabolomics approaches can enable detection and quantification of many thousands of metabolite features simultaneously. However, compound identification and reliable quantification are greatly complicated owing to the chemical complexity and dynamic range of the metabolome. Simultaneous quantification of many metabolites within complex mixtures can additionally be complicated by ion suppression, fragmentation and the presence of isomers. Here we present guidelines covering sample preparation, replication and randomization, quantification, recovery and recombination, ion suppression and peak misidentification, as a means to enable high-quality reporting of liquid chromatography- and gas chromatography-mass spectrometry-based metabolomics-derived data.


Figures

Fig. 1 ∣
Fig. 1 ∣. Metabolomics workflow.
Metabolomics involves several basic steps: (1) sample preparation and extraction; (2) metabolite separation on a column (chromatography) such as by GC, LC or EC; (3) ionization of metabolites using an ion source; (4) separation by a mass analyzer as ions fly or oscillate on the basis of their mass-to-charge (m/z) ratio; and (5) detection. Metabolites can be identified on the basis of a combination of retention time (RT) and MS signature. TOF, time of flight; Q, quadrupole; IT, ion trap.
Fig. 2 ∣
Fig. 2 ∣. Workflow for typical MS-based metabolomics.
Overview chart listing the major steps and guidelines involved in typical MS-based metabolomics studies.
Fig. 3 ∣
Fig. 3 ∣. Recovery tests.
a,b, Recovery tests were performed using GC-MS (a) and LC-MS (b) peaks obtained for a mixture of extracts from Arabidopsis and lettuce leaves. The mixture was made by combining extracts from Arabidopsis (A) and lettuce (B) leaves (0.2 mg fresh weight per μl) at a 1:1 ratio. The percentage recovery was estimated using the theoretical concentration in the extract mixture: ((level in leaves (A)×A%) + (level in leaves (B)×B%))/100. Dashed lines indicate the acceptable range of 70–130%. Compounds in gray are statistically outside this range. Error bars represent ±s.e.m.
Fig. 4 ∣
Fig. 4 ∣. Workflow for metabolic data processing and downstream result documentation.
a,b, Structure elucidation workflow for data acquisition (a) and processing and annotation (b).c, Simple design for metabolic data documentation and how data can be linked to the mzTab tool to facilitate data representation, sharing and deposition to public repositories.
Fig. 5 ∣
Fig. 5 ∣. Metabolite annotation and documentation.
Structure elucidation workflow of metabolite identification. MS/MS fragmentation provides information about compound structure. Metabolite annotation can be achieved using reference compounds, MS2 analysis, NMR or a photodiode array (PDA) detector for UV-visible light spectrum detection. Database searching enables molecular formula calculation. Illustrated is an example of our recommendations for reporting metabolomics data for a typical LC–MS experiment for the compound rutin (a flavonoid glycoside). Comparison of the MS and MS/MS spectra for rutin reveals a peak at 611 m/z in the MS scan and two major fragments at 611 m/z in the MS/MS scan, providing information about chemical loss of rhamnose (−146m/z) and glucose (−162m/z) moieties. For metabolite documentation, the current general recommended levels of reporting are shown; see Supplementary Tables 1 and 2 for further details.

Similar articles

Cited by

References

    1. Doerr A Global metabolomics. Nat. Methods 14, 32 (2017).
    1. Fessenden M Metabolomics: small molecules, single cells. Nature 540, 153–155 (2016). - PubMed
    1. Oliver SG, Winson MK, Kell DB & Baganz F Systematic functional analysis of the yeast genome. Trends Biotechnol. 16, 373–378 (1998). - PubMed
    1. Alseekh S & Fernie AR Metabolomics 20 years on: what have we learned and what hurdles remain? Plant J. 94, 933–942 (2018). - PubMed
    1. Chevalier C et al. Gut microbiota orchestrates energy homeostasis during cold. Cell 163, 1360–1374 (2015).

      This paper demonstrates that the microbiota is a key factor orchestrating overall energy homeostasis during increased demand in mammals.

Publication types