. 2021 Sep;24(9):1235-1242.
doi: 10.1038/s41593-021-00879-5. Epub 2021 Jul 8.

Distinct nuclear compartment-associated genome architecture in the developing mammalian brain

Affiliations

Distinct nuclear compartment-associated genome architecture in the developing mammalian brain

Sajad Hamid Ahanger et al. Nat Neurosci. 2021 Sep.

Abstract

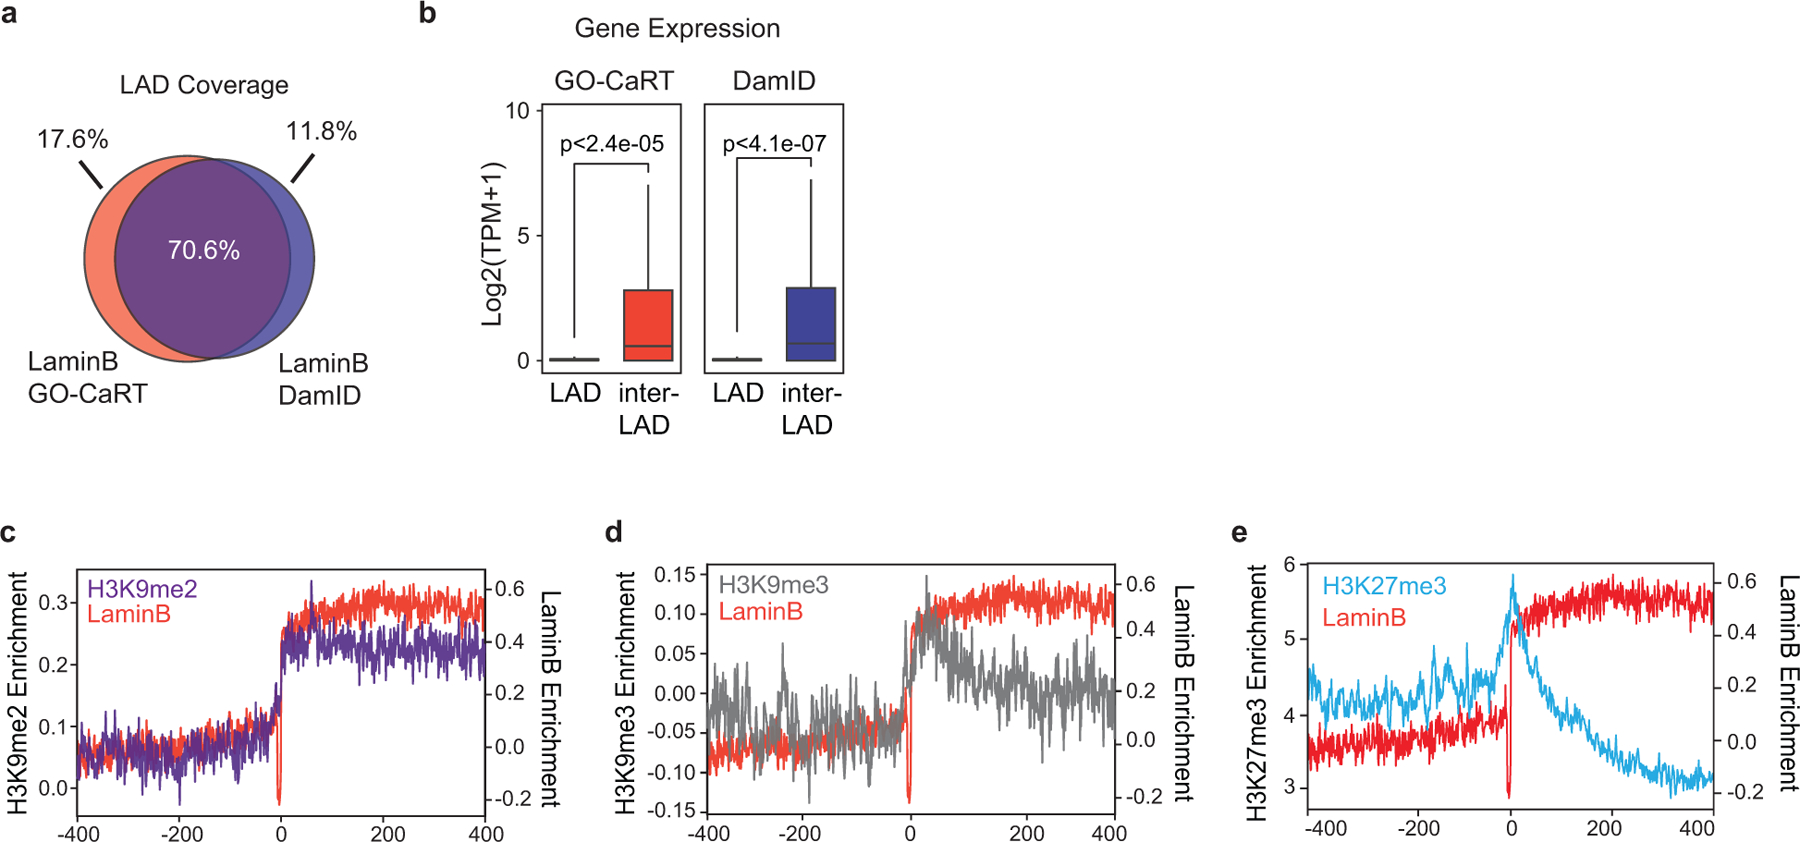
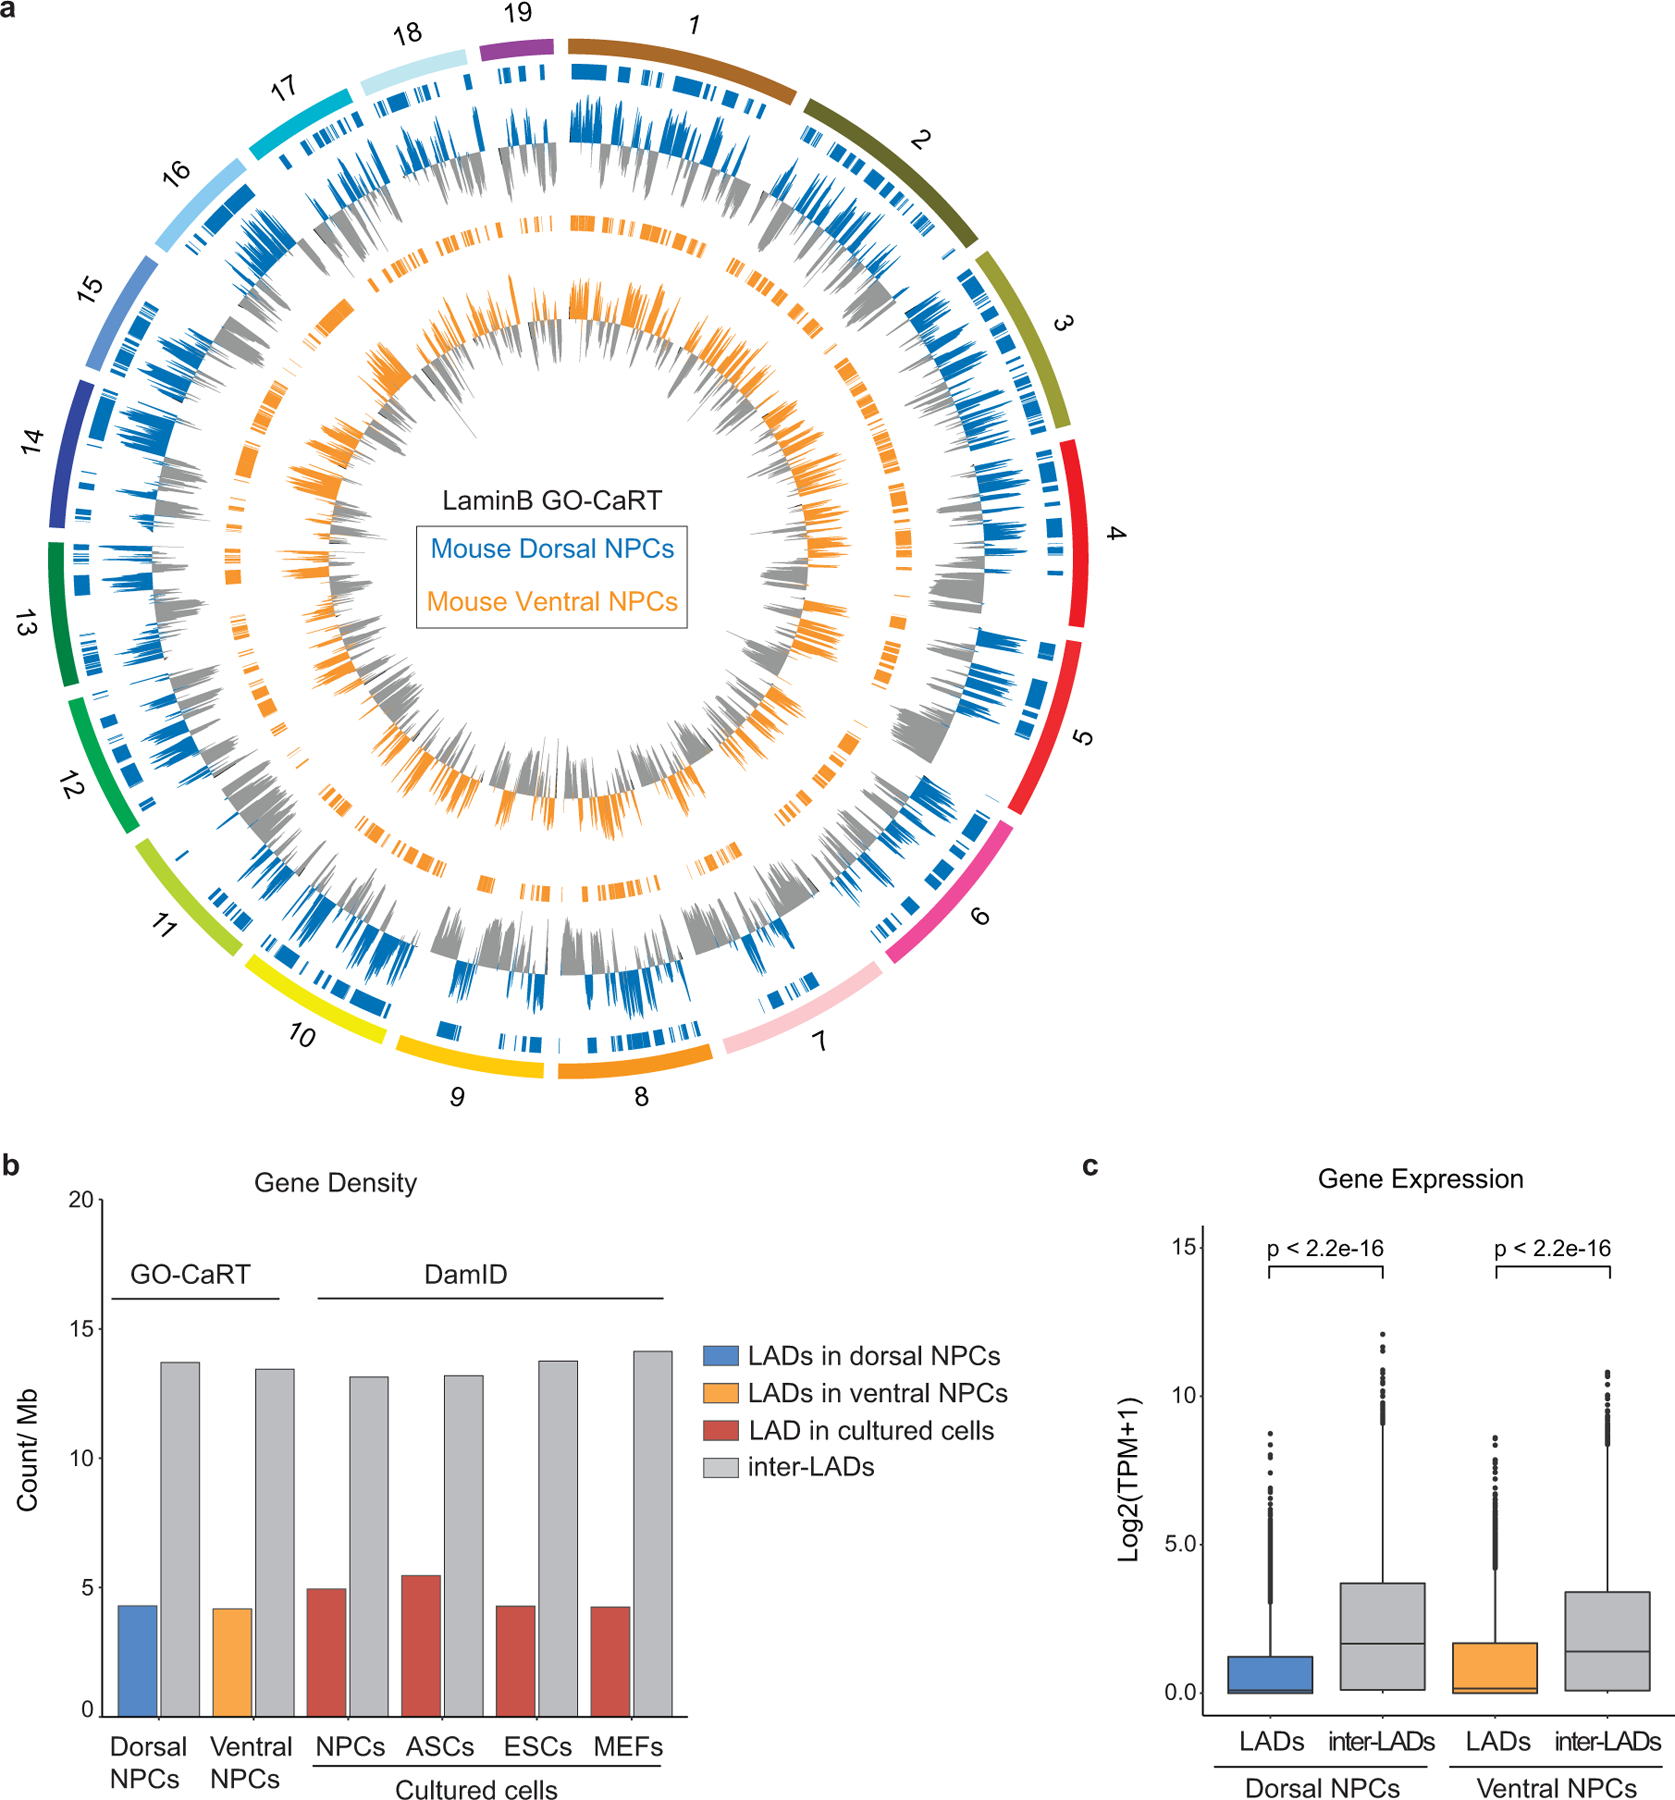
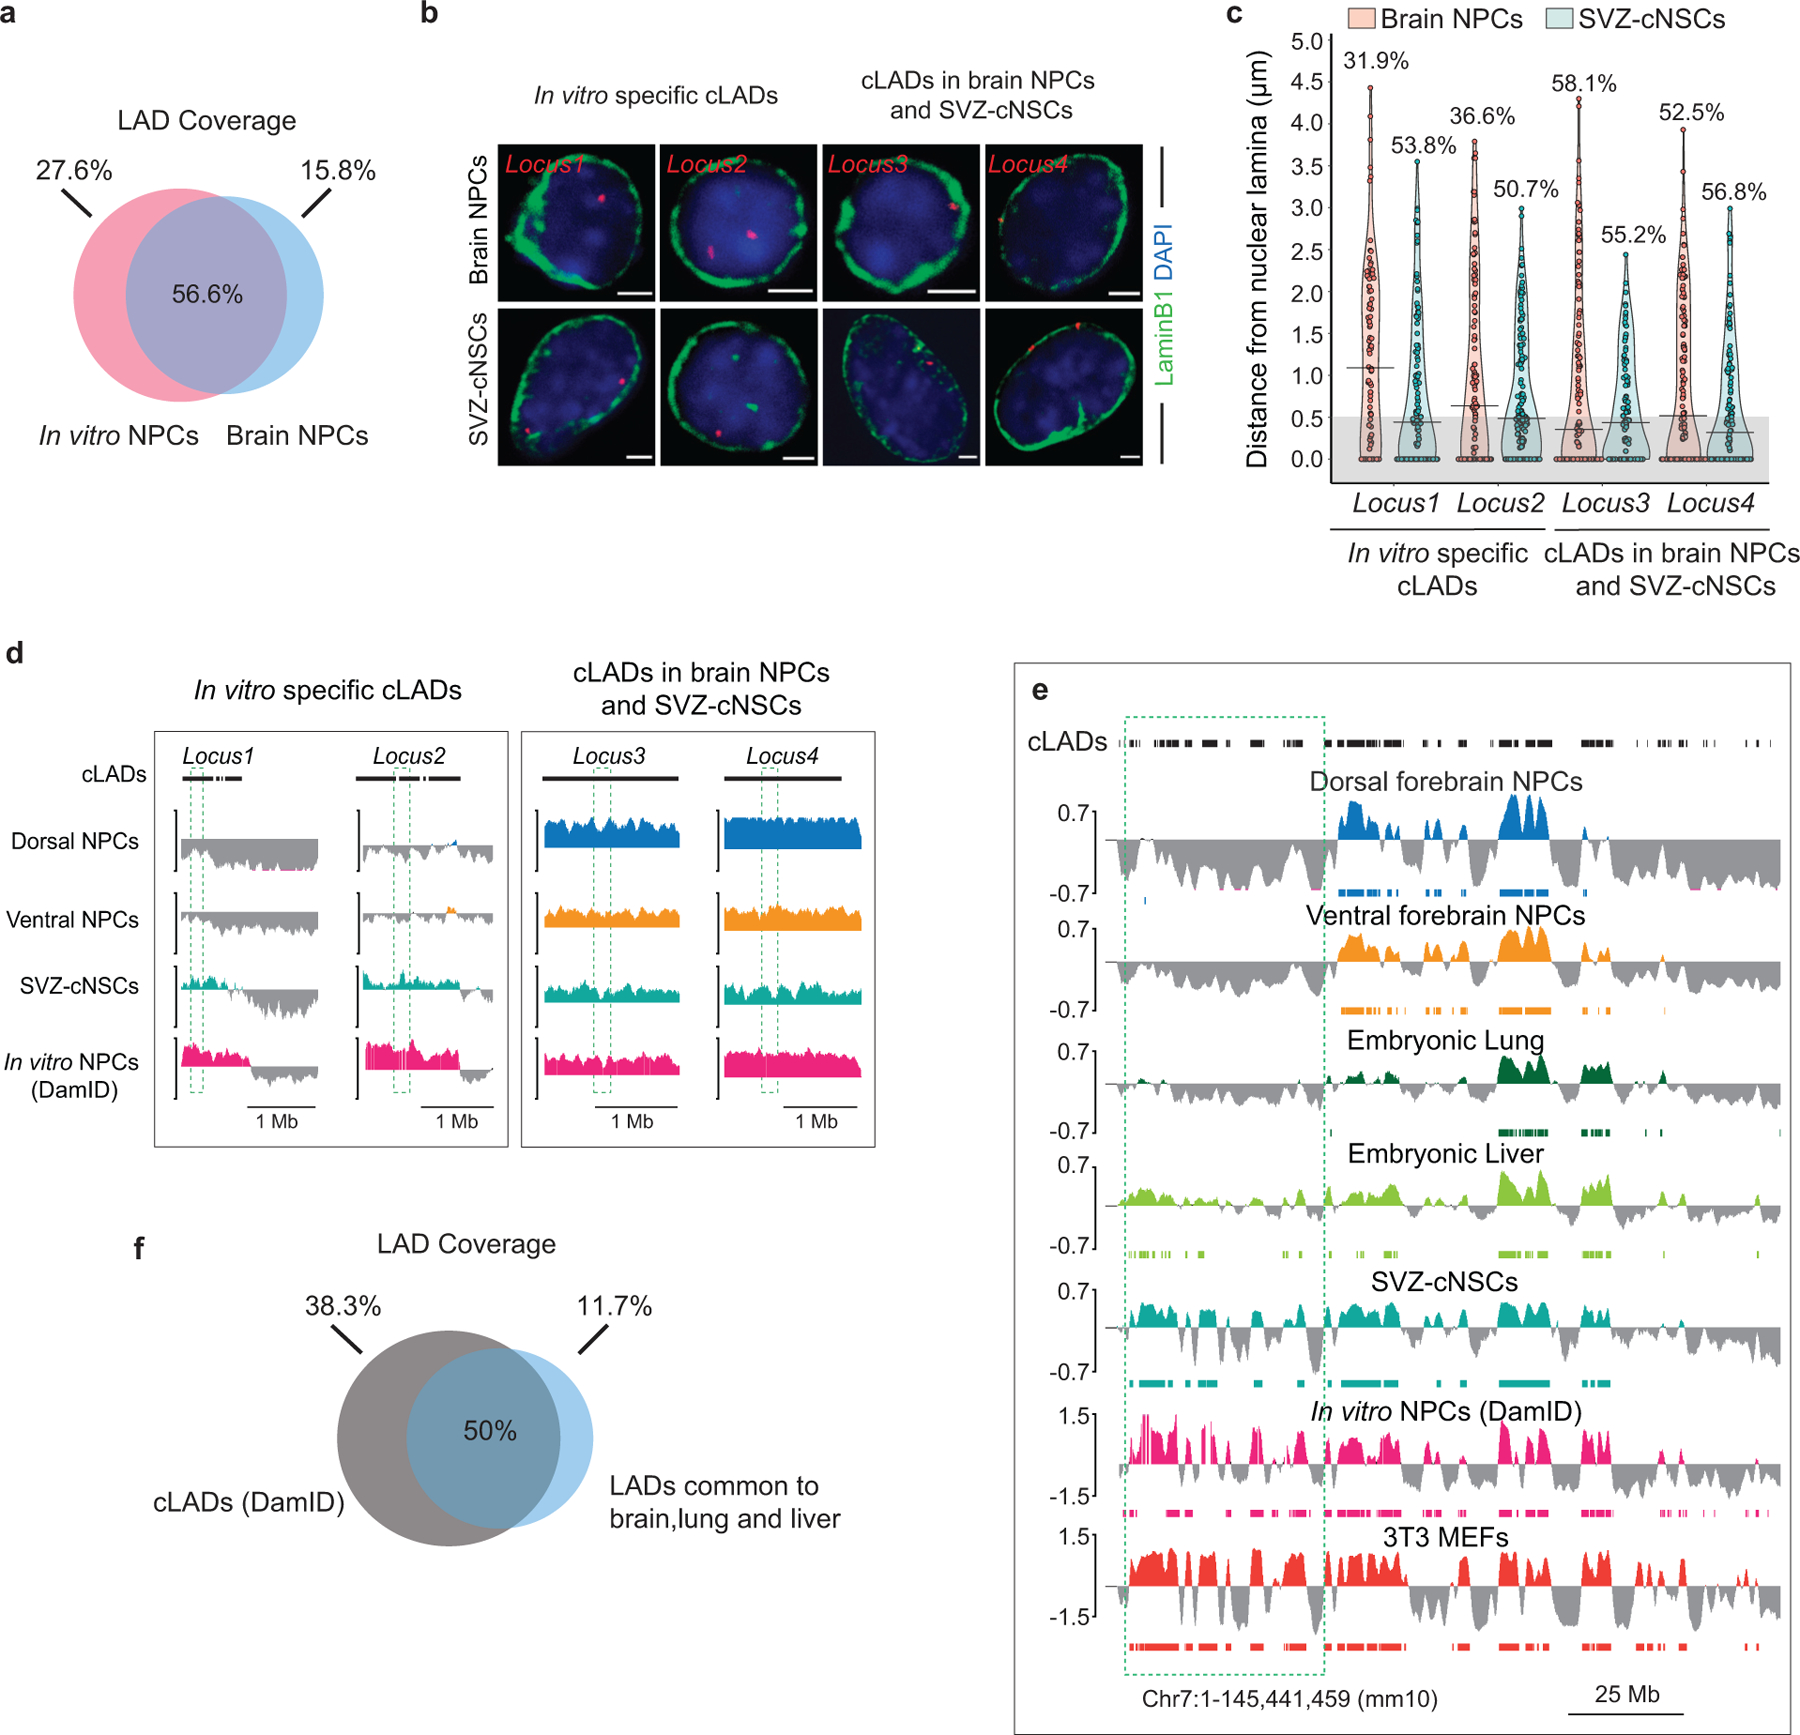
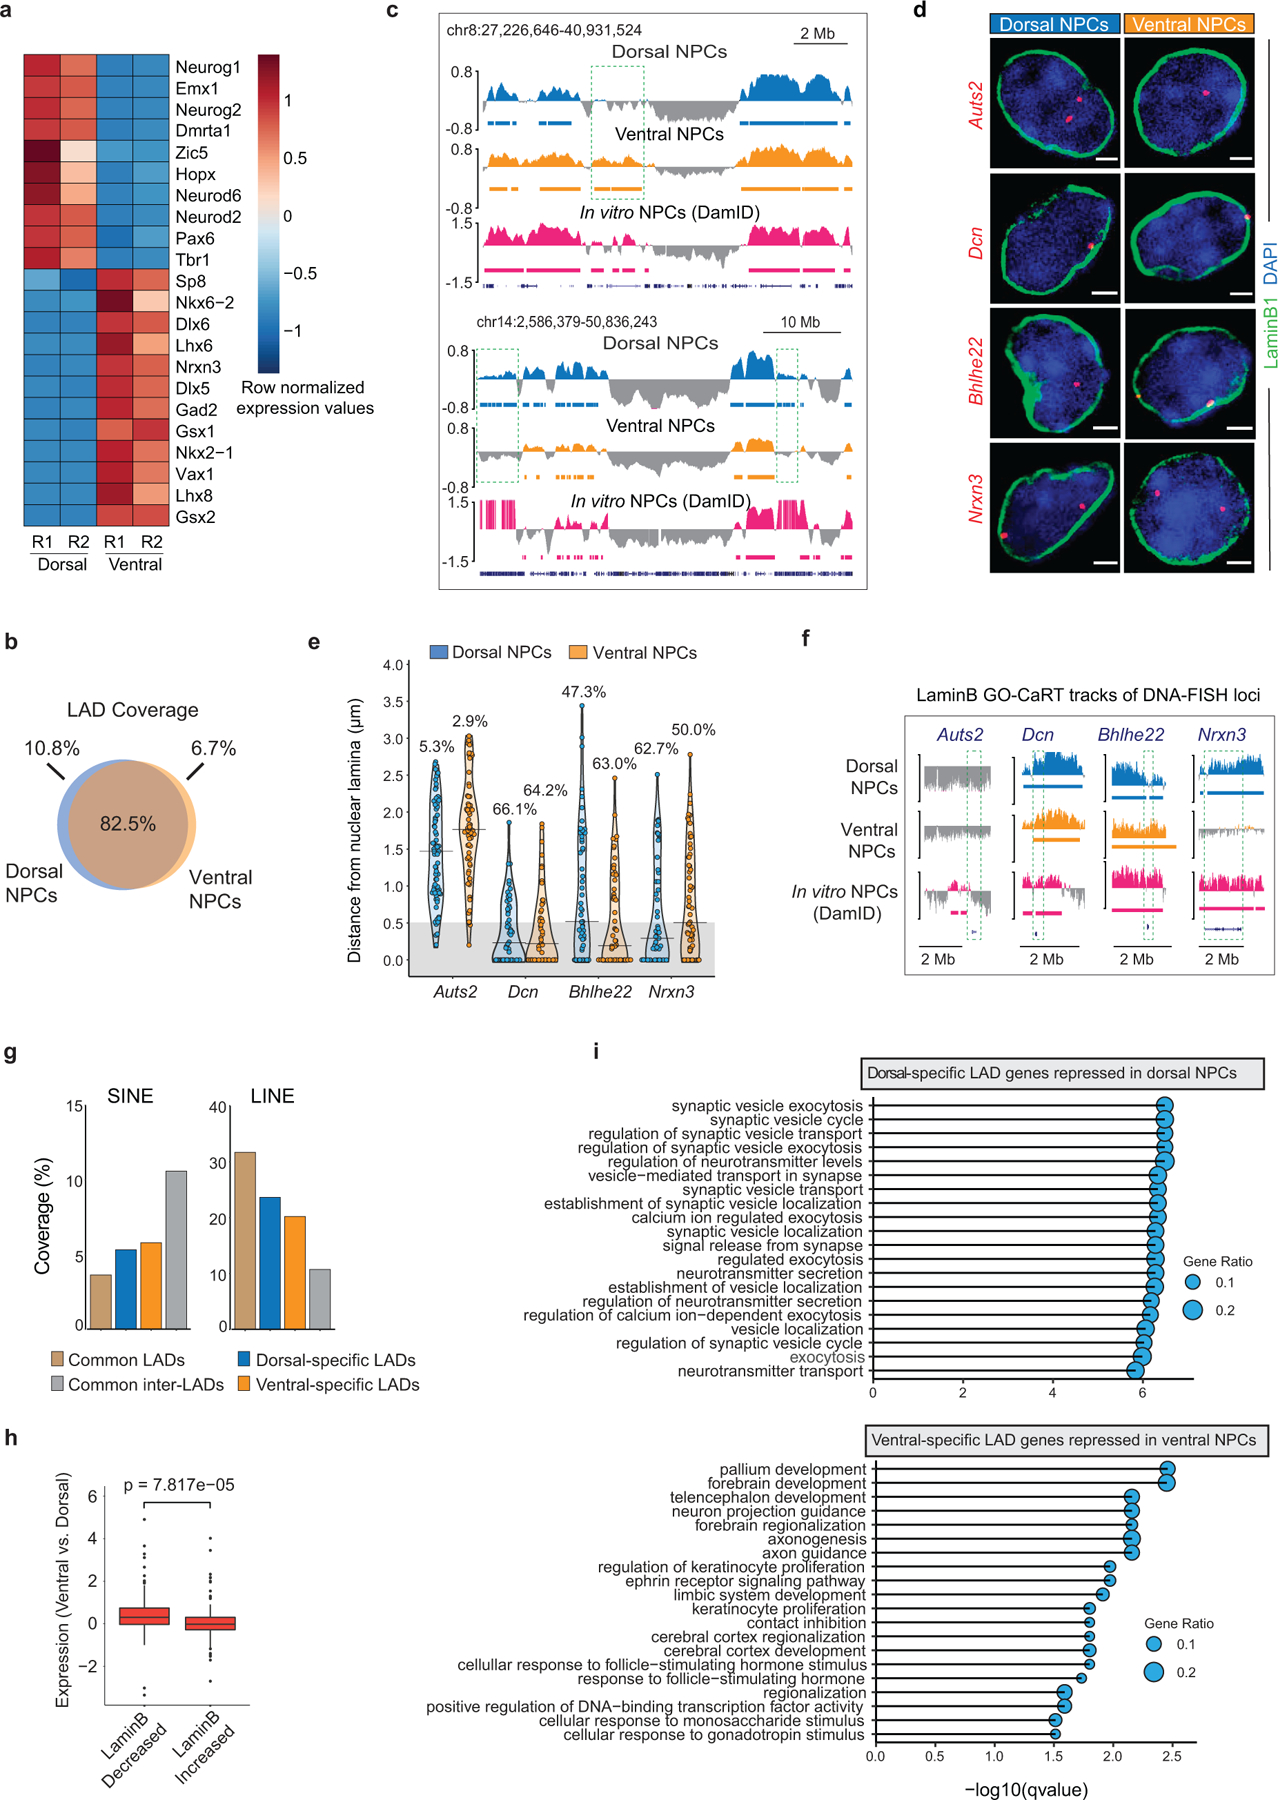
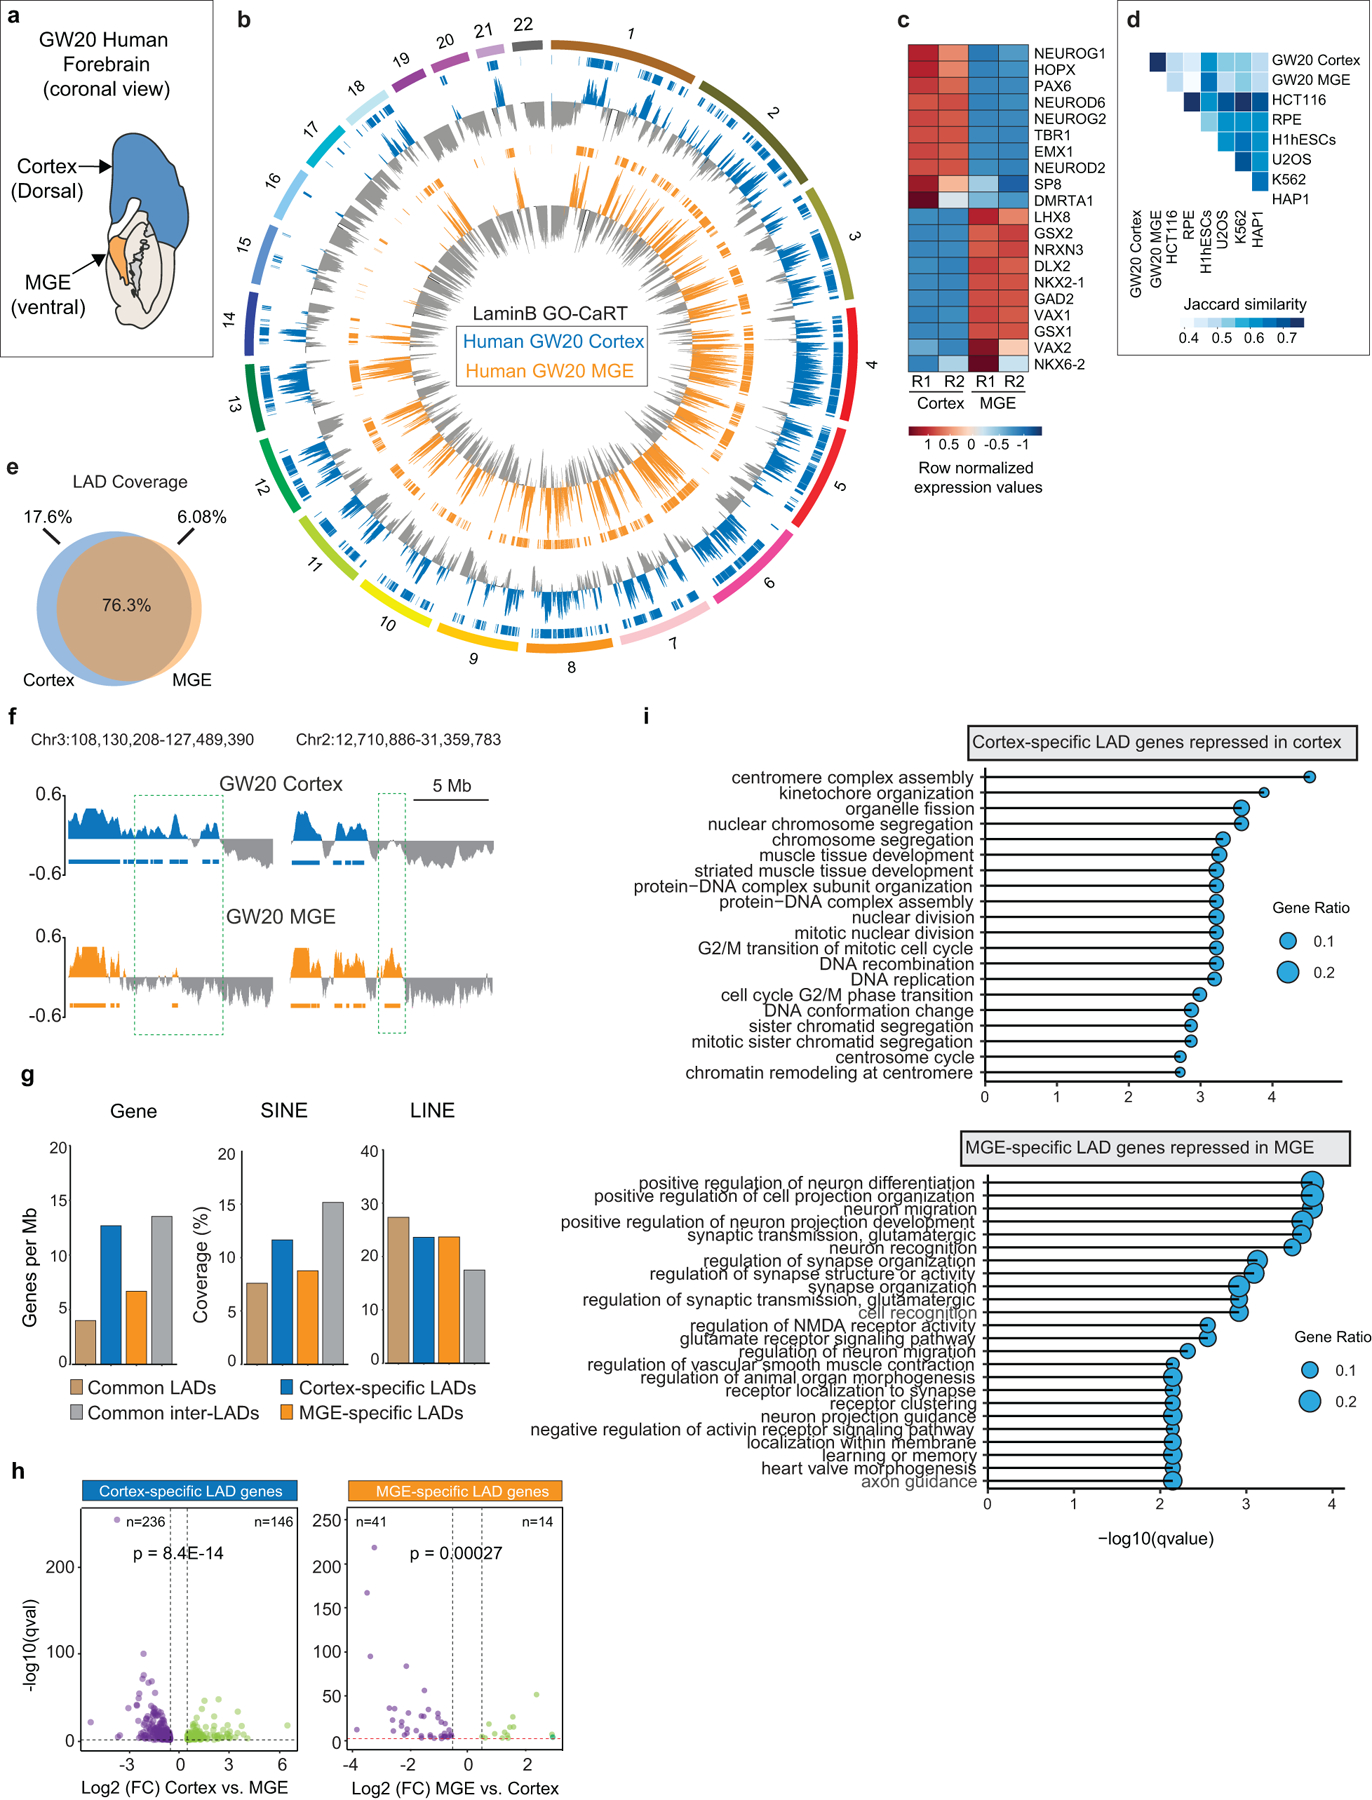
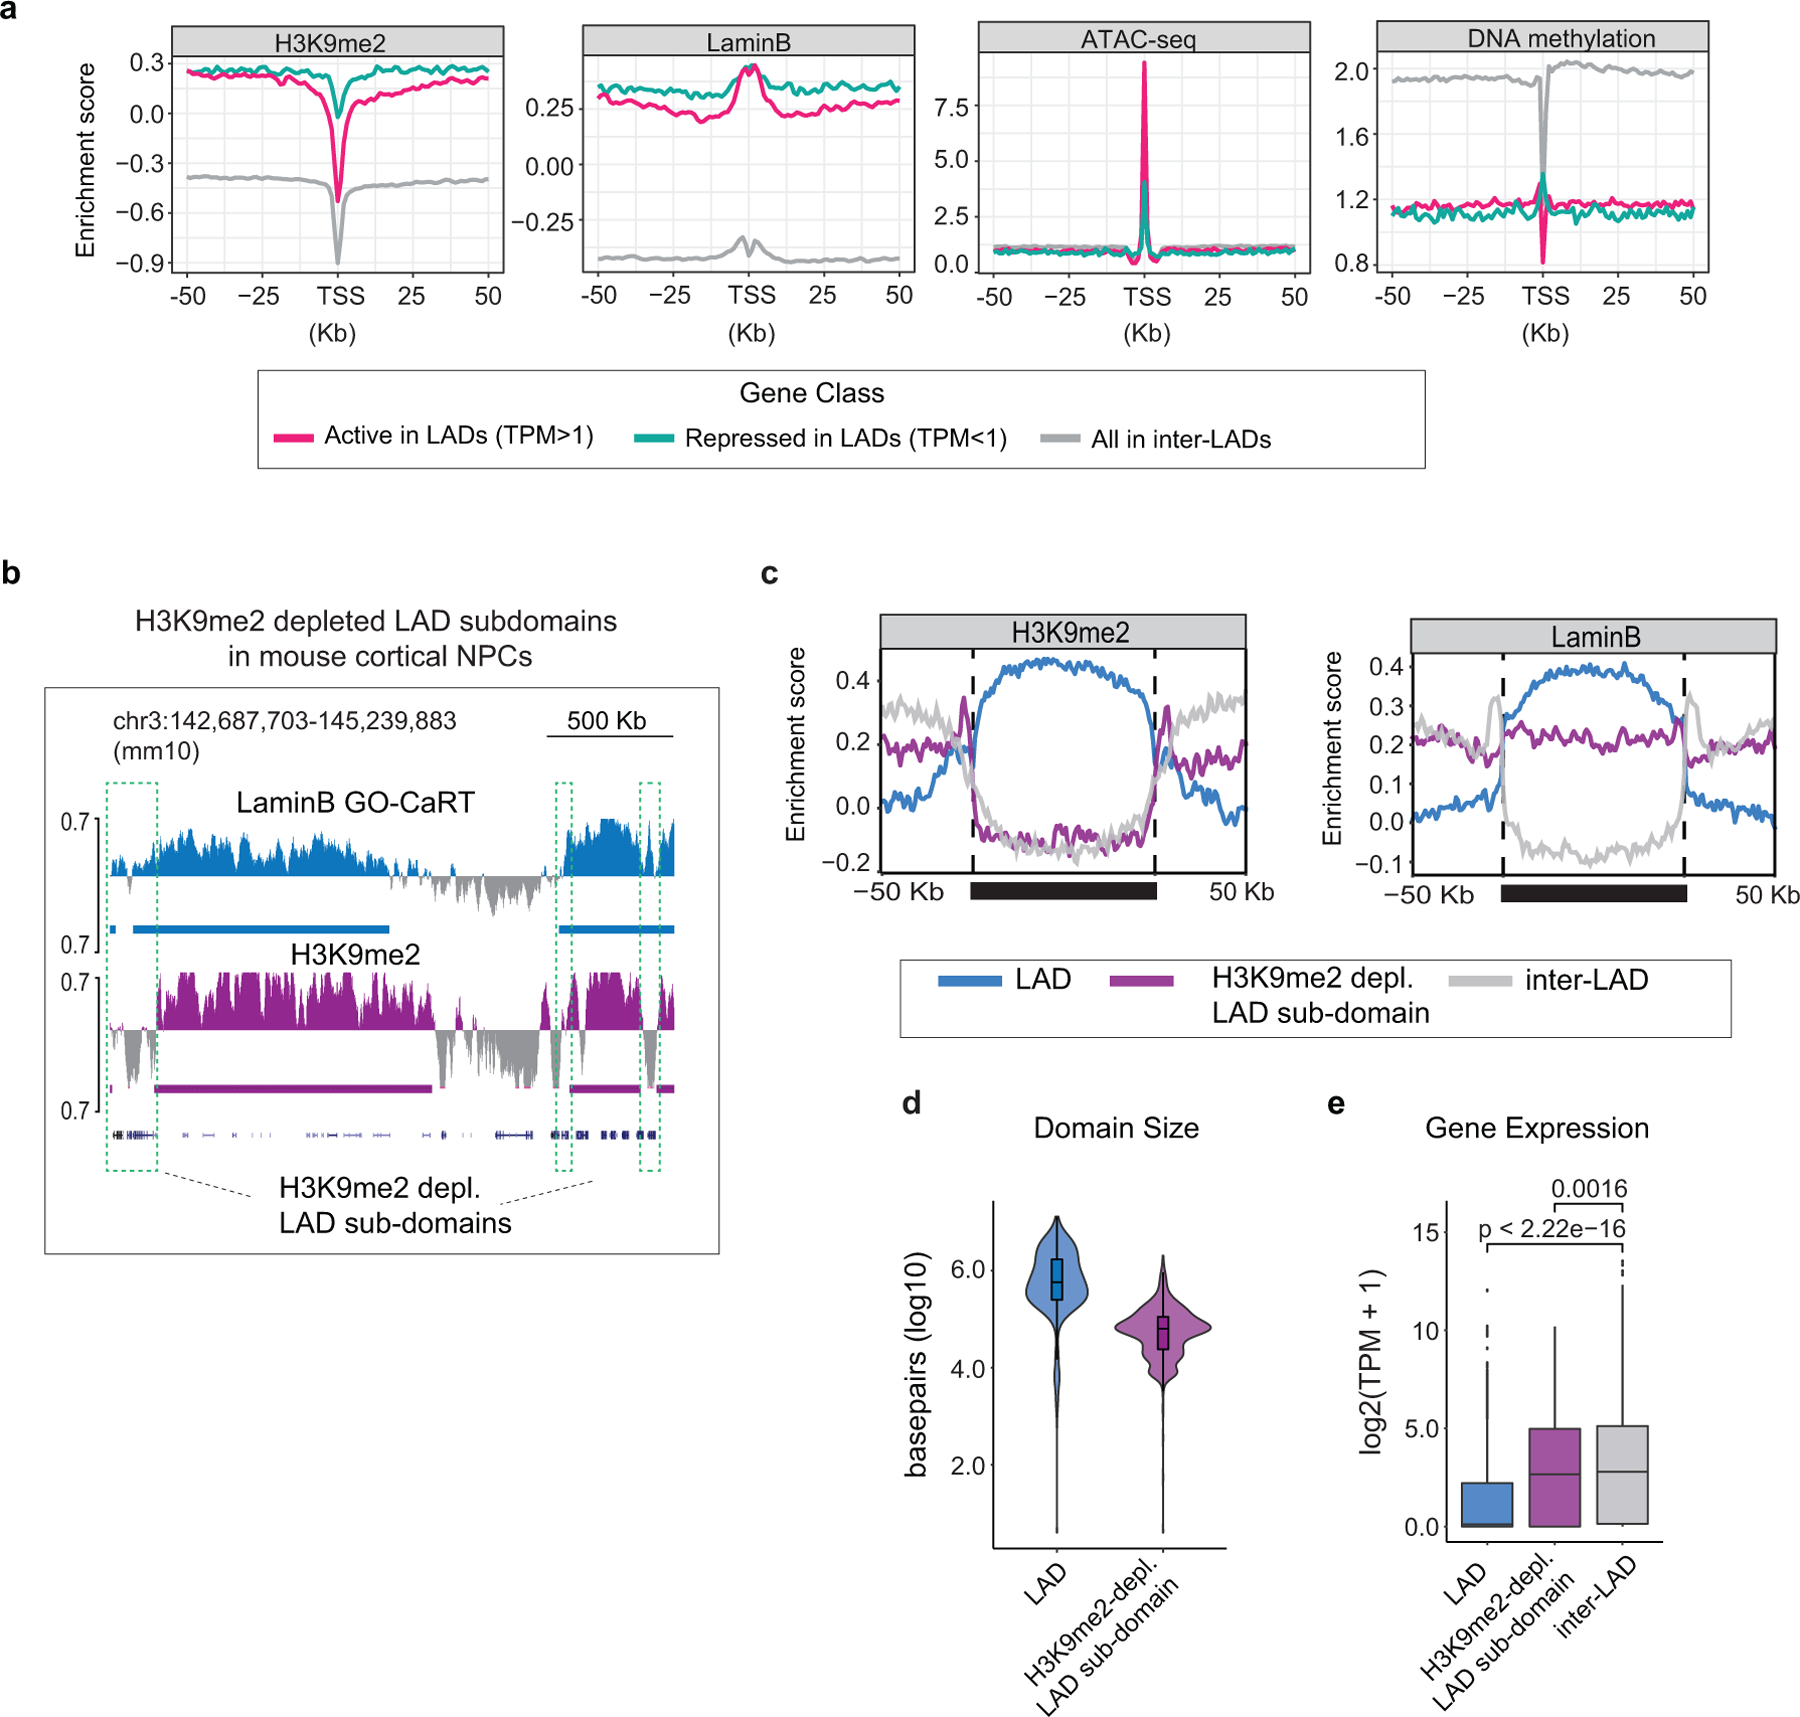
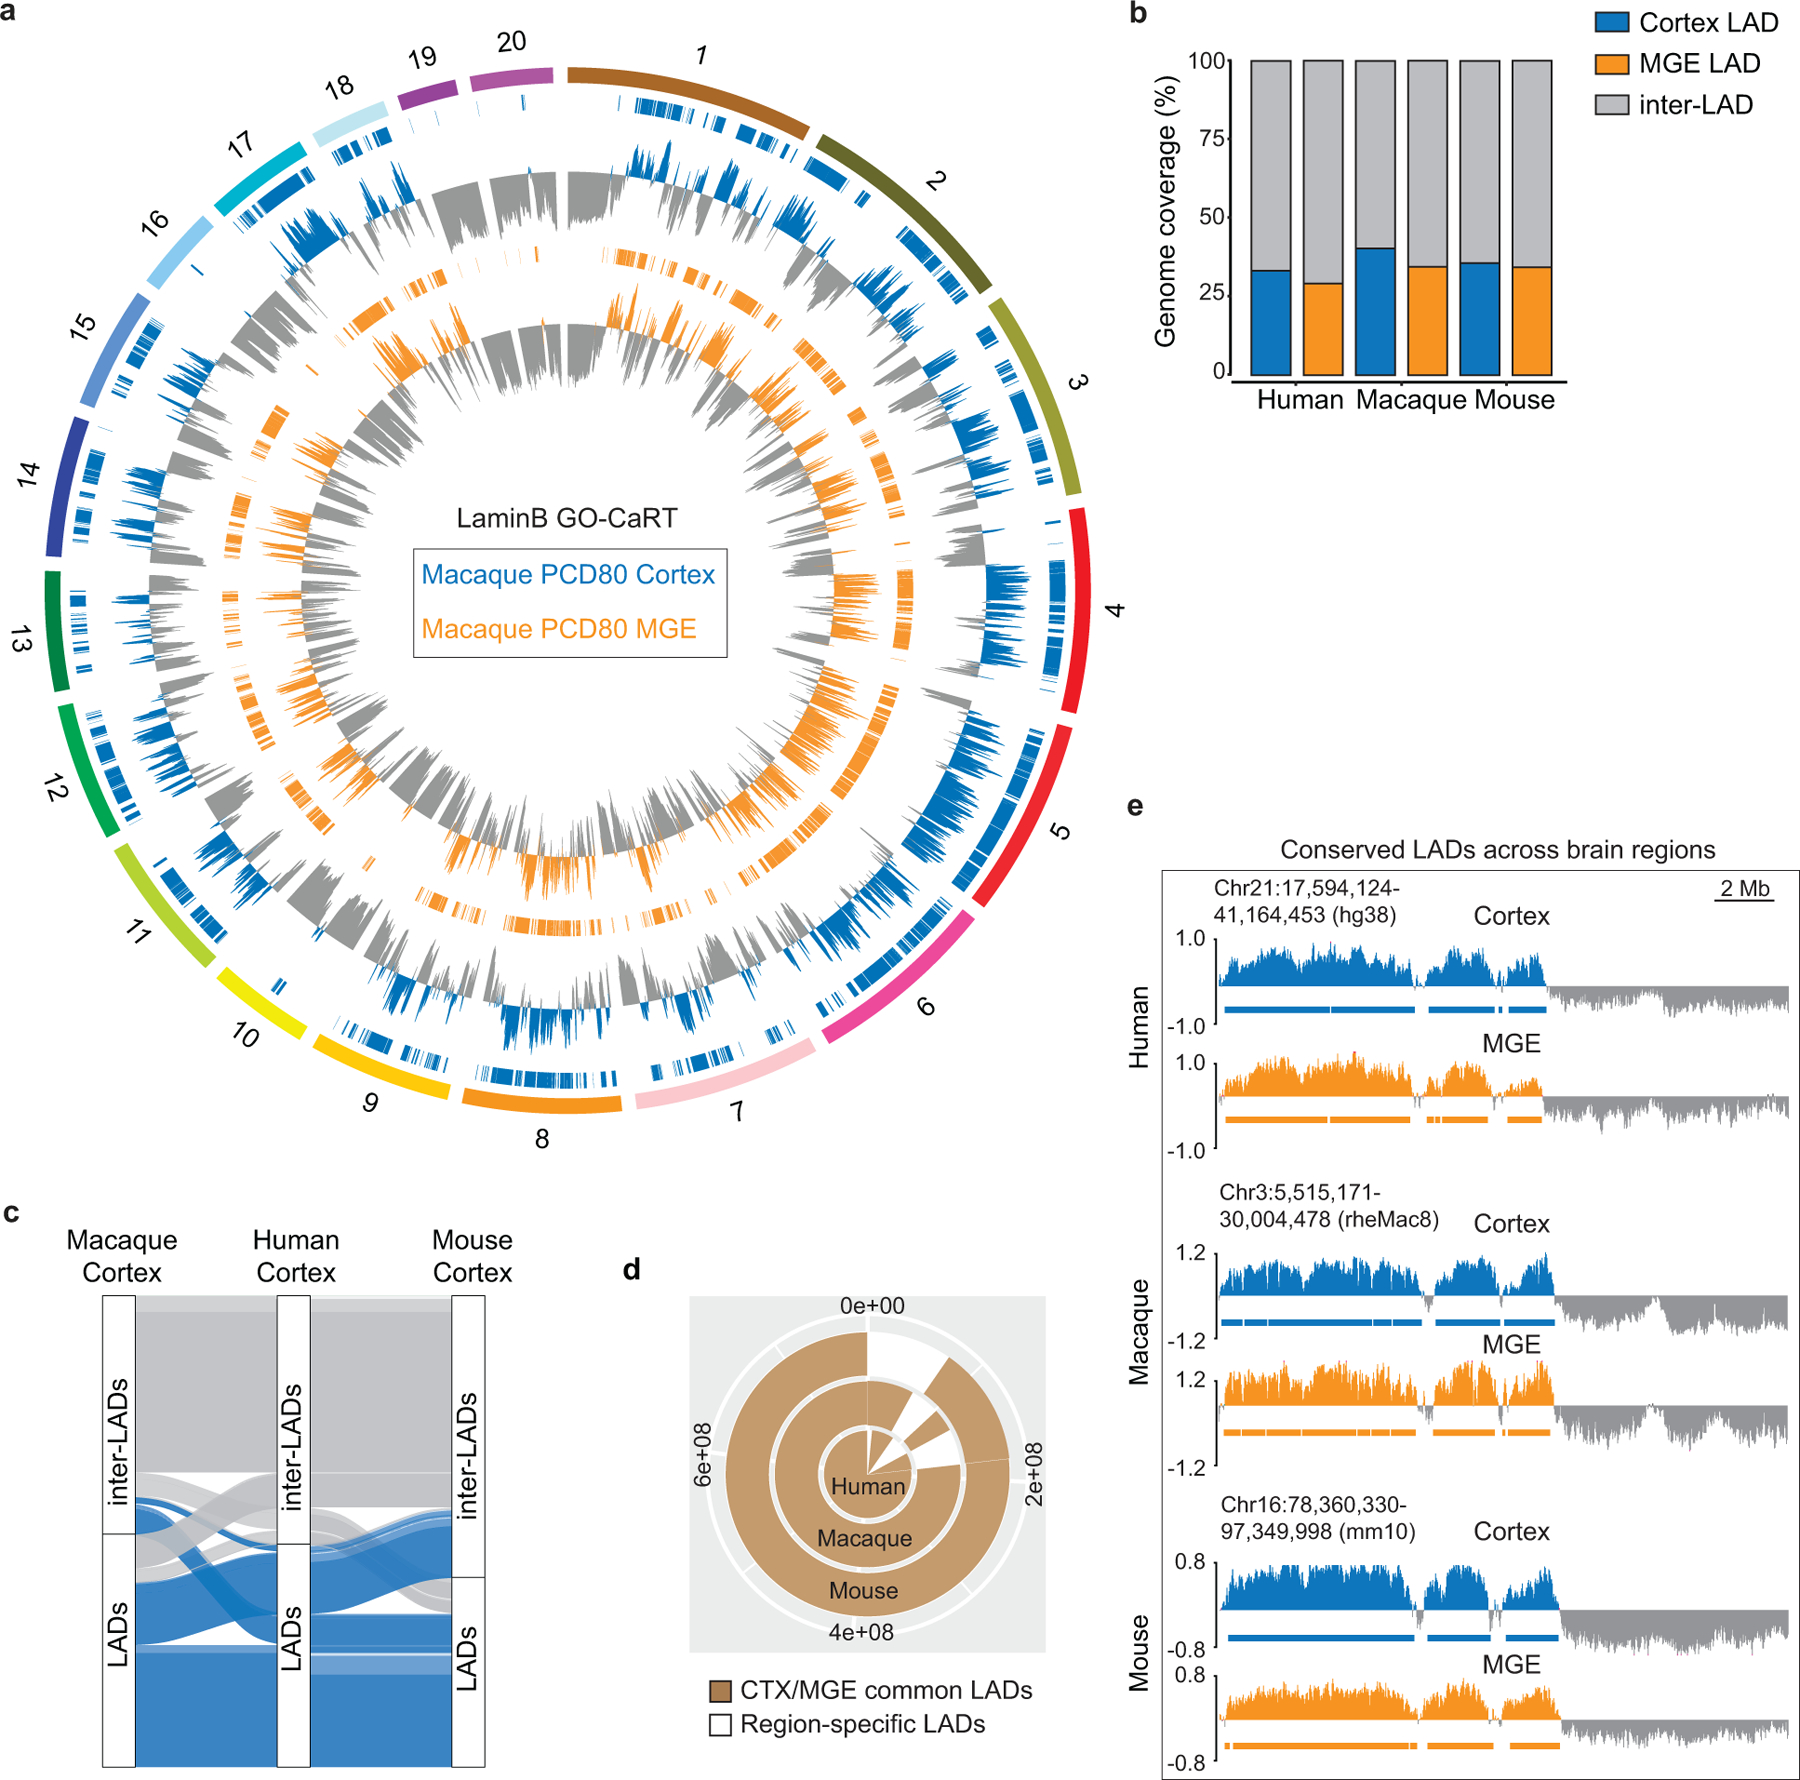
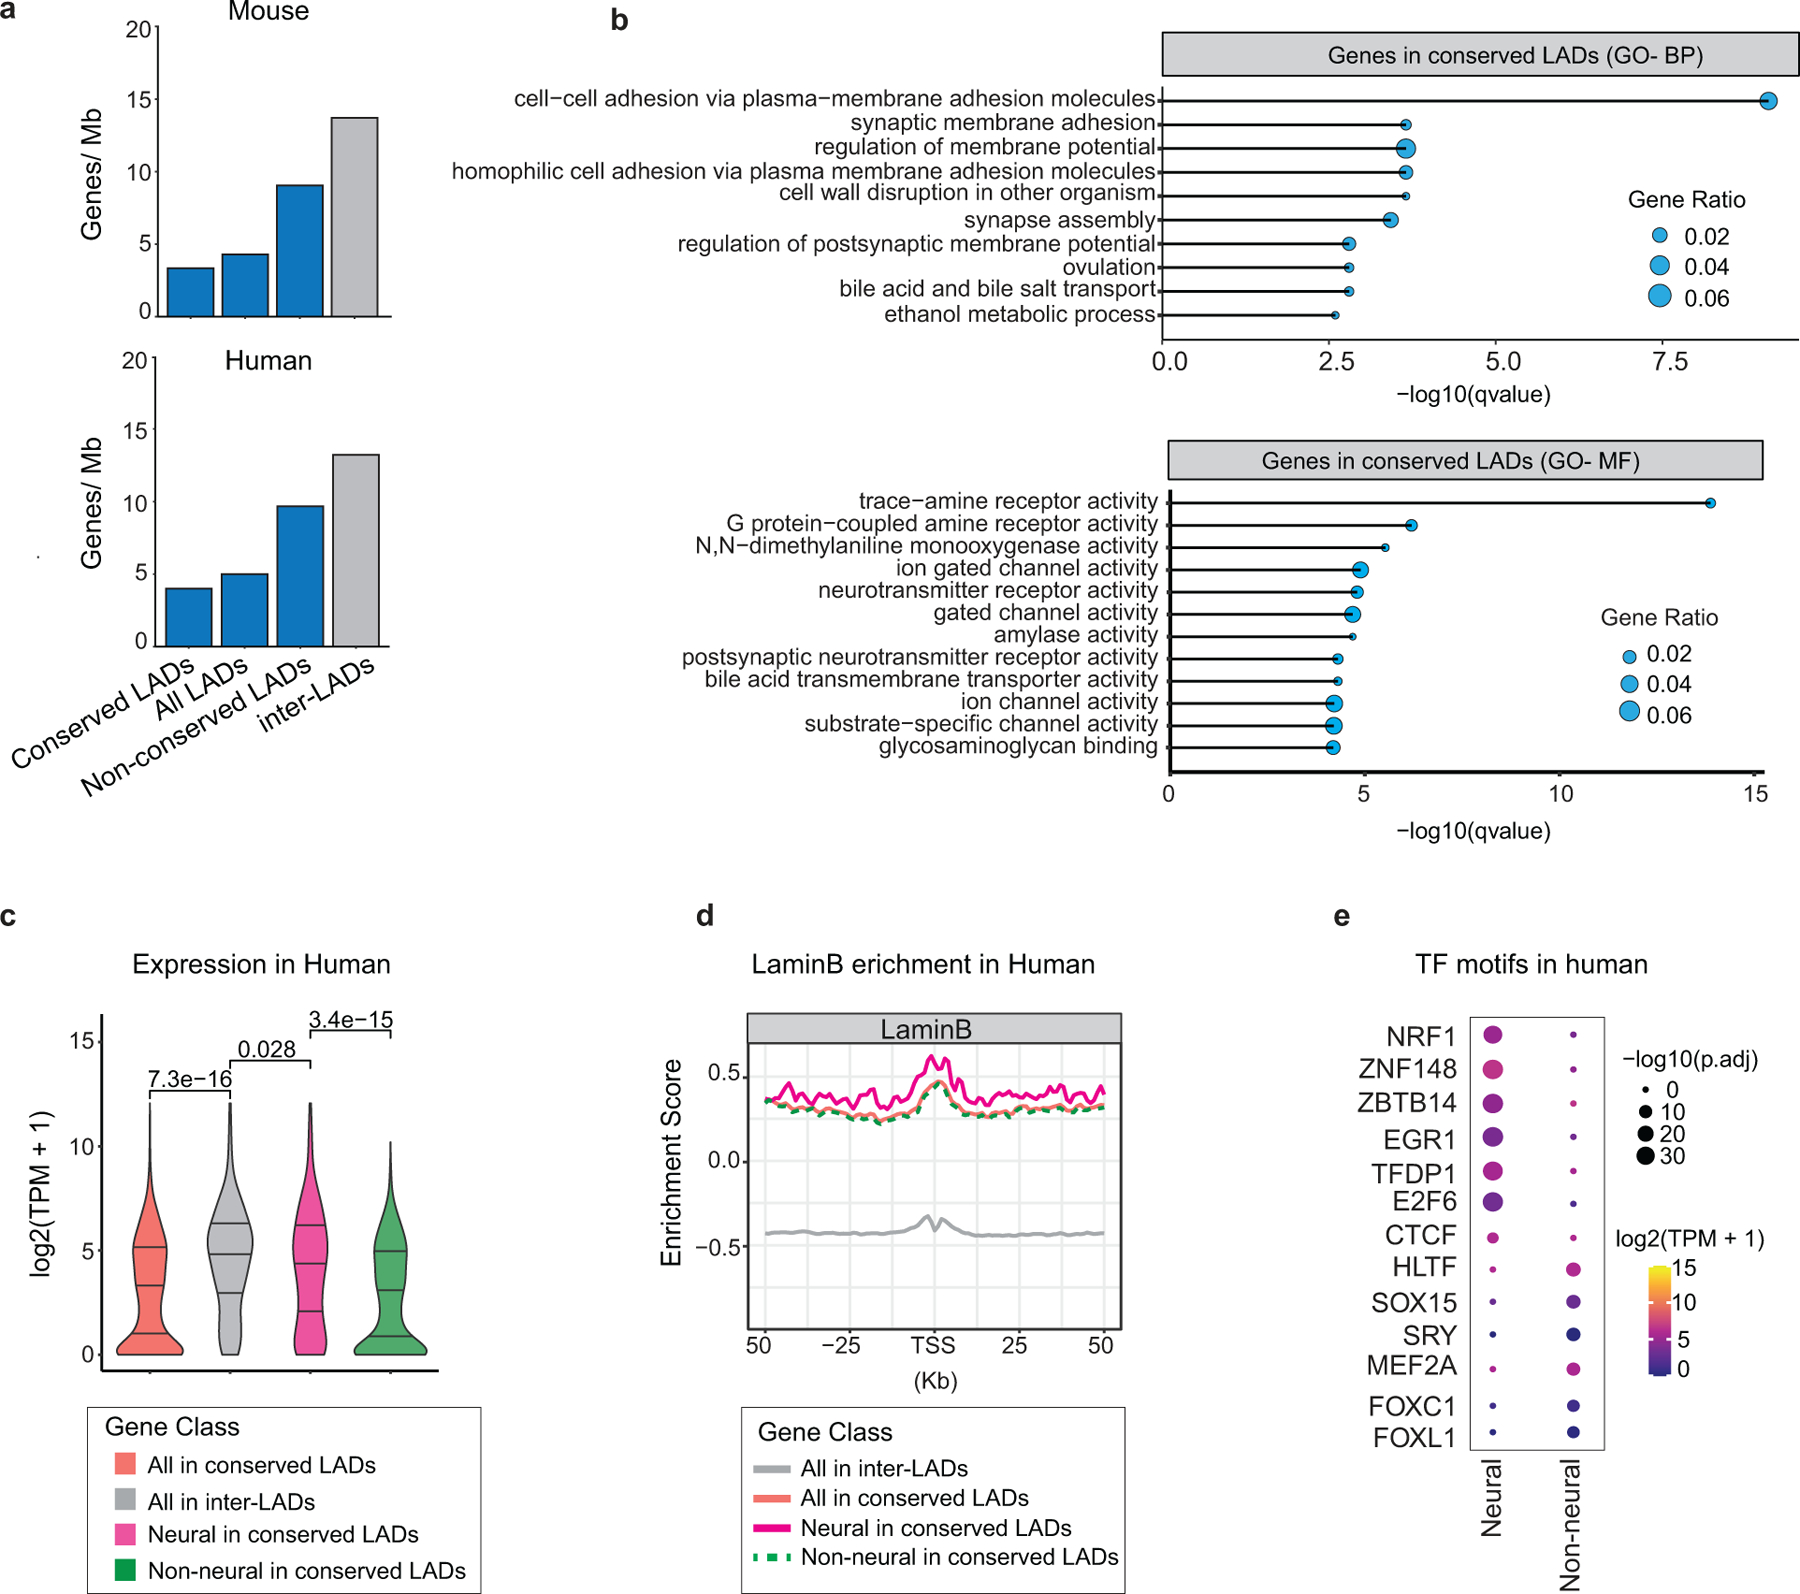
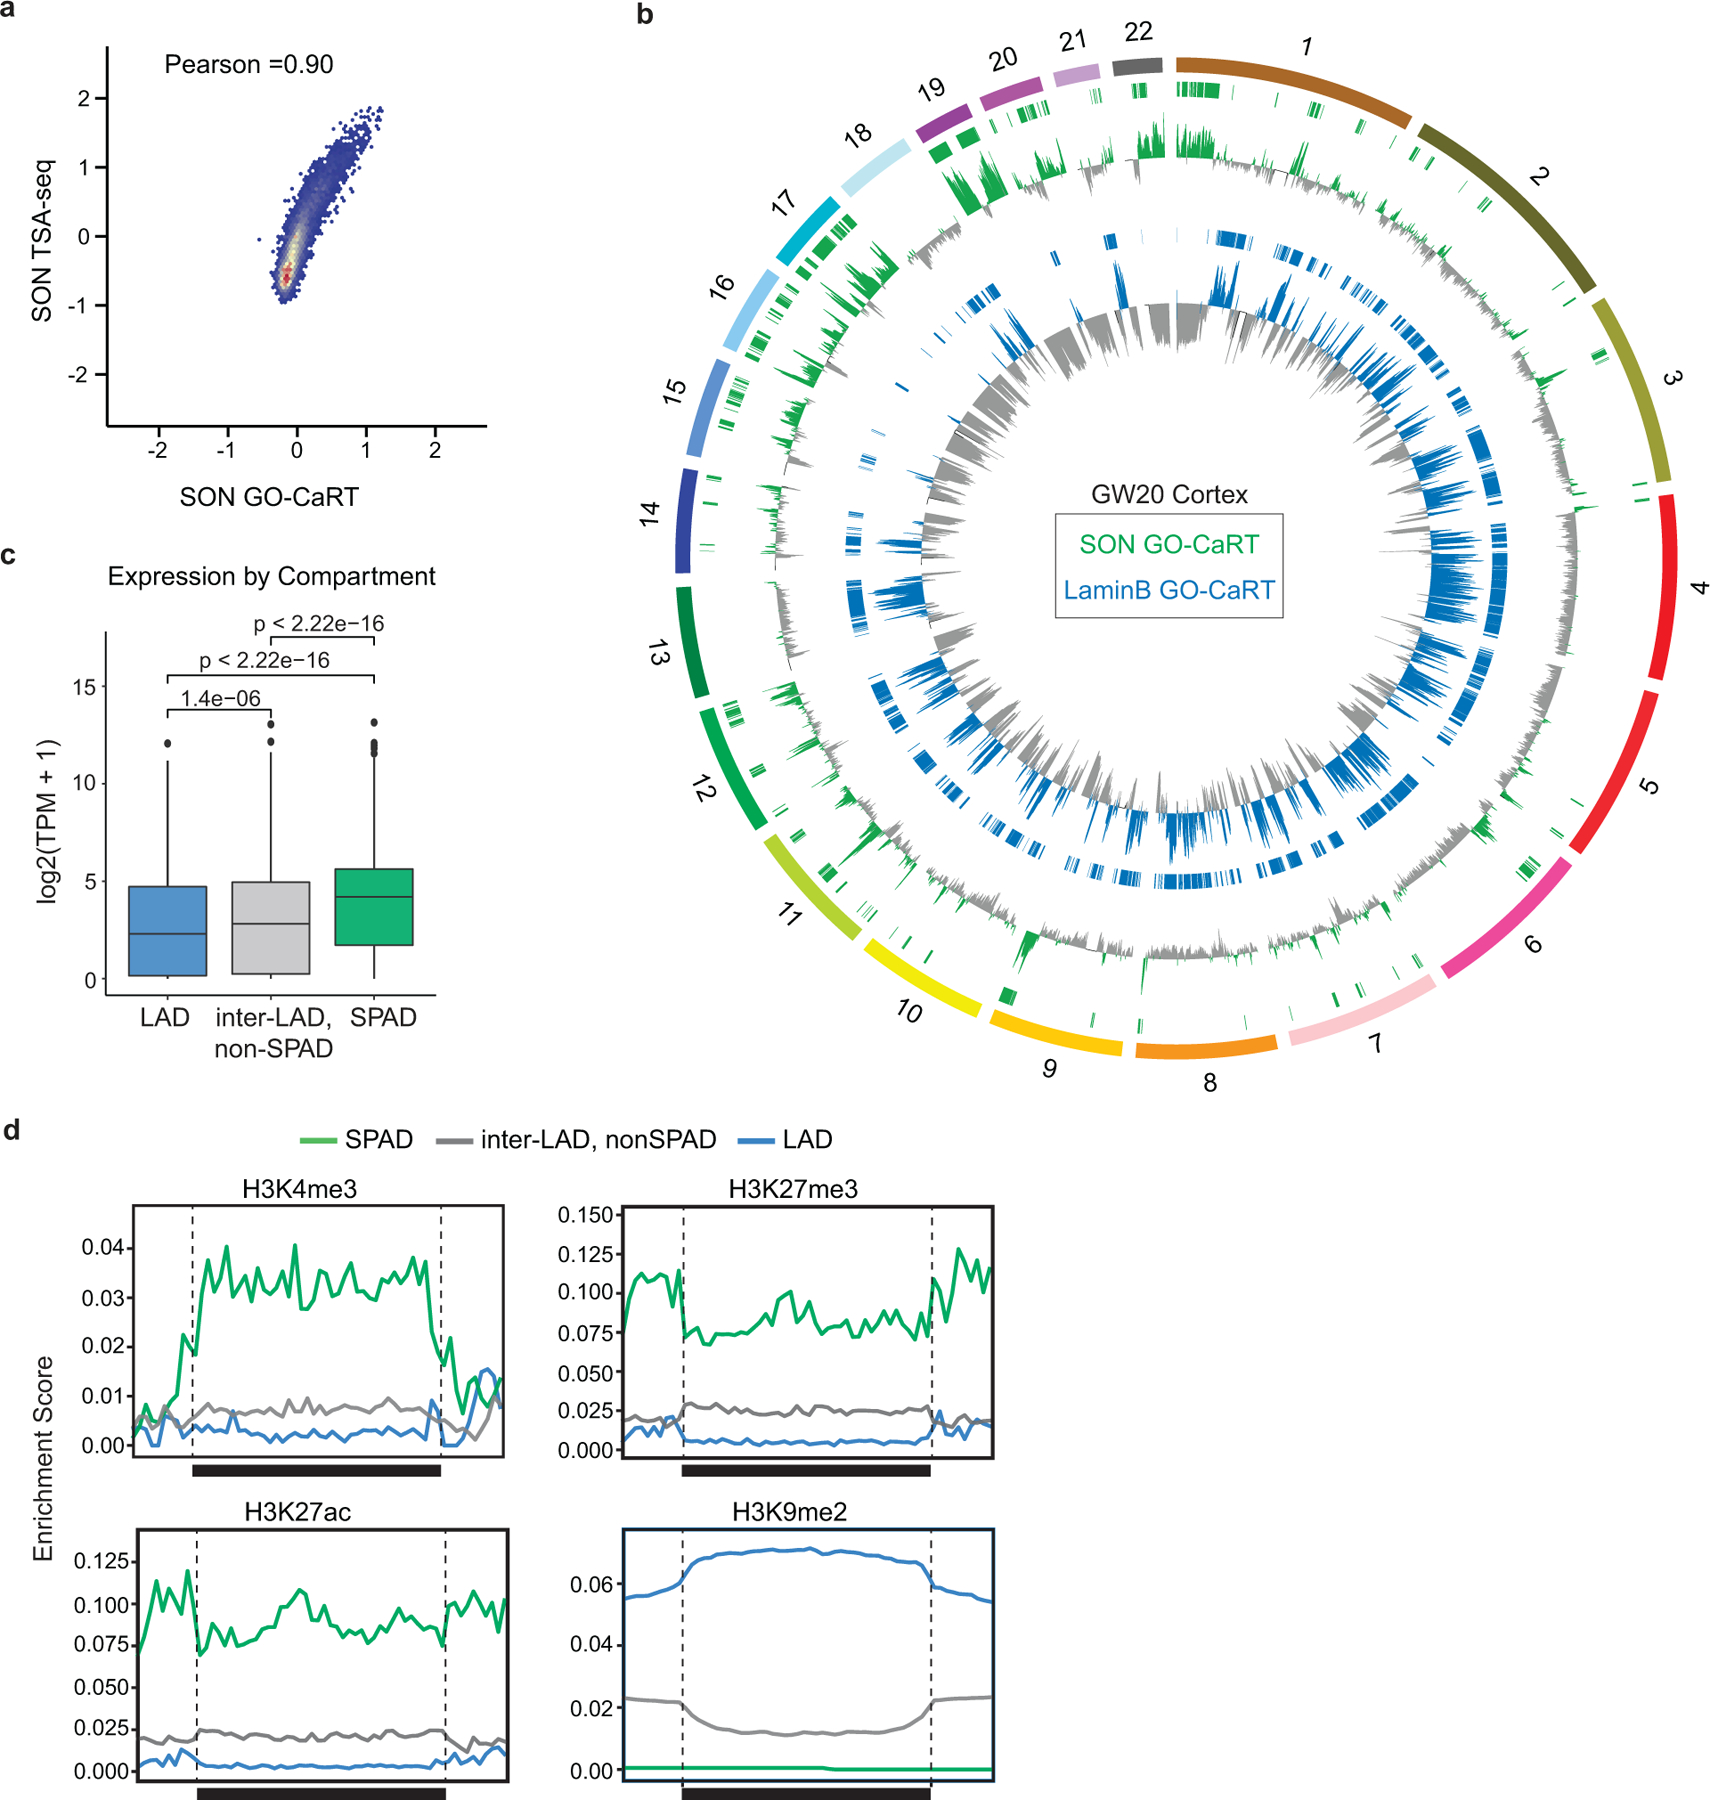
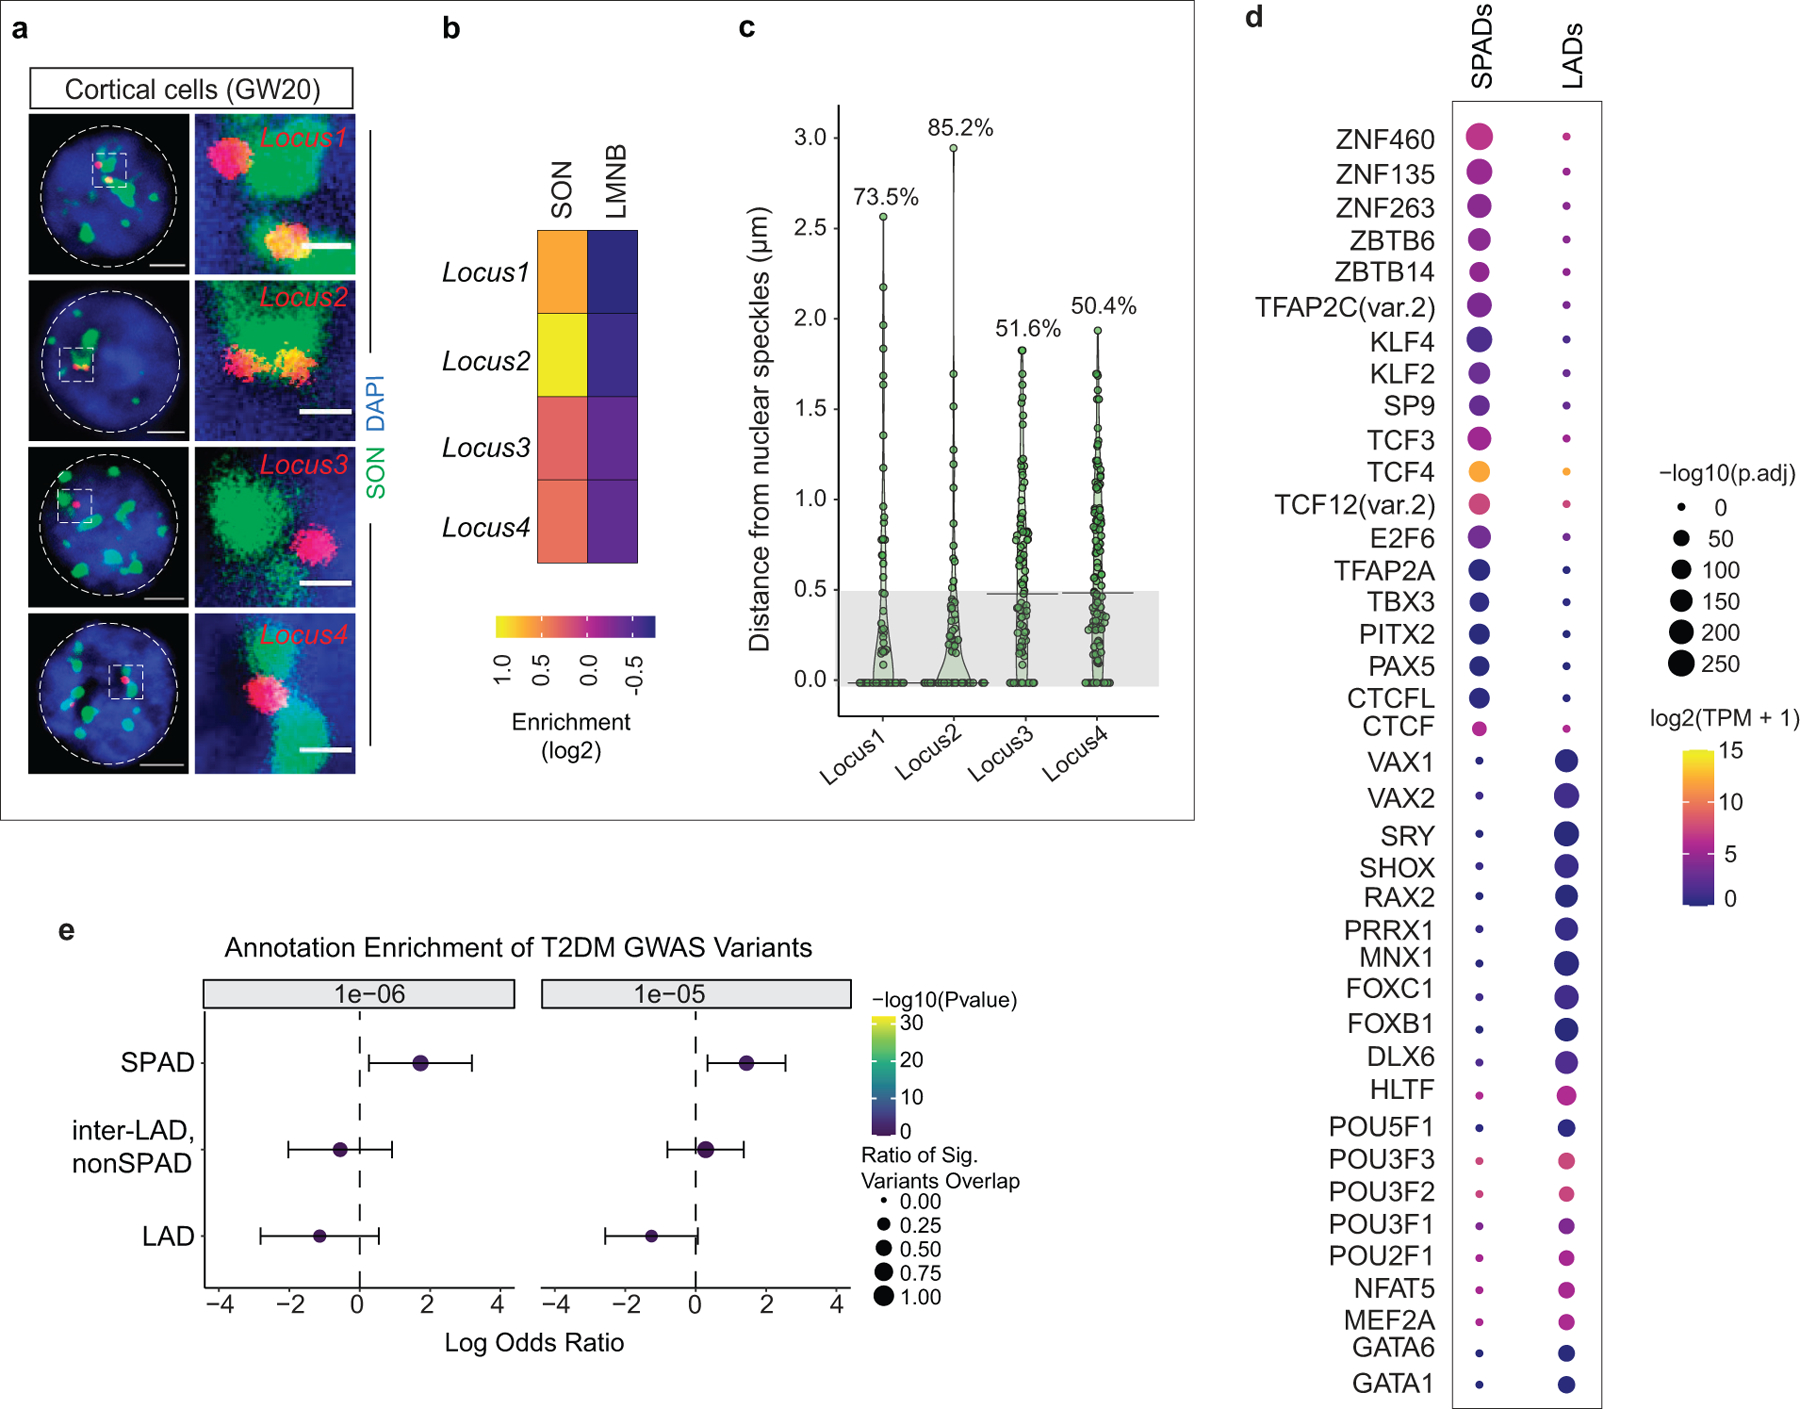
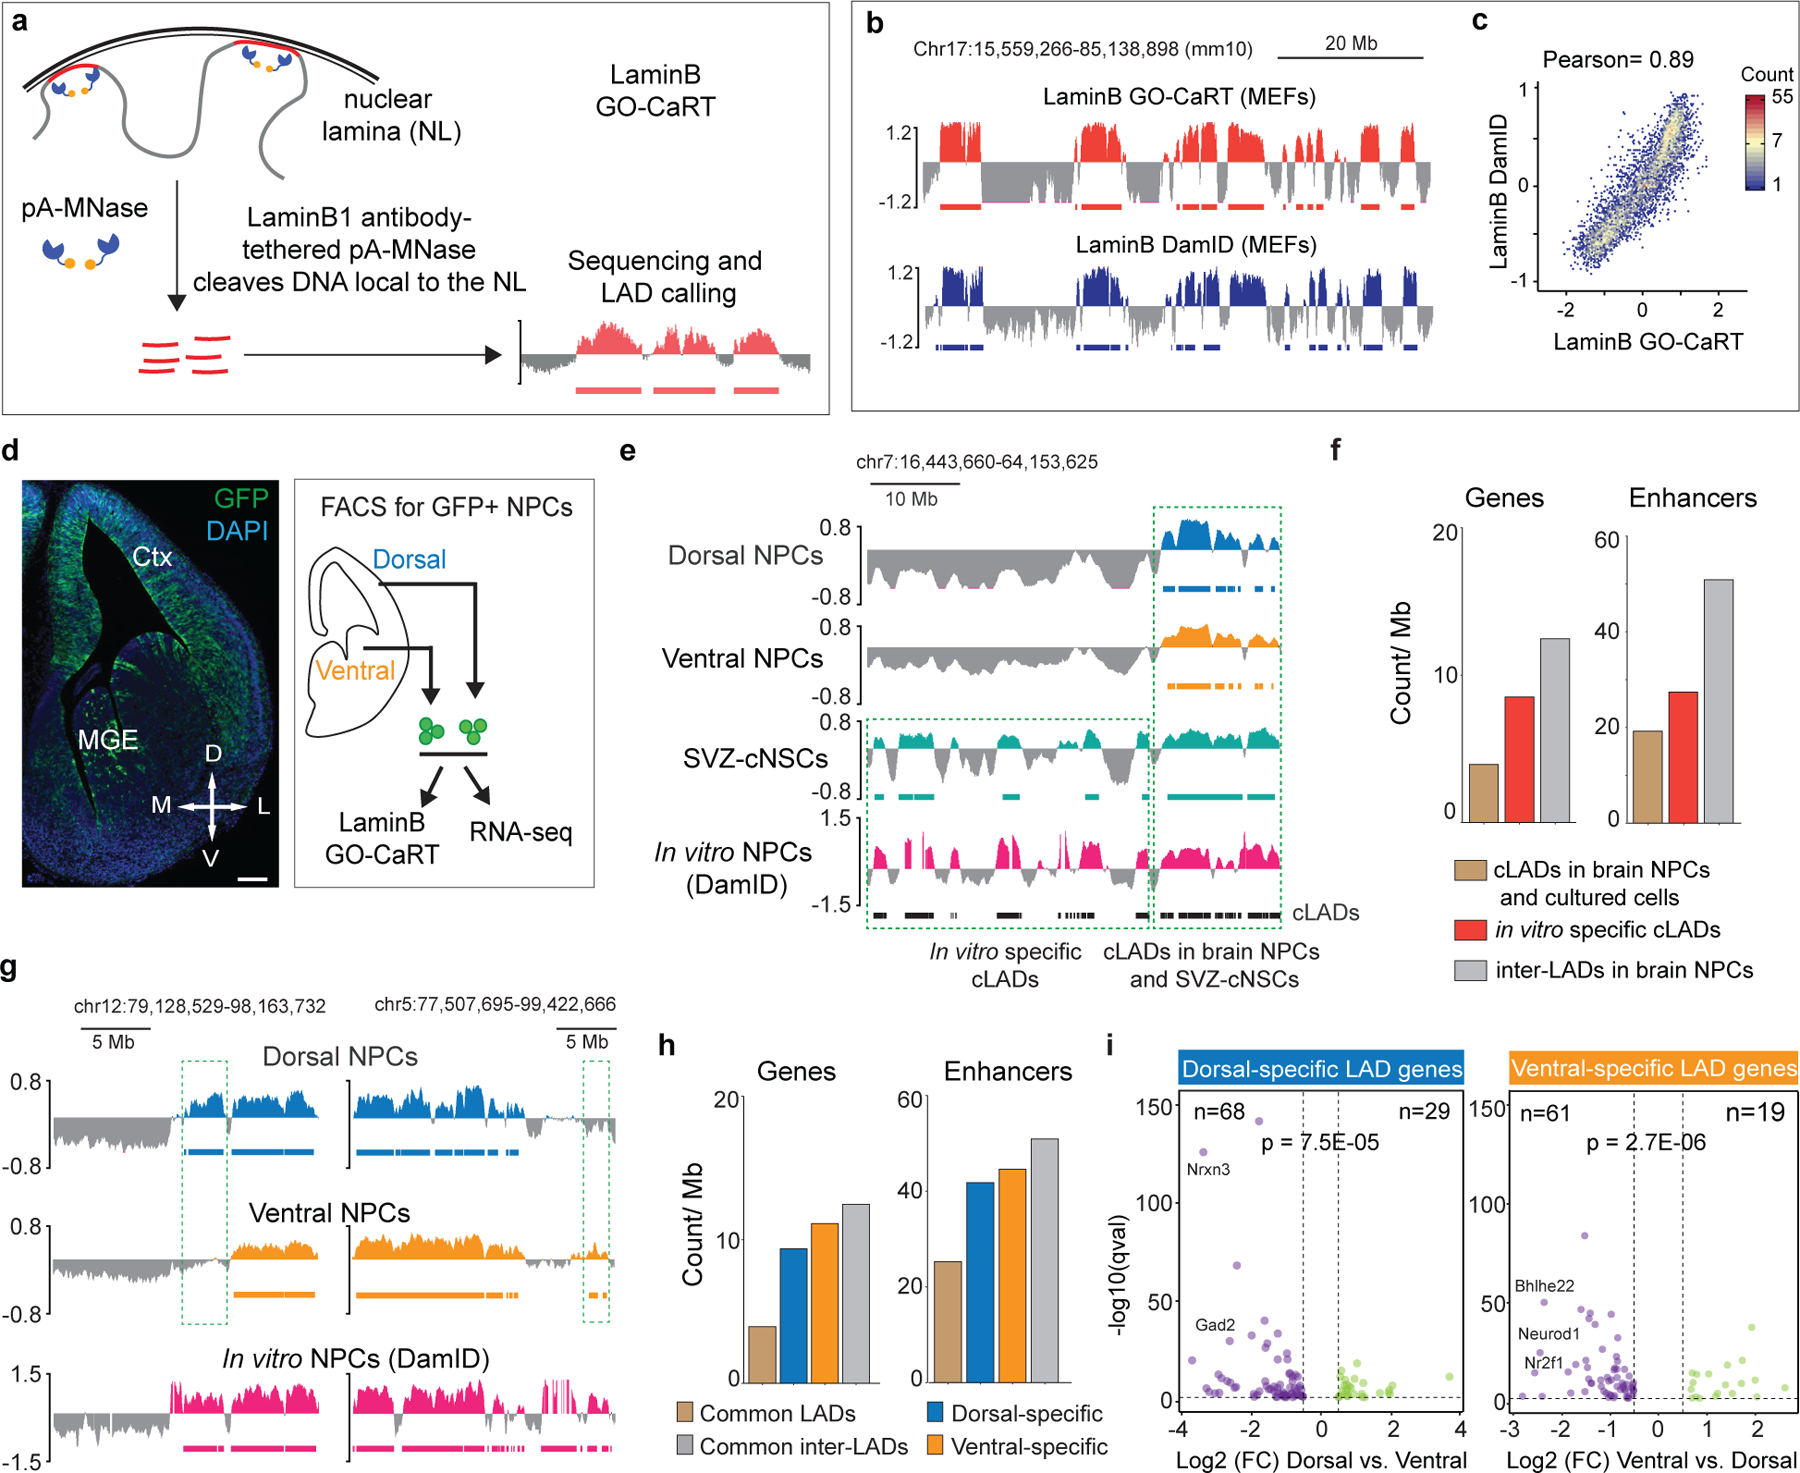
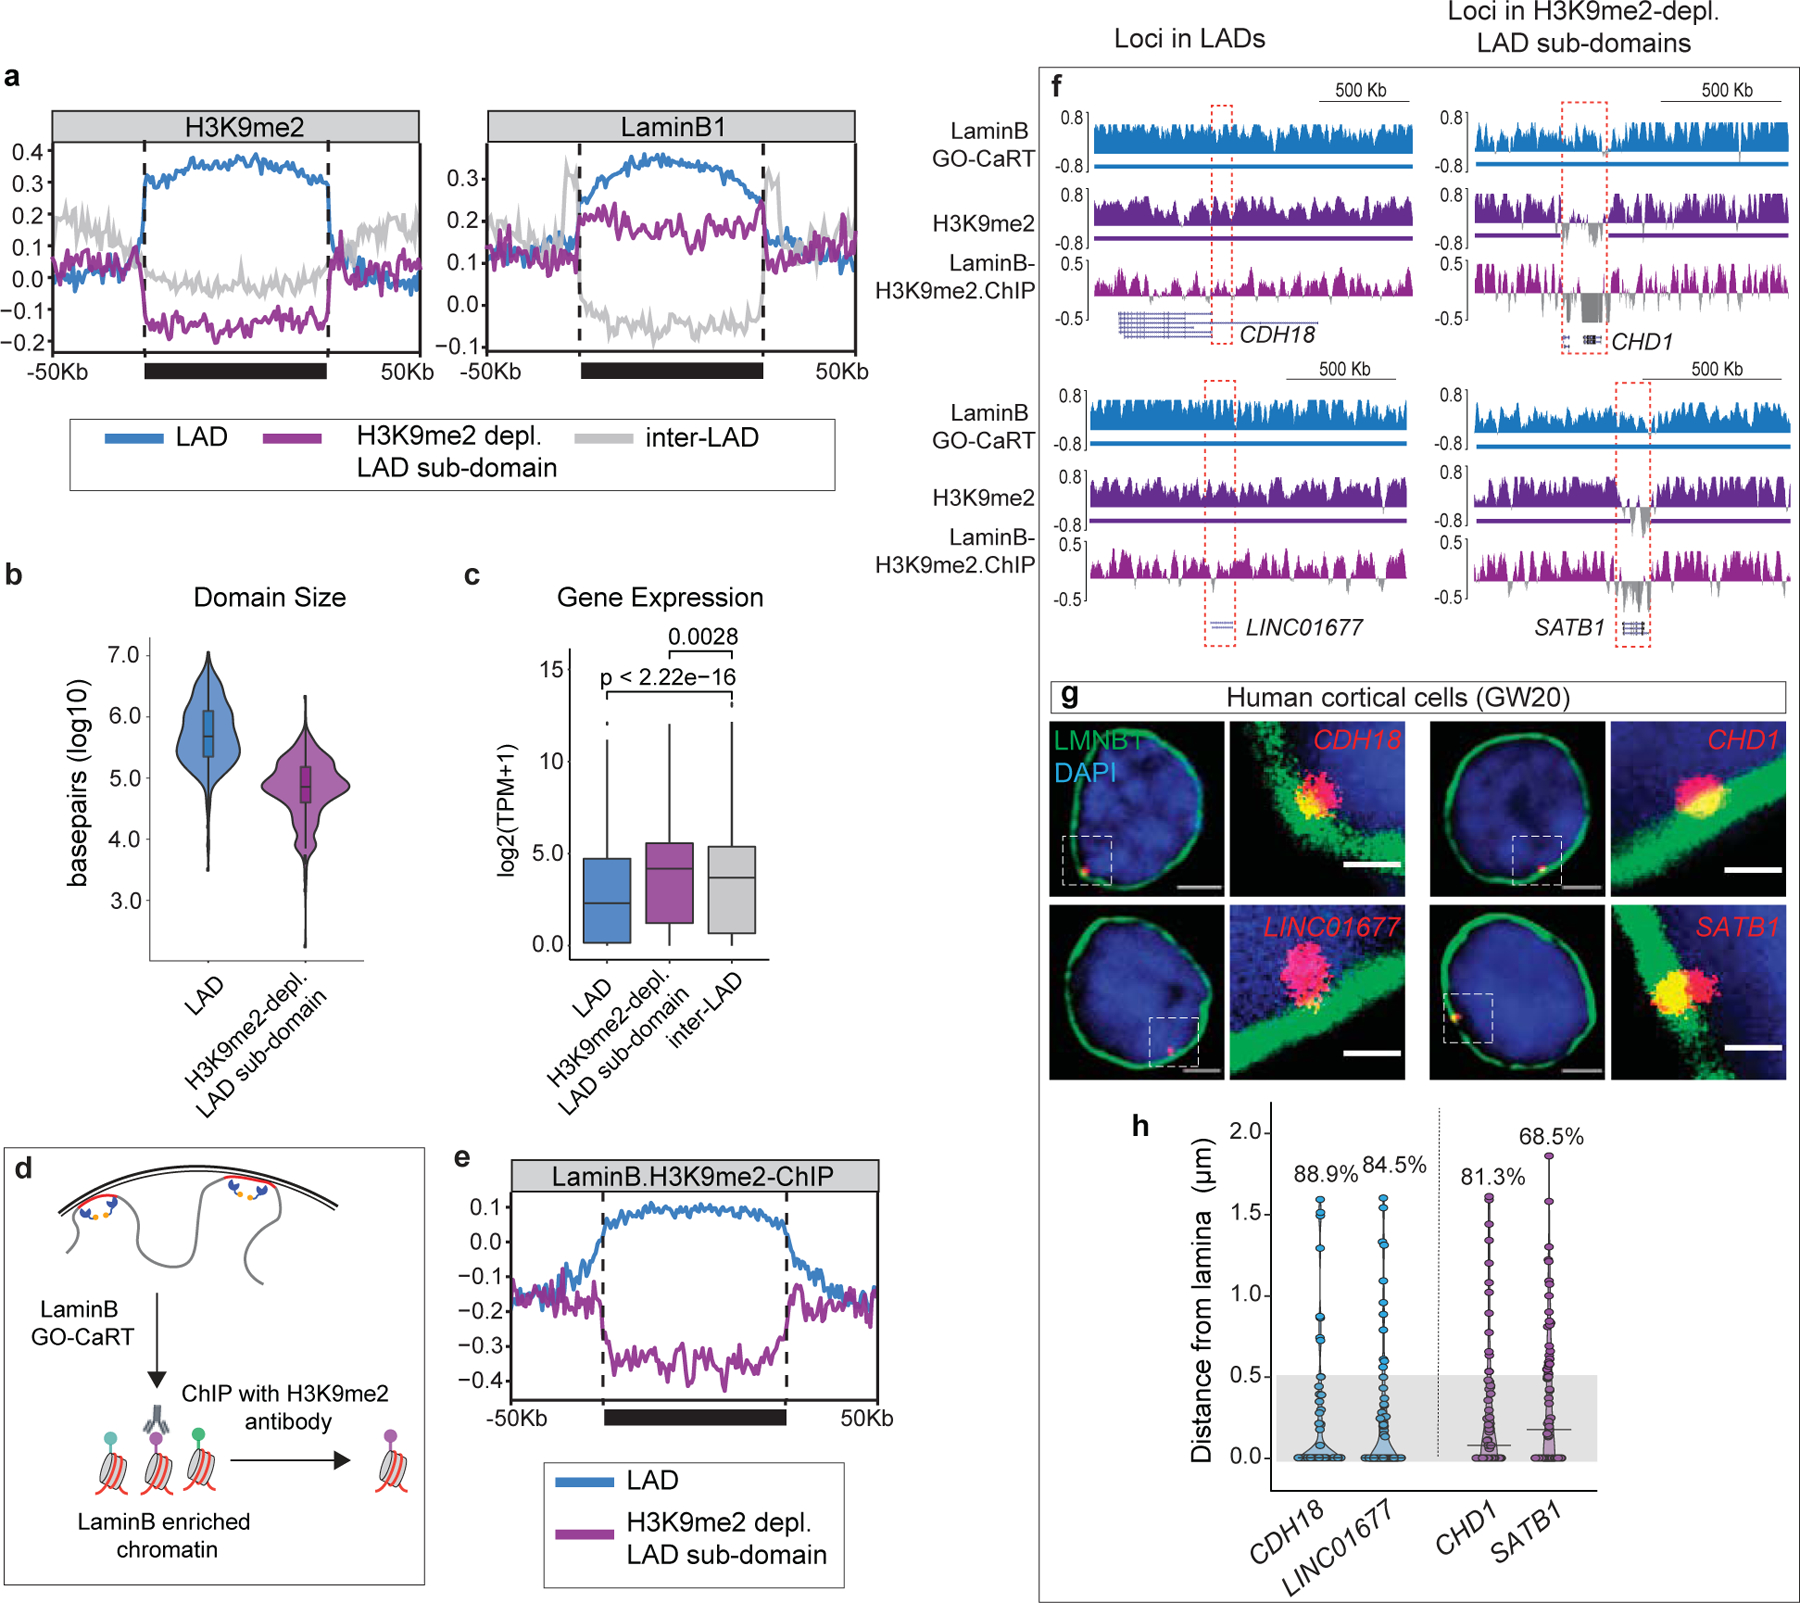
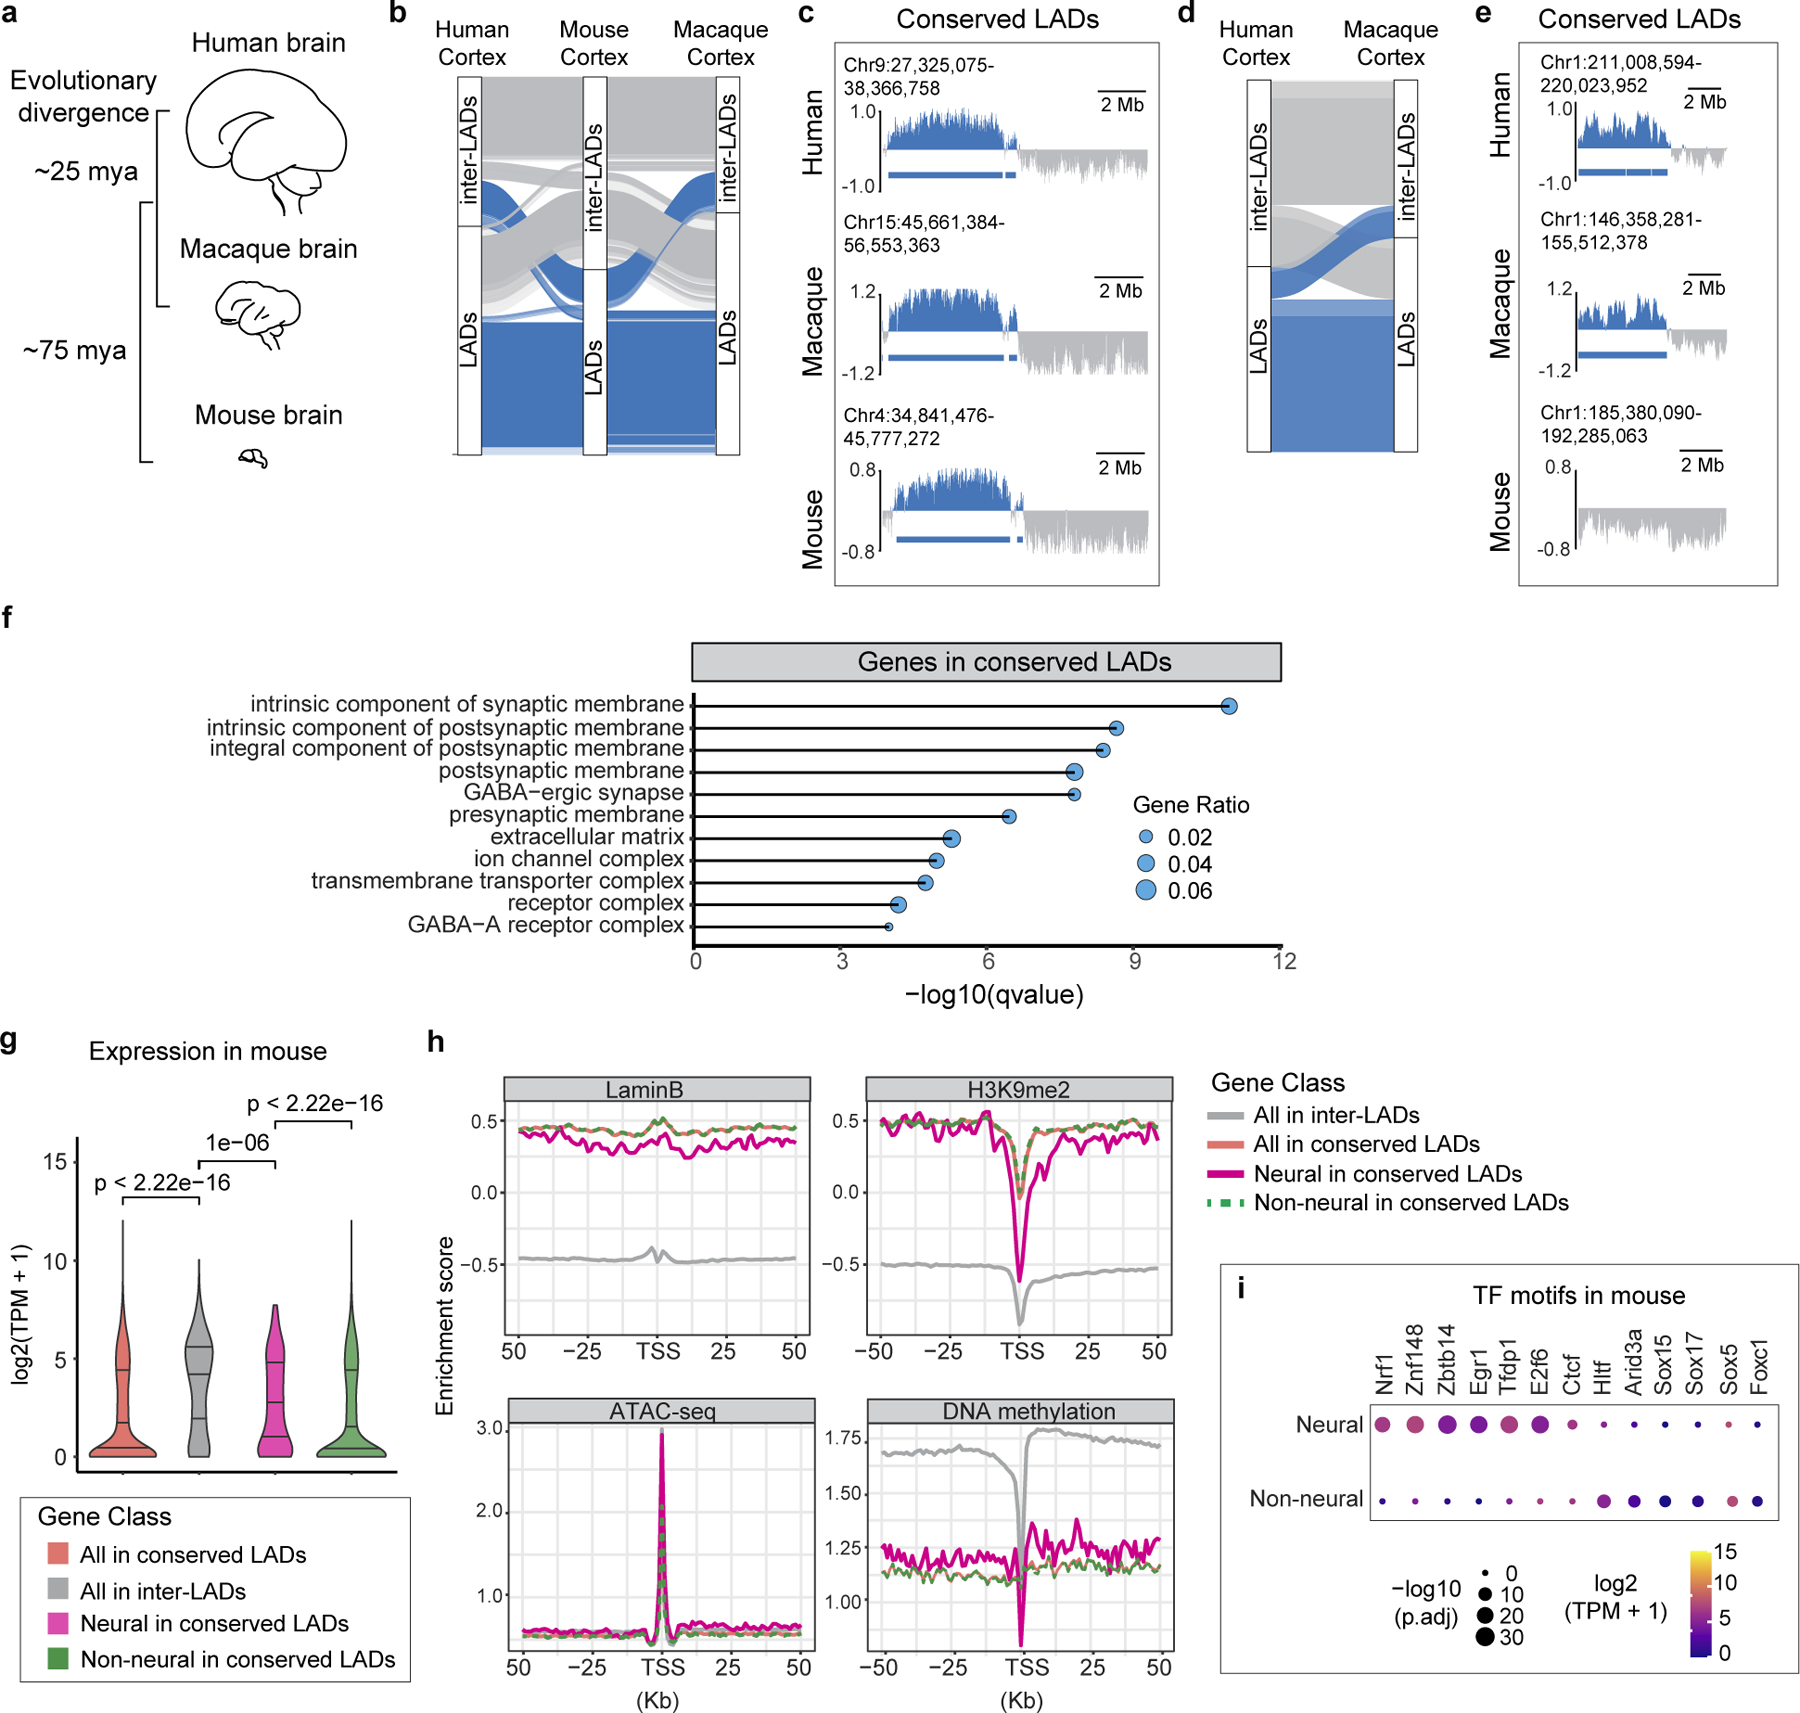
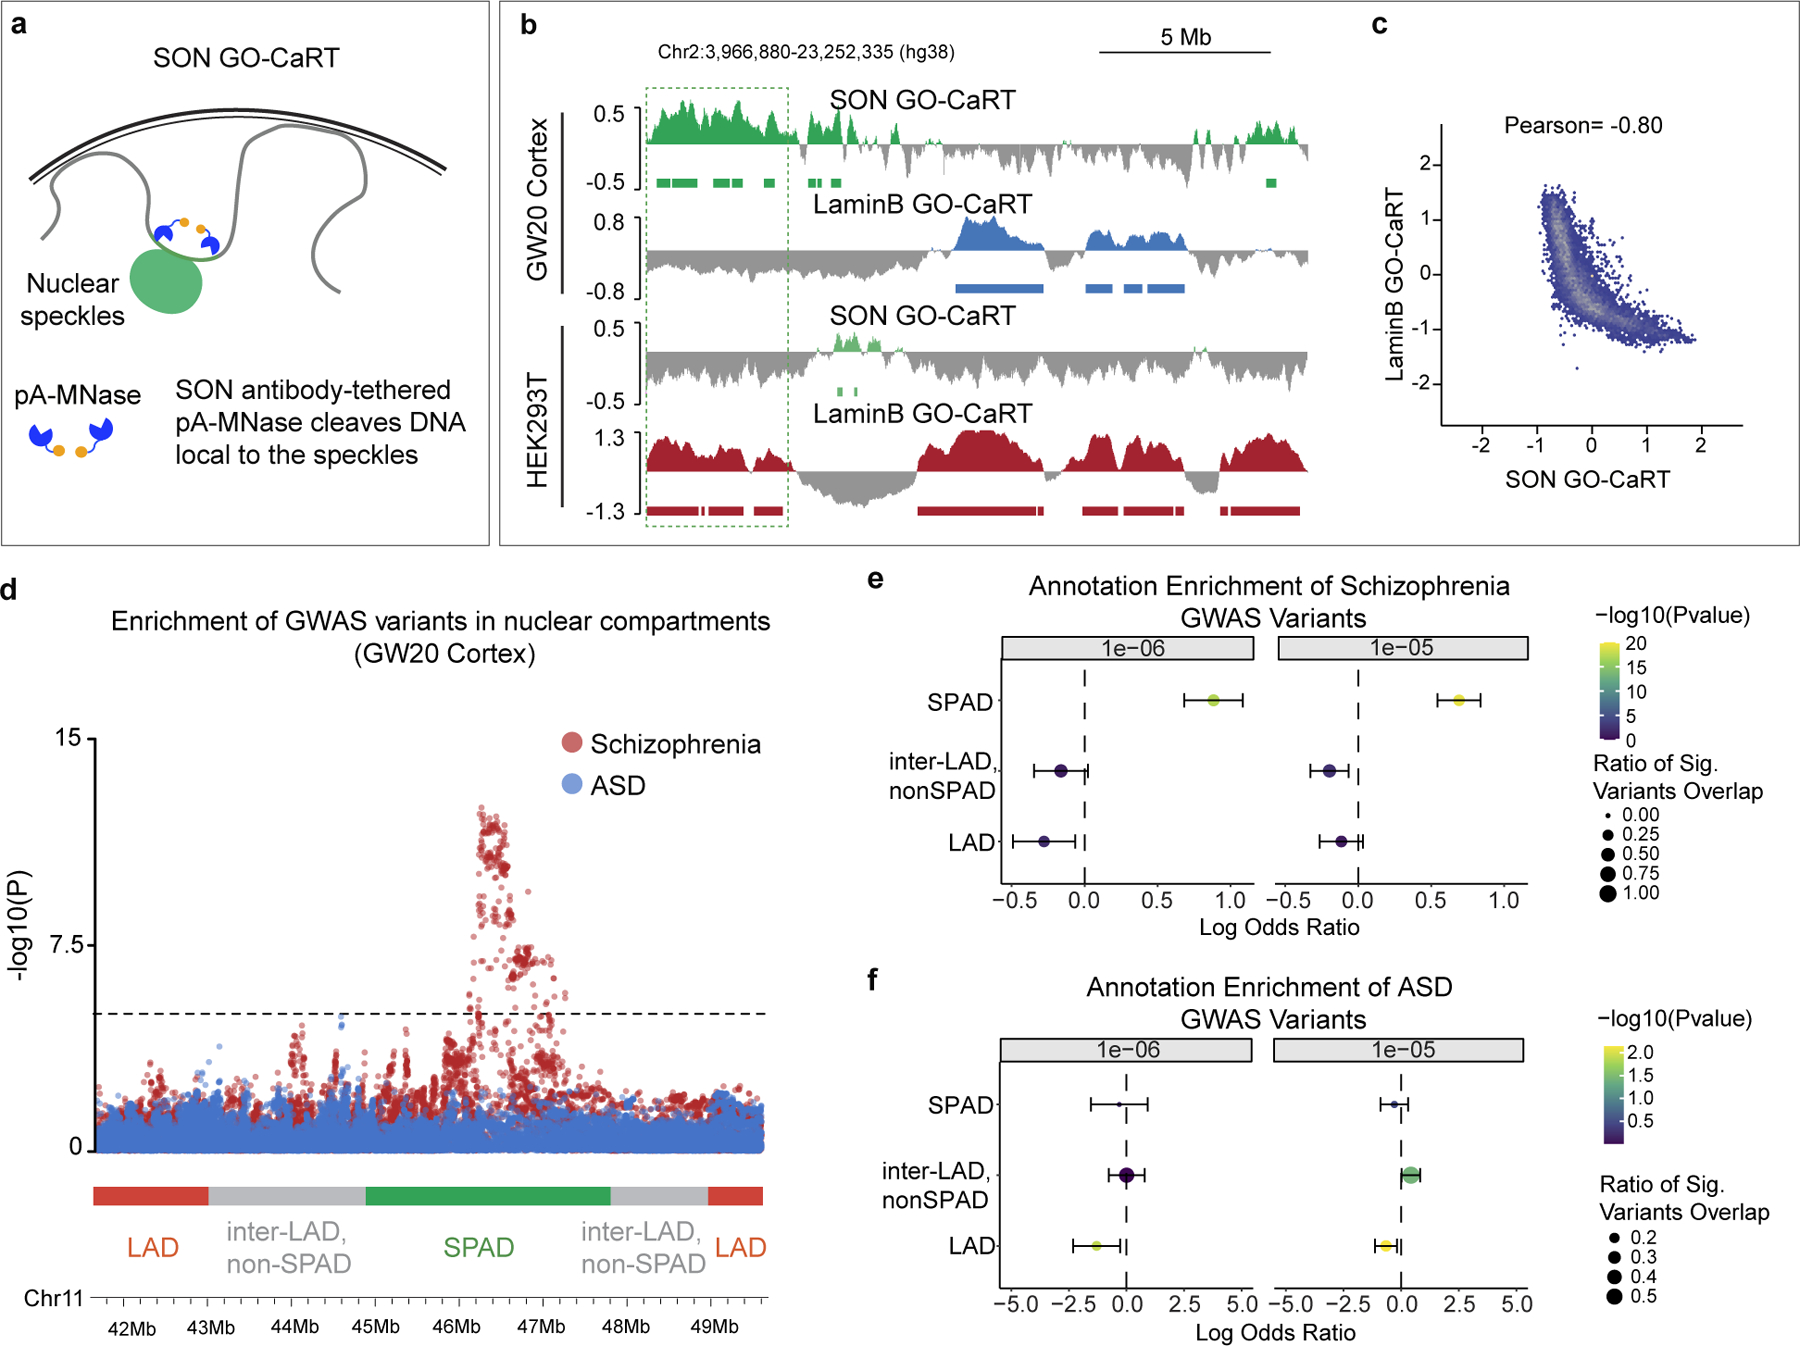
Nuclear compartments are thought to play a role in three-dimensional genome organization and gene expression. In mammalian brain, the architecture and dynamics of nuclear compartment-associated genome organization is not known. In this study, we developed Genome Organization using CUT and RUN Technology (GO-CaRT) to map genomic interactions with two nuclear compartments-the nuclear lamina and nuclear speckles-from different regions of the developing mouse, macaque and human brain. Lamina-associated domain (LAD) architecture in cells in vivo is distinct from that of cultured cells, including major differences in LADs previously considered to be cell type invariant. In the mouse and human forebrain, dorsal and ventral neural precursor cells have differences in LAD architecture that correspond to their regional identity. LADs in the human and mouse cortex contain transcriptionally highly active sub-domains characterized by broad depletion of histone-3-lysine-9 dimethylation. Evolutionarily conserved LADs in human, macaque and mouse brain are enriched for transcriptionally active neural genes associated with synapse function. By integrating GO-CaRT maps with genome-wide association study data, we found speckle-associated domains to be enriched for schizophrenia risk loci, indicating a physical relationship between these disease-associated genetic variants and a specific nuclear structure. Our work provides a framework for understanding the relationship between distinct nuclear compartments and genome function in brain development and disease.


Conflict of interest statement

Competing Interests

The authors declare no competing interests

Figures

Extended Data Fig. 1
Extended Data Fig. 1. Gene expression and chromatin features of LADs identified by GO-CaRT in 3T3 MEFs.
a, Venn diagram showing percent overlap of LAD coverage between GO-CaRT and DamID in MEFs. b, Box and whiskers plot depicting average gene expression (RNA-seq- SRX803943, SRX803944) in LADs and inter-LADs defined by GO-CaRT and DamID in MEFs. p= Two-tailed student’s t-test. GO-CaRT LADs, n=4390, inter-LADs, n=30499; DamID LADs, n=5313, inter-LADs, n=29576, n= number of genes. Boxes show the range from lower (25th percentile) to upper quartiles (75th percentile), with the median line (50th percentile); whiskers extend 1.5 times the inter-quartile range from bounds of box. c-e, Average H3K9me2 (c), H3K9me3 (d) and H3K27me3 (e) signal over LADs and flanking regions (400 Kb). Average LaminB signal (red) is also shown in each plot.
Extended Data Fig. 2
Extended Data Fig. 2. Gene density and expression in LADs identified in mouse brain NPCs in vivo.
a, Circos plot showing LaminB enrichment and LADs (horizontal bars) across the mouse chromosomes (1–19) in dorsal and ventral NPCs. b, LAD and inter-LADs gene density in brain NPCs (GO-CaRT) and indicated cultured cell lines (DamID). ASCs, astrocytes., ESCs, embryonic stem cells. c, Box plot depicting average gene expression in LADs (dorsal, n=3683; ventral, n= 3520) and inter-LADs (dorsal, n=18849; ventral, n=19014) as determined by RNA-seq in dorsal and ventral NPCs, n= number of genes. p= Two-tailed students t-test. Boxes show the range from lower (25th percentile) to upper quartiles (75th percentile), with the median line (50th percentile); whiskers extend 1.5 times the inter-quartile range from bounds of box.
Extended Data Fig. 3
Extended Data Fig. 3. Comparison of in vitro and in vivo identified LADs.
a, Venn diagram showing percent overlap of LAD coverage between brain NPCs and in vitro NPCs (DamID). b, Representative micrographs of DNA-FISH (red) with LaminB ICC (green) in brain NPCs and SVZ-cNSCs for four loci previously annotated as cLADs. Scale bar 2 μm. Multiple images were taken to quantitate sub-nuclear localization of the DNA-FISH loci. c, Quantifications of DNA-FISH for loci shown in b. Percentages indicate loci within 0.5 μm (grey area) from the nuclear lamina. 50–60 nuclei were quantified for each locus. d, LaminB GO-CaRT tracks in brain NPCs, SVZ-cNSCs and in vitro NPCs (DamID) over cLAD DNA-FISH loci (dashed box) shown in b. e, LaminB GO-CaRT tracks of brain NPCs, E13 lung, E13 liver, SVZ-cNSCs and 3T3 MEFs. In vitro NPC and cLAD track (shown on top) are DamID derived. Dashed box indicates a region where some previously annotated “cLADs” are not observed in tissues in vivo but detected by GO-CaRT in SVZ-NSCs and 3T3 MEFs. f, Venn diagram showing percent overlap of LAD coverage between cLADs and LADs common to brain, lung and liver.
Extended Data Fig. 4
Extended Data Fig. 4. Regional differences in LAD architecture of mouse brain NPCs.
a, Heatmap showing gene expression differences (row normalized) of marker genes in dorsal and ventral regions of the E13 mouse forebrain. R1 and R2 indicate two biological replicates. b, Venn diagram showing percent overlap of LAD coverage between dorsal and ventral NPCs. c, LaminB GO-CaRT tracks showing additional examples of brain region-specific LADs (dashed boxes). d, DNA-FISH micrographs of indicated loci in dorsal and ventral NPCs. Nuclear lamina is marked by LaminB1 staining (green). Scale bar 2 μm. Multiple images were taken to quantitate sub-nuclear localization of the DNA-FISH loci. e, Quantifications of DNA-FISH for the loci shown in c. Percentages indicate loci within 0.5 μm (grey area) from the nuclear lamina. 50–60 nuclei were quantified for each locus. f, LaminB GO-CaRT tracks in brain NPCs and in vitro NPCs (DamID) over DNA-FISH loci (dashed boxes) shown in d. g, Percent coverage of SINE and LINE repeat elements in brain region-specific LADs, common LADs and inter-LADs. h, Box plot depicting differential expression of genes that have quantitative differences in LaminB enrichment (top 20 percentile) between ventral vs. dorsal NPCs. LaminB decreased, n=150, LaminB increased, n=150. p= Two-tailed students t-test. Boxes show the range from lower (25th percentile) to upper quartiles (75th percentile), with the median line (50th percentile); whiskers extend 1.5 times the inter-quartile range from bounds of box. i, Top enriched GO-terms (biological process) of differentially expressed genes in dorsal- and ventral-specific LADs. GO terms were sorted based on their significance, -log10(qvalue), the size of the bubble represents the gene ratio for each term.
Extended Data Fig. 5
Extended Data Fig. 5. Regional differences in LAD architecture of human brain NPCs.
a, Schematic of a GW20 human brain (coronal view) showing regions sampled for GO-CaRT and RNA-seq. b, Circos plot showing LaminB enrichment and LADs (horizontal bars) across the human chromosomes (1–22) in GW20 cortex and MGE. c, Heatmap showing gene expression differences (row normalized) of marker genes in GW20 cortex and MGE. R1 and R2 indicate two biological replicates. d, Jaccard similarity matrix of GO-CaRT LADs identified in human cortex and MGE and DamID LADs in indicated cultured cell lines. e, Venn diagram showing percent overlap of LAD coverage between GW20 cortex and MGE. f, Representative LaminB GO-CaRT profiles of GW20 cortex and MGE. Dashed boxes show brain region-specific LADs. g, Genomic features of human brain region-specific LADs, common LADs and inter-LADs. h, Volcano plot showing differentially expressed genes in GW20 cortex- and MGE- specific LADs. Each dot represents a single gene with its differential gene expression level plotted on the x-axis and statistical significance (q-value<0.5) on y-axis. p= Chi-square goodness of fit test. i, Top enriched GO-terms (biological process) of differentially expressed genes in cortex- and MGE- specific LADs. GO terms were sorted based on their significance, -log10(qvalue), the size of the bubble represents the gene ratio for each term.
Extended Data Fig. 6
Extended Data Fig. 6. Chromatin context of active LAD genes in human cortex and H3K9me2-depleted LAD sub-domains in mouse cortex.
a, H3K9me2, LaminB, ATAC-seq and DNA methylation signal over TSS and surrounding regions for active genes in LADs (TPM>1, red), repressed genes in LADs (TPM<1, turquoise) and genes in inter-LADs (grey) in GW20 human cortex. b, Representative LaminB GO-CaRT tracks showing H3K9me2-depleted LAD sub-domains (marked by dashed boxes) in the mouse cortical/dorsal NPCs. c, Average H3K9me2 and LaminB signal over LADs (blue), H3K9me2-depleted LAD sub-domains (purple) and inter-LADs (grey) in mouse cortical NPCs scaled to the same relative size depicted by a solid horizontal bar. Traces in the 50Kb flanking proximal and distal regions are unscaled. d, Violin plot depicting the size in base pairs (log10) of LADs (n=743) and H3K9me2-depleted LAD sub-domains (n=664) identified in mouse cortical NPCs. e, Average gene expression in LADs (n=3546), H3K9me2-depleted LAD sub-domains (n=799) and inter-LADs (n=18442) in mouse cortical NPCs, n= number of genes. p= Wilcoxon rank sum test. Two-sided. Non-adjusted. Boxes show the range from lower (25th percentile) to upper quartiles (75th percentile), with the median line (50th percentile); whiskers extend 1.5 times the inter-quartile range from bounds of box.
Extended Data Fig. 7
Extended Data Fig. 7. LAD conservation in cortex and MGE across macaque, human and mouse.
a, Circos plot showing LaminB enrichment and LADs (horizontal bars) across the macaque chromosomes (1–20) in PCD80 cortex and MGE. b, Percent LAD coverage in cortex and MGE across human, macaque and mouse. c, Alluvial plot depicting conserved LADs (blue) across human, macaque and mouse cortex using human as anchor species for liftover. Inter-LADs are shown in grey. d, A donut plot depicting conservation of mouse cortex/MGE shared LADs (brown) in macaque and human. Brain region-specific LADs are shown in white. e, Representative LaminB GO-CaRT profiles over LADs that are shared between cortex and MGE across human, macaque and mouse.
Extended Data Fig. 8
Extended Data Fig. 8. Features of neural and non-neural genes in conserved LADs.
a, Gene density in conserved LADs, all LADs, non-conserved LADs and inter-LADs identified based on mouse and human liftover. b, Top enriched GO-terms of genes in conserved LADs based on mouse liftover. GO terms were sorted based on their significance, -log10(qvalue), the size of the bubble represents the gene ratio for each term. BP- Biological Process; MF- Molecular Function. c, Violin plot showing average gene expression in GW20 human cortex for all genes (red, n=1365), neural genes (pink, n=271) and non-neural genes (green, n=1094) in conserved LADs. For comparison expression is also shown for genes in inter-LADs (grey, n=17291). p= Wilcoxon rank sum test. Two-sided. Non-adjusted. d, LaminB signal (human GW20 cortex) over TSS and surrounding regions over the same gene sets as in c. e, Enriched motifs in neural and non-neural gene promoters in human. The size of the circle represents enrichment scores based on the P value from HOMER and color indicates the gene expression of the corresponding TFs in human GW20 cortex.
Extended Data Fig. 9
Extended Data Fig. 9. Gene expression and chromatin features of SPADs, inter-LAD, nonSPADs and LADs in human cortex.
a, Genome-wide scatter plot showing Pearson correlation between SON GO-CaRT in HEK293T cells and SON TSA-seq in K562 cells. b, Circos plot showing SON GO-CaRT (green) and LaminB GO-CaRT profiles (blue) across the human chromosomes (1–22) in GW20 cortex. SPADs and LADs are shown by green and blue horizontal bars, respectively. c, Violin plot depicting average gene expression in LADs (blue, n=3105), non-speckle inter-LADs (grey, n=9452) and SPADs (green, n=8272) as determined by RNA-seq in GW20 human cortex, n= number of genes. p= Wilcoxon rank sum test. Two-sided. Non-adjusted. d, Average enrichment of various chromatin marks in LADs (blue), non-speckle inter-LADs (grey) and SPADs (green) in GW20 cortex. Mean enrichment of chromatin marks over each region scaled to the relative size of each region, which is depicted by the black horizontal. Traces in the 25 Kb flanking proximal and distal regions are unscaled.
Extended Data Fig. 10
Extended Data Fig. 10. DNA-FISH validation of SPADs and TF motif analyses of SPADs and LADs.
a, DNA-FISH micrographs of four SPAD loci in human GW20 cortical cells. Nuclear speckles are marked by SON ICC (green). Scale bar 2 μm, higher magnification 0.5 μm. b, SON and LaminB enrichment for SPAD loci shown in a. c, Quantifications of DNA-FISH for SPAD loci shown in a. Percentages indicate loci within 0.5 μm (grey area) from the nuclear speckles. 50–60 nuclei were quantified for each locus. d, Enriched motif in SPADs and LADs of GW20 cortex. The size of the circle represents enrichment scores based on the P value from HOMER and color indicates the gene expression of the corresponding TFs in GW20 cortex. e, Log odds ratio of enrichment of significant variants overlapping a given genomic compartment with 95% confidence intervals for T2D GWAS, where significant variants are defined as having a GWAS summary statistic of P < 1e-6 (left) or P < 1e-5 (right). Size of circle represents the fraction of significant variants overlapping a genomic compartment. Wald Test. Two-sided. Non-adjusted. Bars represent standard error. LAD, n=704, SPAD, n=1047, inter-LAD, non-SPAD, n=1810.
Figure 1 |
Figure 1 |. GO-CaRT enables mapping of genome-lamina interactions in mammalian brain.
a, Schematic of LaminB GO-CaRT, wherein pA-MNase is recruited to the nuclear lamina (NL) by a LaminB1 antibody resulting in cleavage of NL proximal DNA, followed by DNA extraction, sequencing and LAD calling. b, Representative LaminB interaction profiles generated by LaminB GO-CaRT and LaminB DamID in 3T3 MEFs. Y-axis depict log2 ratio of LaminB over IgG (LaminB GO-CaRT) or LaminB-Dam over Dam only (DamID). LADs are depicted below traces by solid horizontal bars. c, Genome-wide scatter plot showing Pearson correlation between LaminB GO-CaRT and LaminB DamID in 3T3 MEFs. d, Coronal section of E13 mouse brain from Nes-TK-GFP mice and FACS isolation of GFP+ Nestin- (a neural stem cell marker) expressing NPCs (green) from the dorsal and ventral forebrain for LaminB GO-CaRT and RNA-seq. Ctx- Cortex; MGE- Median ganglionic eminence; Scale bar 100 μm. Similar staining was observed from two E13 brains. e, Representative LaminB GO-CaRT profiles of dorsal and ventral brain NPCs, SVZ-cNSCs and LaminB-DamID profile of in vitro NPCs (ESC-derived NPCs). Dashed box shows a region where some previously annotated “cLADs” (black horizontal bars) were not observed in brain NPCs but were detected in SVZ-cNSCs by LaminB GO-CaRT. f, Gene and enhancer density of in vitro specific cLADs, cLADs that were observed in both brain NPCs and cultured cells and inter-LADs in brain NPCs. g, Representative LaminB GO-CaRT profiles of dorsal and ventral NPCs. Dashed boxes show brain region-specific LADs. h, Gene and enhancer density in brain region-specific LADs, common LADs and inter-LADs. i, Volcano plot showing differentially expressed genes in mouse dorsal and ventral-specific LADs. Each dot represents a single gene with its differential gene expression level plotted on the x-axis and statistical significance (q-value <0.5) on y-axis. Some dorsally and ventrally important genes are indicated. p= Chi-square goodness of fit test.
Figure 2 |
Figure 2 |. LAD mapping in human brain identifies transcriptionally active, H3K9me2-depleted LAD sub-domains.
a, Average H3K9me2 and LaminB signal over LADs (blue), H3K9me2-depleted LAD sub-domains (purple) and inter-LADs (grey) scaled to the same relative size depicted by a solid horizontal bar. Traces in the 50Kb flanking proximal and distal regions are unscaled. b, Violin plot depicting the size in base pairs (log10) of LADs (n=742) and H3K9me2-depleted LAD sub-domains (n=492) identified in GW20 cortex. c, Average gene expression in LADs (n=3105), H3K9me2-depleted LAD sub-domains (n=614) and inter-LADs (n=17045), n= number of genes. p= Wilcoxon rank sum test. Two-sided. Non-adjusted. Boxes show the range from lower (25th percentile) to upper quartiles (75th percentile), with the median line (50th percentile); whiskers extend 1.5 times the inter-quartile range from bounds of box. d, Schematic of LaminB GO-CaRT.ChIP, wherein LaminB enriched chromatin is immunoprecipitated with an H3K9me2 antibody. e, Average LaminB-H3K9me2 ChIP signal over LADs and H3K9me2-depleted LAD sub-domains scaled to the same relative size depicted by a solid horizontal bar. Traces in the 50Kb flanking proximal and distal regions are unscaled. f, LaminB GO-CaRT tracks of DNA-FISH loci (marked by dashed box) located in LADs and H3K9me2-depleted LAD sub-domains. g, Representative micrographs of DNA-FISH with LaminB ICC (green) in human GW20 cortical cells for loci located in LADs (CDH18, LINC01677) and H3K9me2-depleted LAD sub-domains (CHD1, SATB1). Scale bar 2 μm, higher magnification 0.5 μm. Multiple images were taken to quantitate sub-nuclear localization of the DNA-FISH loci. h, Quantifications of DNA-FISH loci shown in g. Percentages indicate loci within 0.5 μm (grey area) from the nuclear lamina. 50–60 nuclei were quantified for each locus.
Figure 3 |
Figure 3 |. Evolutionarily conserved LADs are enriched in transcriptionally active neural genes.
a. Schematic of the developing human, macaque and mouse brain and their evolutionary divergence in million years. b, Alluvial plot depicting conserved LADs (blue) across human, macaque and mouse cortex using mouse as anchor species for liftover. Inter-LADs are shown in grey. c, Representative LaminB GO-CaRT profiles over a conserved LAD in human, macaque and mouse cortex. d, Alluvial plot depicting conserved LADs (blue) between human and macaque cortex using human as anchor species for liftover. Inter-LADs are shown in grey. e, Representative LaminB GO-CaRT profiles over a LAD that is conserved in human and macaque but not in mouse. f, Top enriched GO-terms (cellular component) of genes in conserved LADs based on mouse liftover. GO terms were sorted based on their significance, -log10(qvalue), the size of the bubble represents the gene ratio for each term. g, Violin plot showing average gene expression for all genes (red, n=1625), neural genes (pink, n=279) and non-neural genes (green, n=1346) in conserved LADs. For comparison, expression is also shown for genes in inter-LADs (grey, n=18657). p= Wilcoxon rank sum test. Two-sided. Non-adjusted. h, LaminB, H3K9me2, ATAC-seq and DNA methylation signal over TSS and surrounding regions over the same gene sets as in g. i, Enriched motifs in neural and non-neural gene promoters based on mouse liftover. The size of the circle represents enrichment scores based on the P value from HOMER and color indicates the gene expression of the corresponding TFs in mouse cortex.
Figure 4 |
Figure 4 |. SPADs identified in the human cortex are enriched in schizophrenia risk loci.
a, Schematic of SON GO-CaRT for mapping genomic regions proximal to the nuclear speckles with SON antibody. b, Representative SON GO-CaRT and LaminB GO-CaRT profiles in the GW20 human cortex and HEK293T cells. Dashed line illustrates a SPAD in human cortex that become a LAD in HEK293T cells. c, Genome-wide scatter plot showing Pearson correlation between SON GO-CaRT and LaminB GO-CaRT. d, Representative genomic region showing enrichment of GWAS risk variants for schizophrenia and ASD in nuclear compartments. Dashed line indicate threshold for statistical significance. Each circle represents a variant for SCZ (red) or ASD (blue). Red, green and grey horizontal bars represent LAD, SPAD and non-SPAD inter-LAD compartments, respectively. e-f, Log odds ratio of enrichment of significant variants overlapping a given genomic compartment with 95% confidence intervals for schizophrenia (e) or ASD (f) GWAS, where significant variants are defined as having a GWAS summary statistic of P < 1e-6 (left) or P < 1e-5 (right). Size of circle represents the fraction of significant variants overlapping a genomic compartment. Wald Test. Two-sided. Non-adjusted. Bars represent standard error. LAD, n=704, SPAD, n=1047, inter-LAD, non-SPAD, n=1810.

Similar articles

Cited by

References

    1. Fraser P & Bickmore W Nuclear organization of the genome and the potential for gene regulation. Nature 447, 413–417, doi:10.1038/nature05916 (2007). - DOI - PubMed
    1. Zhao R, Bodnar MS & Spector DL Nuclear neighborhoods and gene expression. Curr Opin Genet Dev 19, 172–179, doi:10.1016/j.gde.2009.02.007 (2009). - DOI - PMC - PubMed
    1. van Steensel B & Belmont AS Lamina-Associated Domains: Links with Chromosome Architecture, Heterochromatin, and Gene Repression. Cell 169, 780–791, doi:10.1016/j.cell.2017.04.022 (2017). - DOI - PMC - PubMed
    1. Chen Y et al.Mapping 3D genome organization relative to nuclear compartments using TSA-Seq as a cytological ruler. J Cell Biol 217, 4025–4048, doi:10.1083/jcb.201807108 (2018). - DOI - PMC - PubMed
    1. Lamond AI & Spector DL Nuclear speckles: a model for nuclear organelles. Nat Rev Mol Cell Biol 4, 605–612, doi:10.1038/nrm1172 (2003). - DOI - PubMed

Publication types