. 2021 Aug;53(8):1143-1155.
doi: 10.1038/s41588-021-00894-z. Epub 2021 Jul 8.

Single-nucleus chromatin accessibility and transcriptomic characterization of Alzheimer's disease

Affiliations

Single-nucleus chromatin accessibility and transcriptomic characterization of Alzheimer's disease

Samuel Morabito et al. Nat Genet. 2021 Aug.

Abstract

The gene-regulatory landscape of the brain is highly dynamic in health and disease, coordinating a menagerie of biological processes across distinct cell types. Here, we present a multi-omic single-nucleus study of 191,890 nuclei in late-stage Alzheimer's disease (AD), accessible through our web portal, profiling chromatin accessibility and gene expression in the same biological samples and uncovering vast cellular heterogeneity. We identified cell-type-specific, disease-associated candidate cis-regulatory elements and their candidate target genes, including an oligodendrocyte-associated regulatory module containing links to APOE and CLU. We describe cis-regulatory relationships in specific cell types at a subset of AD risk loci defined by genome-wide association studies, demonstrating the utility of this multi-omic single-nucleus approach. Trajectory analysis of glial populations identified disease-relevant transcription factors, such as SREBF1, and their regulatory targets. Finally, we introduce single-nucleus consensus weighted gene coexpression analysis, a coexpression network analysis strategy robust to sparse single-cell data, and perform a systems-level analysis of the AD transcriptome.


Figures

Extended Data Figure 1:
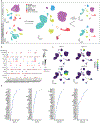
Extended Data Figure 1:. Batch correction of snATAC-seq, snRNA-seq, and merged datasets.
a, snRNA-seq UMAPs before (left) and after iNMF batch correction (right), colored by sequencing batch. b, snATAC-seq UMAPs before (left) and after MNN batch correction (right), colored by sequencing batch. c, Dot plot of iNMF metagene expression in each snRNA-seq cluster. d, snRNA-seq UMAPs colored by metagene expression of selected iNMF metagenes. e, Dot plots showing the iNMF loading for the top 30 genes for the same metagenes in d.
Extended Data Figure 2:
Extended Data Figure 2:. Cell-type immunostaining and in situ hybridization.
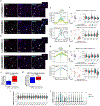
a-d, Representative immunofluorescence images from postmortem human brain tissue from control and late-stage AD cases for Iba-1 (a), GFAP (b) MAP2 (c), and 6E10 (d). e, Quantification of 6E10-positive amyloid plaques. n = 3 cognitively healthy controls, 3 late-stage AD. Data is presented as the average of three different sections per sample. Linear mixed-effects model **** p < 0.0001. Box boundaries and line correspond to the interquartile range (IQR) and median respectively. Whiskers extend to the lowest or highest data points that are no further than 1.5 times the IQR from the box boundaries. f, Representative immunofluorescence images from postmortem human brain tissue from control and late-stage AD cases for OLIG2 with PDGFRA co-labeling. g, h, Representative RNAscope images from postmortem human brain tissue from control and late-stage AD cases for CNP (g) and PLP1 (h) with DAPI counterstain.
Extended Data Figure 3:
Extended Data Figure 3:. Comparison of gene expression and gene activity.
a, Scatter plot comparing average gene activity from snATAC-seq and average gene expression from snRNA-seq by each major cell-type, with accompanying Pearson correlation statistics and linear regression lines. b, Donut chart showing the percent of genes with high chromatin accessibility and low gene expression in grey for each major cell-type. High chromatin accessibility was defined as genes in the top 20% of gene activity, while low gene expression was defined as genes in the bottom 20% of gene expression. Percent of all other genes are colored by the cell-type.
Extended Data Figure 4:
Extended Data Figure 4:. NEAT1 validation and neuronal TFs.
a, b, Representative RNAscope images from postmortem human brain tissue for NEAT1 and AQP4 staining (a) and NEAT1 and MOG staining (b) with DAPI nuclear counterstain. c, Boxplots showing quantification of NEAT1 puncta per AQP4+ astrocyte as in a. n = 4 cognitively healthy controls, 5 late-stage AD. d, Boxplots showing quantification of NEAT1 puncta per MOG+ oligodendrocyte as in b. n = 4 cognitively healthy controls, 4 late-stage AD. Data is represented as the mean of four equally sized regions per sample. Linear mixed-effects model e, Tn5 bias subtracted TF footprinting for JUN by snATAC-seq neuron cluster (top) and by AD diagnosis (bottom), with TF binding motif logo above and Tn5 bias insertions below. f, Left: Co-embedding UMAP colored by JUN motif variability (top) and JUN target gene score (bottom). Right: Violin plots of JUN motif variability (top) and JUN target gene score (bottom) in excitatory neuron clusters, split by diagnosis. Wilcoxon test (ns: p > 0.05, *: p <= 0.05, **: p <= 0.01, ***: p <= 0.001, ****: p <= 0.0001). g, Tn5 bias subtracted TF footprinting for EGR1 by snATAC-seq neuron cluster (top) and by AD diagnosis (bottom), as in e. h, Left: Co-embedding UMAP colored by EGR1 motif variability (top) and EGR1 target gene score (bottom). Right: Violin plots of EGR1 motif variability (top) and EGR1 target gene score (bottom) in excitatory neuron clusters, split by diagnosis, as in f. i, Violin plots of SREBF1 motif variability in oligodendrocyte snATAC-seq clusters, as in f. j, Violin plots of SREBF1 gene expression in oligodendrocyte snRNA-seq clusters, as in i. For boxplots, box boundaries and line correspond to the interquartile range (IQR) and median respectively. Whiskers extend to the lowest or highest data points that are no further than 1.5 times the IQR from the box boundaries.
Extended Data Figure 5:
Extended Data Figure 5:. Schematics of analyses.
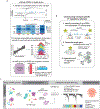
a, Schematic diagram linking cCREs to target genes and downstream analysis. First, we identify co-accessible chromatin peaks in each cell-type for control and late-stage AD. Second, we identify pairs of co-accessible peaks where one peak overlaps a gene promoter and correlate the expression of that gene with the chromatin accessibility of the other peak. Third, NMF is used to group gl-cCREs into functional modules. b, Schematic of construction of TF regulatory networks for each cell-type. c, Schematic representation of scWGCNA analysis, including iNMF integration with the Mathys et al. 2019 dataset, metacell aggregation, construction of co-expression networks, and downstream analysis of gene modules.
Extended Data Figure 6:
Extended Data Figure 6:. Pseudotime trajectory analysis to identify dysregulated TFs and gene expression in glia.
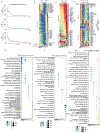
a, Line plot showing the RVAgene training loss at each epoch for oligodendrocyte (ODC), microglia (MG), and astrocyte (ASC) RVAE models. b-d, Heatmaps showing TF motif variability smoothed using loess regression and scaled to minimum and maximum values for TFs up- and down-regulated in AD as well as cell-type marker TFs along the oligodendrocyte trajectory (b), microglia trajectory (c), and astrocyte trajectory (d). TFs are ordered by trajectory rank (point in trajectory where of 75% maximum value is reached). e-g, Dot plot showing the enrichR combined score for the top enriched GO terms in oligodendrocyte (e), microglia (f), and astrocyte (g) t-DEGs.
Extended Data Figure 7:
Extended Data Figure 7:. Metacell aggregation and SREBP.
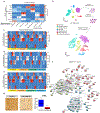
a, Heatmap showing the enrichment of cell-type marker genes in standard WGCNA modules constructed from our snRNA-seq data. b, Schematic showing generation of 30,218 metacells from the integrated transcriptomic dataset of 132,106 nuclei from our snRNA-seq and Mathys et al. c-e, Heatmap showing enrichment of oligodendrocyte (c), microglia (d), and astrocyte (e) scWGCNA modules constructed with 12 metacells, 25 metacells, 100 metacells, and 200 metacells in the scWGCNA modules constructed with 50 metacells, as shown in Fig. 7 and Supplementary Fig. 15-16. f, SREBP protein-protein interaction (PPI) network. Green circle denotes proteins involved in ribosome processing and transcription pathway, cyan circle for mTOR pathway, and red circle for lipid processing pathway. g, Left: Representative immunohistochemistry images from postmortem human brain tissue for SREBP with nuclear counterstain. Right: Quantification of SREBP staining. n = 4 pathological controls, 3 late-stage AD. Data is represented as the mean of four equally sized regions per sample. Scale bar represents 100 μm. Linear mixed-effects model ** p < 0.01. Box boundaries and line correspond to the interquartile range (IQR) and median respectively. Whiskers extend to the lowest or highest data points that are no further than 1.5 times the IQR from the box boundaries.
Extended Data Figure 8:
Extended Data Figure 8:. iNMF integration of snRNA-seq with Mathys et al. snRNA-seq.
a, Schematic representation of iNMF integration of snRNA-seq with Mathys et al. snRNA-seq. UMAP plots are colored by cell-type assignments. b, Dot plot of iNMF metagene expression in each cell-type, split by dataset of origin. c, UMAP plots of the integrated dataset colored by selected iNMF metagenes. d, Dot plots showing the iNMF loading for the top 30 genes for the same metagenes in c.
Extended Data Figure 9:
Extended Data Figure 9:. scWGCNA in microglia and astrocytes.
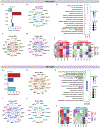
a, Signed correlation of astrocyte modules to AD diagnosis. b-d, Co-expression plots for modules AM1 (b), AM2 (c), and AM5 (d). e, GO term enrichment of astrocyte modules. f, Heatmaps showing row-normalized Seurat module scores of astrocyte modules in snRNA-seq (left) and snATAC-seq (right) astrocyte clusters. g, Signed correlation of microglia co-expression modules with AD diagnosis. h-j, Co-expression plots for modules MM1 (h), MM2 (i), and MM4 (j). k, GO term enrichment of microglia modules. l, Heatmaps showing row-normalized Seurat module scores of microglia modules in snRNA-seq (left) and snATAC-seq (right) microglia clusters.
Extended Data Figure 10:
Extended Data Figure 10:. scWGCNA in neurons.
a, Signed correlation of excitatory neuron modules to AD diagnosis. b-e, Co-expression plots for modules EM1 (b), EM2 (c), EM5 (d), and EM7 (e). f, GO term enrichment of excitatory neuron modules. g, Heatmaps showing row-normalized Seurat module scores of excitatory neuron modules in snRNA-seq (left) and snATAC-seq (right) excitatory neuron clusters. h, Signed correlation of inhibitory neuron modules to AD diagnosis. i-n, Co-expression plots for modules IM1 (i), IM2 (j), IM3 (k), IM4 (l), IM5 (m), and IM6 (n). o, GO term enrichment of inhibitory neuron modules. p, Heatmaps showing row-normalized Seurat module scores of inhibitory neuron modules in snRNA-seq (left) and snATAC-seq (right) inhibitory neuron clusters.
Figure 1:
Figure 1:. Single-nucleus ATAC-seq and single-nucleus RNA-seq to study cellular diversity in the diseased brain
a, Schematic representation of the samples used in this study, sequencing experiments, and downstream bioinformatic analyses, created with BioRender.com. b, c, UMAP visualizations where dots correspond to individual nuclei for 130,418 nuclei profiled with snATAC-seq (b) and 61,472 nuclei profiled with snRNA-seq (c), colored by Leiden cluster assignment and cell-type (ASC = astrocytes, EX = excitatory neurons, INH = inhibitory neurons, MG = microglia, ODC = oligodendrocytes, OPC = oligodendrocyte progenitor cells, PER/END = pericytes/endothelial cells). d, Pseudo-bulk chromatin accessibility profiles for each cell-type at canonical cell-type marker genes. For each gene, 1kb upstream and downstream are shown. Promoter/TSS highlighted in grey with gene model and chromosome position shown below. Chromosome coordinates are the following: GFAP chr17:44904008-44919937; SLC17A7 chr19:49428401-49445360; GAD2 chr10:26213307-26305558; CSF1R chr5:150052291-150116372; MBP chr18:76977827-77136683; PDGFRA chr4:54226097-54299247. e, Row-normalized single-nucleus gene expression heatmap of cell-type marker genes. f, UMAP plot of 186,167 nuclei from a jointly learned subspace of snATAC-seq and snRNA-seq, colored by cell-type assignment. g, Integrated UMAP as in f, colored by originating dataset. Smaller gray dots represent nuclei from the other data modality. A consistent coloring scheme for each cell-type and cluster is used throughout the manuscript.
Figure 2:
Figure 2:. Epigenetically and transcriptionally distinct cell subpopulations in human AD prefrontal cortex
a,b, Hierarchically clustered heatmaps of row-normalized gene expression in snRNA-seq OPC and oligodendrocyte clusters (a) and gene activity in snATAC-seq OPC and oligodendrocyte clusters (b) for the top 25 upregulated DEGs (sorted by average log fold change) identified in each oligodendrocyte subpopulation. c, Pseudo-bulk chromatin accessibility coverage profiles for OPC (progenitor), intermediate oligodendrocyte and mature oligodendrocyte snATAC-seq clusters, assignments as in b. Promoter/TSS highlighted in grey with gene model and chromosome position shown below. Chromosome coordinates are the following: VCAN chr5: 83468465-83583303; ITPR2 chr12: 26335515-26836198; CD74 chr5: 150400637-150415929; APOLD1 chr12: 12722917-12830975; OPALIN chr10: 96342216-96362365; CNP chr17: 41963741-41978731; MOG chr6: 29653981-29673372. d,e, snATAC-seq (d) and snRNA-seq (e) UMAPs as in Fig. 1, where nuclei are colored by AD diagnosis. Clusters annotated by cell type. f,g, Box and whisker plots showing the proportion of nuclei mapping to each cluster for each sample, split by control and late-stage AD samples for snATAC-seq (i) and snRNA-seq (j) clusters, with measures of significance from bootstrapped cluster composition analysis (Wilcoxon test, see Methods, *** FDR <= 0.001, ** FDR <= 0.01, * 0.01 < FDR <= 0.05) and n as in Supplementary Tables 7-9. For box and whisker plots, box boundaries and line correspond to the interquartile range (IQR) and median respectively. Whiskers extend to the lowest or highest data points that are no further than 1.5 times the IQR from the box boundaries.
Figure 3:
Figure 3:. Linking cis-regulatory elements to downstream target genes in specific cell-types
a, Histogram showing the number of genes that have 1 through 25 linked cCREs. b, Upset plot showing the size of overlaps between the sets of cCRE-linked genes identified in each cell-type. The barplot on the left shows the set size of cCRE-linked genes for each cell-type, and the barplot on the top shows the number of overlapping genes between two sets, or the number of unique genes in one set. c, Venn diagrams for each major cell-type showing the overlaps between the set of cCRE-linked genes and genes upregulated in that cell-type (celltype DEGs) and genes upregulated in AD within this cell-type (diagnosis DEGs). A one-sided Fisher’s exact test was used for gene set overlap significance (*** p <= 0.001, ** p <= 0.01, * p < 0.05). d, Heatmap showing row-normalized pseudo-bulk chromatin accessibility in each snATAC-seq cluster split by nuclei from control and late-stage AD samples. Rows (cCREs) are organized based on NMF module assignment. Annotations correspond to genes from DGE analysis that are upregulated in AD in at least one cell-type. e, Donut chart showing the percentage of gl-cCREs that map to intronic, exonic, or distal regions. f, Heatmap showing NMF coefficients in each snATAC-seq cluster split by nuclei from control and late-stage AD samples. g, Heatmap showing log transformed enrichR combined scores for GO terms for gene sets of selected NMF modules.
Figure 4:
Figure 4:. Cell subpopulation-specific transcription factor regulation in late-stage AD
a, Left: snATAC-seq and snRNA-seq integrated UMAP colored by SPI1 motif variability with microglia circled. Right: Violin plots of SPI1 motif variability in significant snATAC-seq microglia clusters, split by diagnosis. b, Left: Integrated UMAP colored by SPI1 target gene score with microglia circled. Right: Violin plots of SPI1 target gene score in significant snRNA-seq microglia clusters, split by diagnosis as in a. c, Tn5 bias subtracted TF footprinting for SPI1 by snATAC-seq microglia cluster (top) and by AD diagnosis (bottom). TF binding motif shown as motif logo above. d, Left: Integrated UMAP colored by NRF1 motif variability with oligodendrocytes circled. Right: Violin plots of NRF1 motif variability in significant snATAC-seq oligodendrocyte clusters, split by diagnosis as in a. e, Left: Integrated UMAP colored by NRF1 target gene score with oligodendrocyte circled. Right: Violin plots of NRF1 target gene score in significant snRNA-seq oligodendrocyte clusters, split by diagnosis as in a. f, Tn5 bias subtracted TF footprinting for NRF1 by snATAC-seq oligodendrocyte cluster (top) and by AD diagnosis (bottom) as in b. g, h, TF regulatory networks showing the predicted candidate target genes for the following TFs: ELF5, ETS1, ETV5, SPIC, and SPI1 in microglia (g); SOX9, SOX13, SREBF1, SREBF2, OLIG1, and NRF1 in oligodendrocytes (h). For violin plots, two-sided Wilcoxon test was used to compare control versus AD, ns: p > 0.05, *: p <= 0.05, **: p <=0.01, ***: p <= 0.001, ****: p <= 0.0001.
Figure 5:
Figure 5:. Multi-omic oligodendrocyte trajectory analysis
a, UMAP dimensionality reduction of oligodendrocytes from the integrated snATAC-seq (n=58,221 nuclei) and snRNA-seq (n=36,773 nuclei) analysis. Each cell is colored by its pseudotime trajectory assignment. b, Scatter plot showing the proportion of oligodendrocyte nuclei from AD samples at 50 evenly sized bins across the trajectory. The black line shows a linear regression, and the gray outline represents the 95% confidence interval. Pearson correlation coefficient and p-value from two-sided test are shown. c, Scatter plot of module scores for newly formed oligodendrocyte (NF-ODC), myelin forming oligodendrocyte (MF-ODC) and mature oligodendrocyte gene signatures, (see Supplementary Note for full gene lists) averaged for nuclei in each of the 50 trajectory bins. Solid colored lines represent loess regressions for each signature, and the gray outlines represent 95% confidence intervals. d, Left: heatmap of chromatin accessibility at 9,231 oligodendrocyte gl-cCREs reconstructed using RVAE. Right: heatmap of gene expression for 1,563 oligodendrocyte trajectory DEGs (t-DEGs) reconstructed using RVAE. Annotated genes are DEGs in oligodendrocytes, in respect to other cell-types, or AD upregulated genes in oligodendrocytes. e, 2D latent space learned by RVAE modeling of oligodendrocyte t-DEGs (left) and gl-cCREs (right), where each dot represents one gene. Left: genes colored by trajectory rank, the point in the trajectory where the gene reaches 75% of max expression. Right: genes colored by correlation of RVAE reconstructed expression with AD diagnosis proportion as in b. f, Oligodendrocyte t-DEG latent space colored by correlation of reconstructed gene expression to NRF1 (left) and SREBF1 (right) motif variability. The shape of each point represents the regulatory relationship between the TF and each gene, while genes without regulatory evidence are shown as small gray dots. Annotated genes are AD upregulated genes in oligodendrocytes (AD DEGs). TF binding motifs are shown as motif logos.
Figure 6:
Figure 6:. Multi-omic microglia and astrocyte trajectory analyses
a, UMAP dimensionality reduction of microglia from the integrated snATAC-seq (n=10,768 nuclei) and snRNA-seq (n=4,119 nuclei) analysis. b, Scatter plot of the proportion of AD microglia nuclei as in Fig. 5b. c, Scatter plot of module scores as in Fig. 5c for gene signatures from Keren-Shaul et al: homeostatic microglia, Stage 1 disease-associated microglia (DAM), and Stage 2 DAM (see Supplementary Note for full gene lists). d, Heatmaps of RVAE reconstructed chromatin accessibility and gene expression as in Fig. 5d, for 9,163 microglia gl-cCREs (left) and 2,138 microglia t-DEGs (right). e, 2D latent space learned by RVAE modeling of microglia t-DEGs (left) and gl-cCREs (right), as in Fig. 5e. f, Microglia t-DEG latent space colored by correlation of gene expression to SPI1 (left) and ETV5 (right) motif variability, as in Fig. 5f. g, UMAP dimensionality reduction of astrocytes from the integrated snATAC-seq (n=12,112 nuclei) and snRNA-seq (n=4,704 nuclei) analysis. h, Scatter plot of the proportion of AD astrocyte nuclei as in b. i, Scatter plot of module scores as in c for gene signatures from Habib et al. 2020: GFAP-low, GFAP-high, and Disease Associated Astrocytes (DAA, see Supplementary Note for full gene lists). j, Heatmaps of RVAE reconstructed chromatin accessibility and gene expression as in d for 12,487 astrocyte gl-cCREs (left) and 1,797 astrocyte t-DEGs (right). k, 2D latent space learned by RVAE modeling of astrocyte t-DEGs (left) and gl-cCREs (right), as in e. l, Astrocyte t-DEG latent space colored by correlation of gene expression to CTCF (left) and ETV5 (right) motif variability, as in f.
Figure 7:
Figure 7:. Cell-type specific regulatory landscapes of GWAS loci in the AD brain
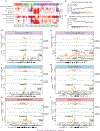
a, Heatmap showing LDSC enrichment of GWAS traits and disorders in snATAC-seq clusters. P-values are derived from LDSC enrichment tests, and FDR corrected p-values are overlaid on the heatmap (*: FDR < 0.05, **: FDR < 0.005, ***: FDR < 0.0005). b, c, Scatter plots showing gchromVAR enrichments along the microglia pseudotime trajectory in distal peaks (b) and gene-proximal peaks (c) averaged for nuclei in each of the 50 trajectory bins. The black line shows a linear regression, and the gray outline represents the 95% confidence interval. Pearson correlation coefficient and p-value are shown. d-i, Cis-regulatory architecture at the following GWAS loci and cell-types: BIN1 (d) and ADAM10 (e) in oligodendrocytes; BIN1 (f) and APOE (g) in microglia; SLC24A4 (h) and APOE (i) in astrocytes. Co-accessible links for late-stage AD and control are shown separately, with the line height and opacity corresponding to the co-accessibility score; links with a score below the gray dotted line are removed for visualization purposes. Genomic coverage plots for AD and control are shown separately. Jansen et al. AD GWAS statistics for SNPs at each locus are shown. Lead SNPs are shown as diamonds, and SNPs in 99% credible set are shown as triangles. Chromosome ideogram indicates genomic coordinates in a 500 kilobase radius centered at each GWAS gene. Chromosome coordinates are the following: BIN1 chr2:127047027-127110355; ADAM10 chr15:58587807-58752978; APOE chr19:44902754-44910393; SLC24A4 chr14:92319581-92502483.
Figure 8:
Figure 8:. Robust co-expression modules revealed using integrated bulk and single cell co-expression network analysis
a, Co-expression plots for modules OM1, OM2, OM4, and OM5. b, Signed correlation oligodendrocyte co-expression modules with AD diagnosis. c, Enrichment of SREBF1 target genes in oligodendrocyte co-expression modules. d, Boxplots showing RNA (top) and protein expression (bottom; n = 98 controls, 76 early-pathology, 101 late-pathology) of SREBF1’s targets with AD pathological staging. Two-sided Wilcoxon test. e, Boxplots showing quantification of SREBF1 puncta per MOG+ oligodendrocyte. n = 3 cognitively healthy controls, 5 late-stage AD. Data is represented as the mean of four equally sized regions per sample. Linear mixed-effects model. f, Boxplots showing quantification of ACSL4 puncta per MOG+ oligodendrocyte. n = 4 cognitively healthy controls, 4 late-stage AD. Data is represented as the mean of four equally sized regions per sample. Linear mixed-effects model. g, Representative RNA fluorescence in situ hybridization (RNAscope) images from postmortem human brain tissue for combined SREBF1 and MOG staining as in e (left) and ACSL4 and MOG staining as in f (right) with DAPI nuclear counterstain. For box and whisker plots, box boundaries and line correspond to the interquartile range (IQR) and median respectively. Whiskers extend to the lowest or highest data points that are no further than 1.5 times the IQR from the box boundaries.

Similar articles

Cited by

References

    1. Lake BB et al. Neuronal subtypes and diversity revealed by single-nucleus RNA sequencing of the human brain. Science (80-.). 352, 1586–1590 (2016). - PMC - PubMed
    1. Tasic B et al. Adult mouse cortical cell taxonomy revealed by single cell transcriptomics. Nat. Neurosci 19, 335–346 (2016). - PMC - PubMed
    1. Zeisel A et al. Molecular Architecture of the Mouse Nervous System. Cell 174, 999–1014.e22 (2018). - PMC - PubMed
    1. Hodge RD et al. Conserved cell types with divergent features in human versus mouse cortex. Nature 573, 61–68 (2019). - PMC - PubMed
    1. Mathys H et al. Single-cell transcriptomic analysis of Alzheimer’s disease. Nature 570, 332–337 (2019). - PMC - PubMed

Methods only references

    1. Sun Y, Ip P & Chakrabartty A Simple elimination of background fluorescence in formalin-fixed human brain tissue for immunofluorescence microscopy. J. Vis. Exp 2017, 1–6 (2017). - PMC - PubMed
    1. Stuart T, Srivastava A, Lareau C & Satija R Multimodal single-cell chromatin analysis with Signac. bioRxiv 2020.11.09.373613 (2020).
    1. Granja JM et al. ArchR is a scalable software package for integrative single-cell chromatin accessibility analysis. Nat. Genet 53, 403–411 (2021). - PMC - PubMed
    1. Gu Z, Eils R & Schlesner M Complex heatmaps reveal patterns and correlations in multidimensional genomic data. Bioinformatics 32, 2847–2849 (2016). - PubMed
    1. Khan A et al. JASPAR 2018: Update of the open-access database of transcription factor binding profiles and its web framework. Nucleic Acids Res. 46, D260–D266 (2018). - PMC - PubMed

Publication types

MeSH terms