. 2021 Aug;27(8):1432-1441.
doi: 10.1038/s41591-021-01406-6. Epub 2021 Jul 8.

Gut microbiota signatures are associated with toxicity to combined CTLA-4 and PD-1 blockade

Miles C Andrews #  1   2   3 Connie P M Duong #  4   5   6 Vancheswaran Gopalakrishnan #  1 Valerio Iebba #  4   5 Wei-Shen Chen #  7   8 Lisa Derosa #  4   5   6 Md Abdul Wadud Khan  1 Alexandria P Cogdill  4   5   6   7 Michael G White  1 Matthew C Wong  7 Gladys Ferrere  4   5   6 Aurélie Fluckiger  4   5   6 Maria P Roberti  4   5   6 Paule Opolon  4 Maryam Tidjani Alou  4   5   6 Satoru Yonekura  4   5   6 Whijae Roh  7 Christine N Spencer  9 Irina Fernandez Curbelo  10 Luis Vence  10 Alexandre Reuben  11 Sarah Johnson  1 Reetakshi Arora  1 Golnaz Morad  1 Matthew Lastrapes  12 Erez N Baruch  7 Latasha Little  7 Curtis Gumbs  7 Zachary A Cooper  13 Peter A Prieto  14 Khalida Wani  15 Alexander J Lazar  7   15 Michael T Tetzlaff  15 Courtney W Hudgens  15 Margaret K Callahan  9   16 Matthew Adamow  16   17 Michael A Postow  16   17 Charlotte E Ariyan  18 Pierre-Olivier Gaudreau  1 Luigi Nezi  19 Didier Raoult  20 Catalin Mihalcioiu  21 Arielle Elkrief  22 Rossanna C Pezo  23 Lauren E Haydu  1 Julie M Simon  1 Hussein A Tawbi  24 Jennifer McQuade  24 Patrick Hwu  24 Wen-Jen Hwu  24 Rodabe N Amaria  24 Elizabeth M Burton  1 Scott E Woodman  7   24 Stephanie Watowich  10 Adi Diab  24 Sapna P Patel  24 Isabella C Glitza  24 Michael K Wong  24 Li Zhao  7 Jianhua Zhang  7 Nadim J Ajami  7 Joseph Petrosino  25 Robert R Jenq  7 Michael A Davies  24 Jeffrey E Gershenwald  1 P Andrew Futreal  7 Padmanee Sharma  10 James P Allison  10 Bertrand Routy  4   5   6 Laurence Zitvogel  26   27   28 Jennifer A Wargo  29   30
Affiliations

Gut microbiota signatures are associated with toxicity to combined CTLA-4 and PD-1 blockade

Miles C Andrews et al. Nat Med. 2021 Aug.

Abstract

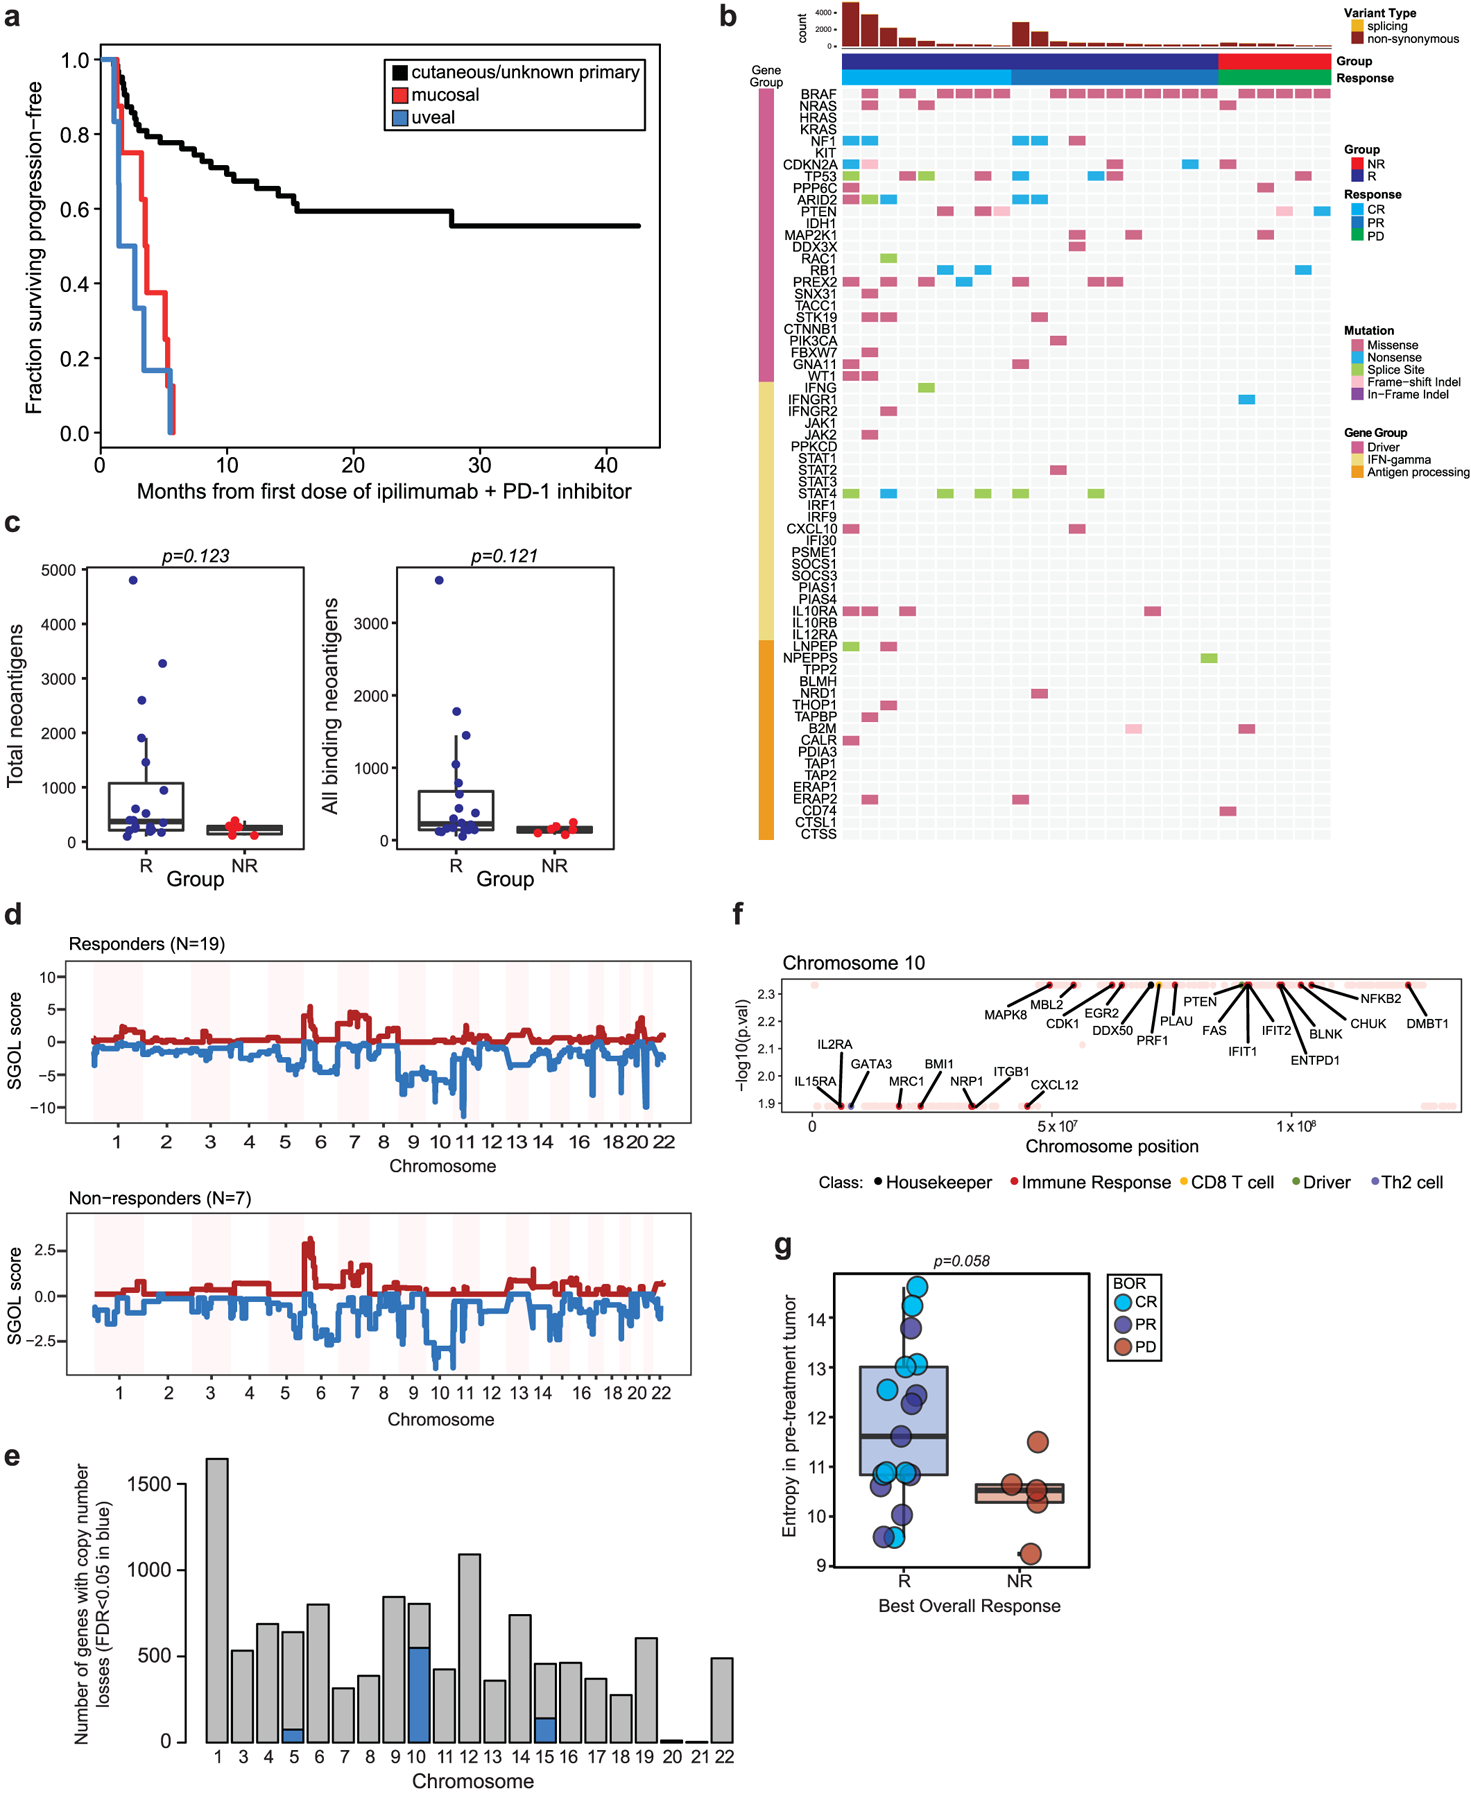
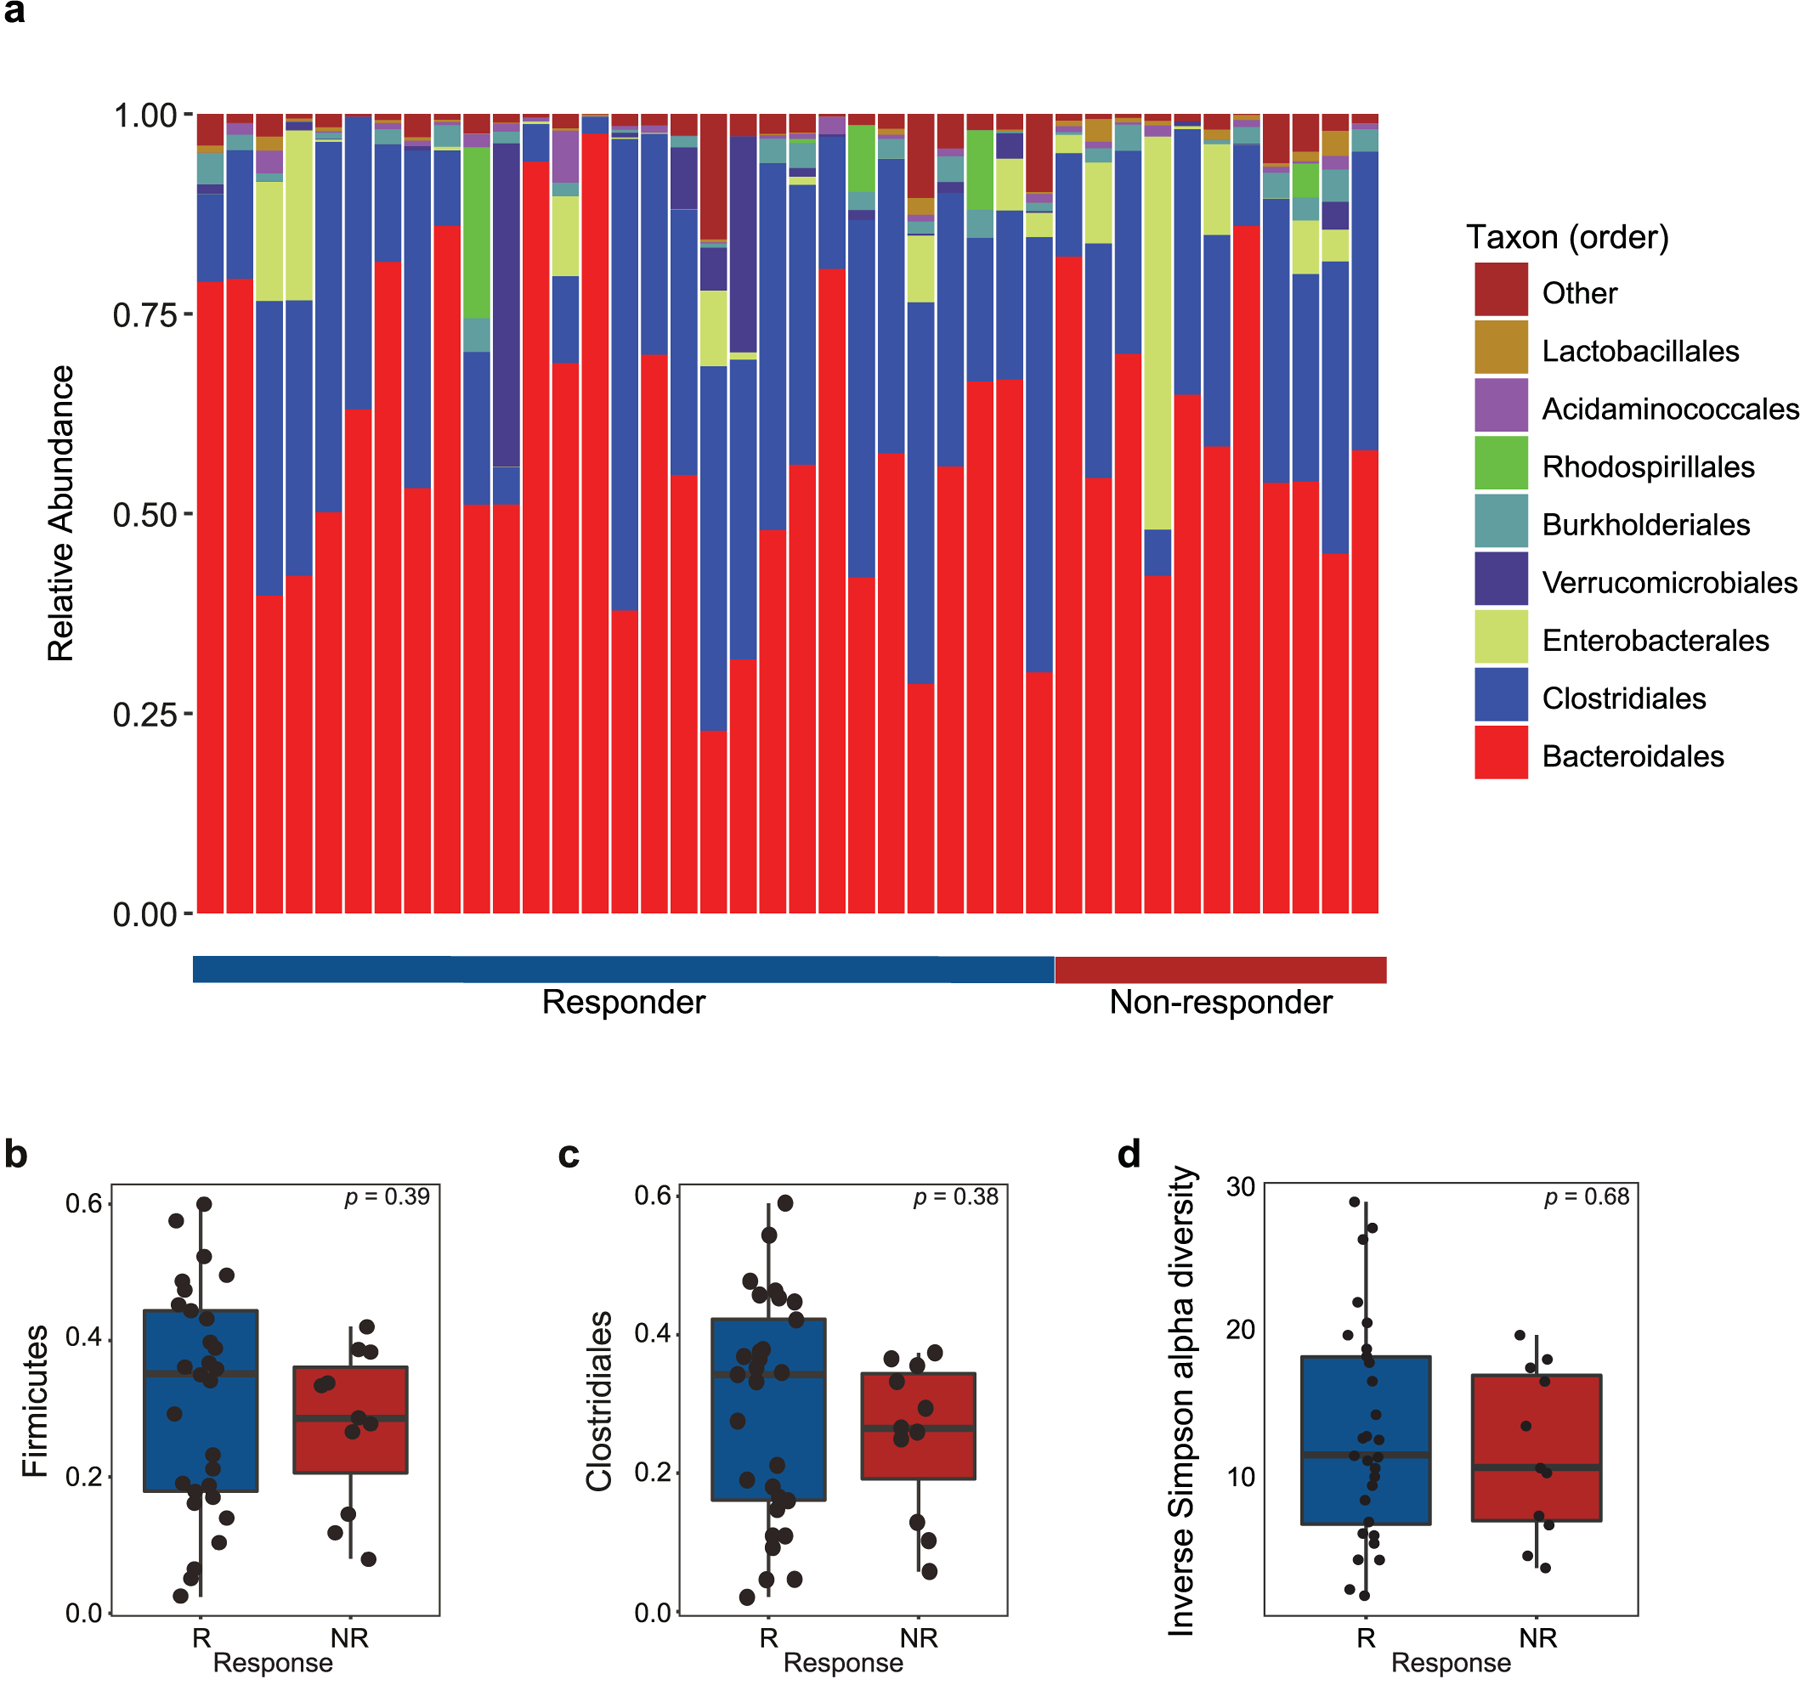
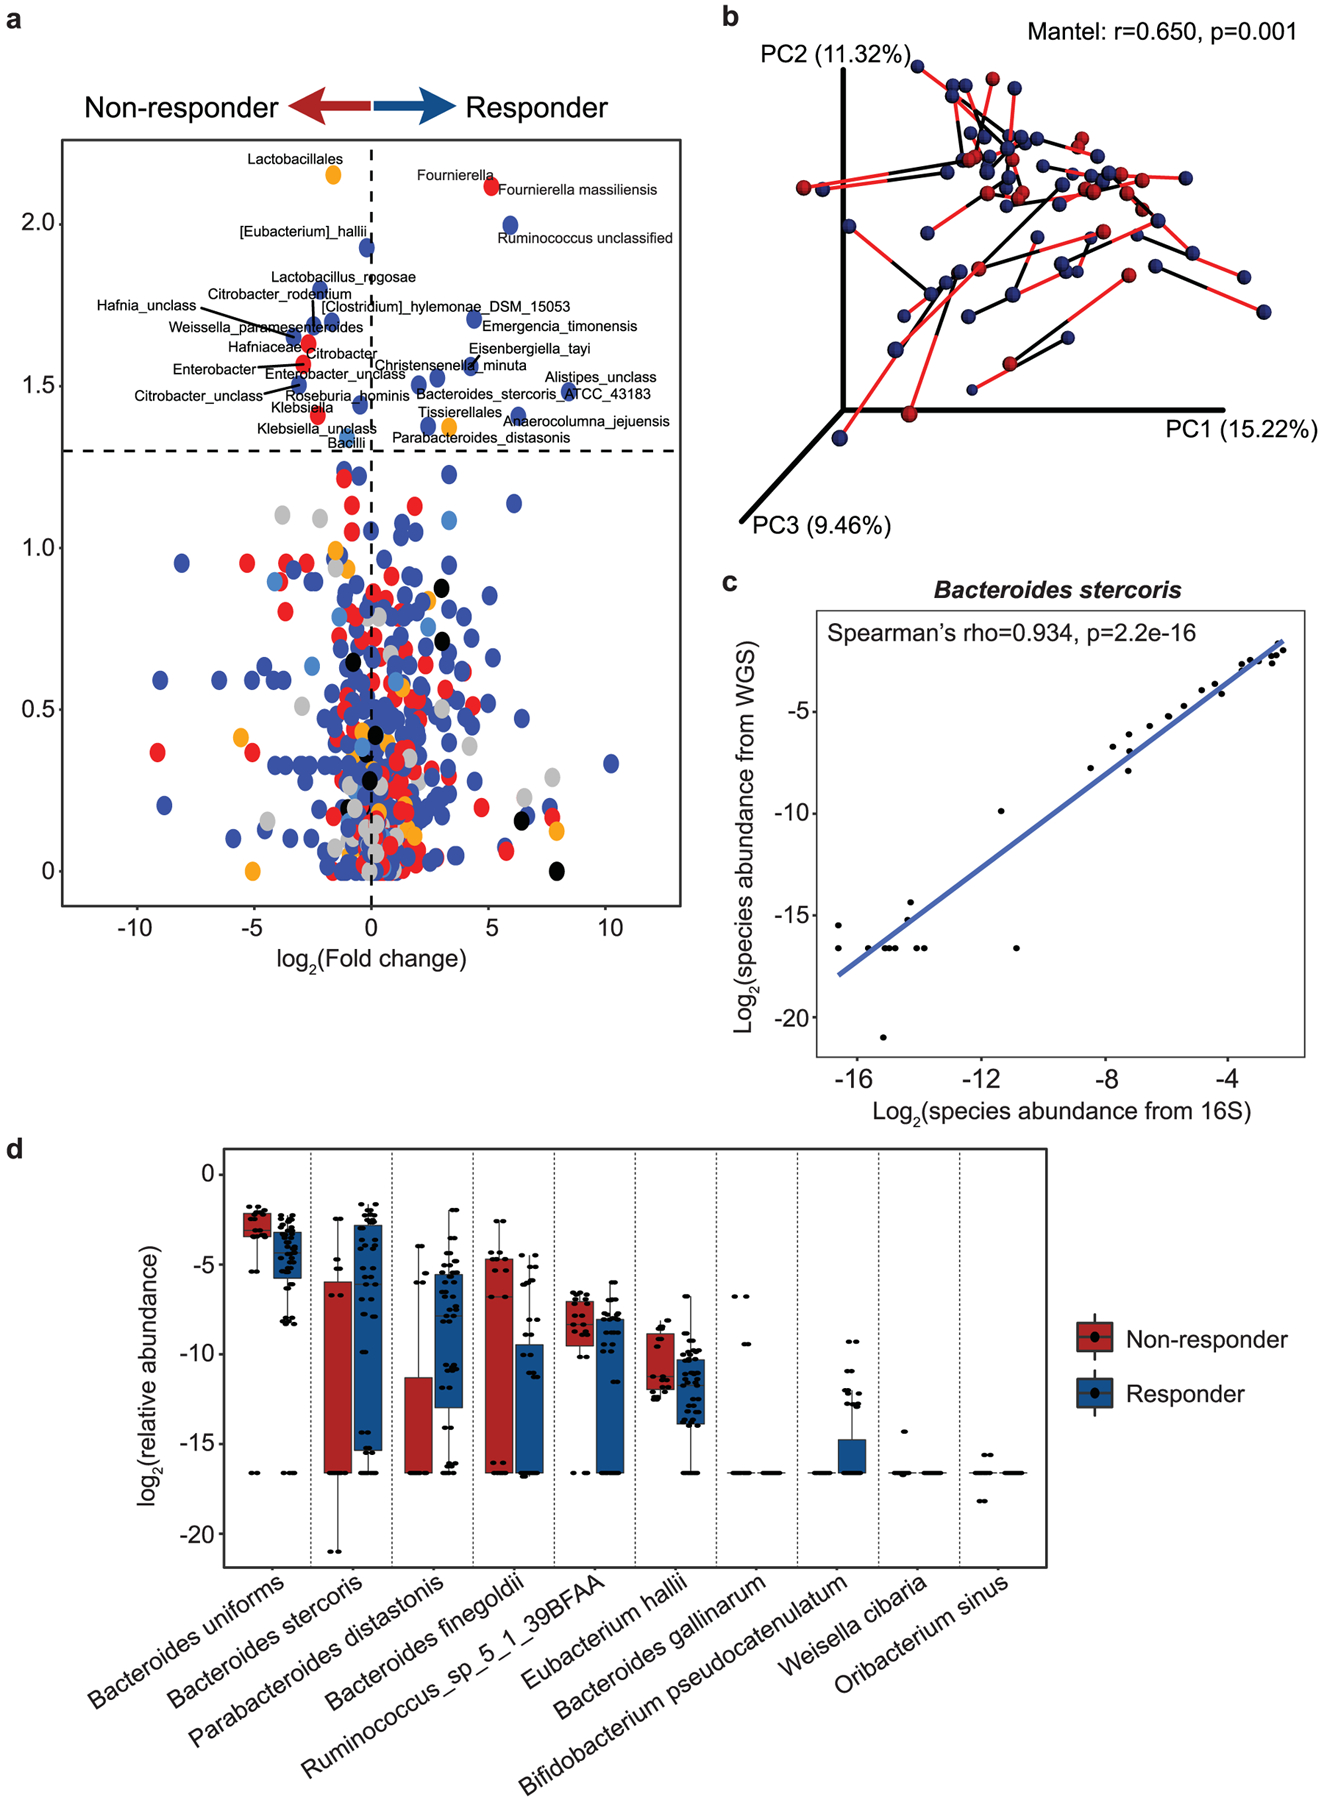
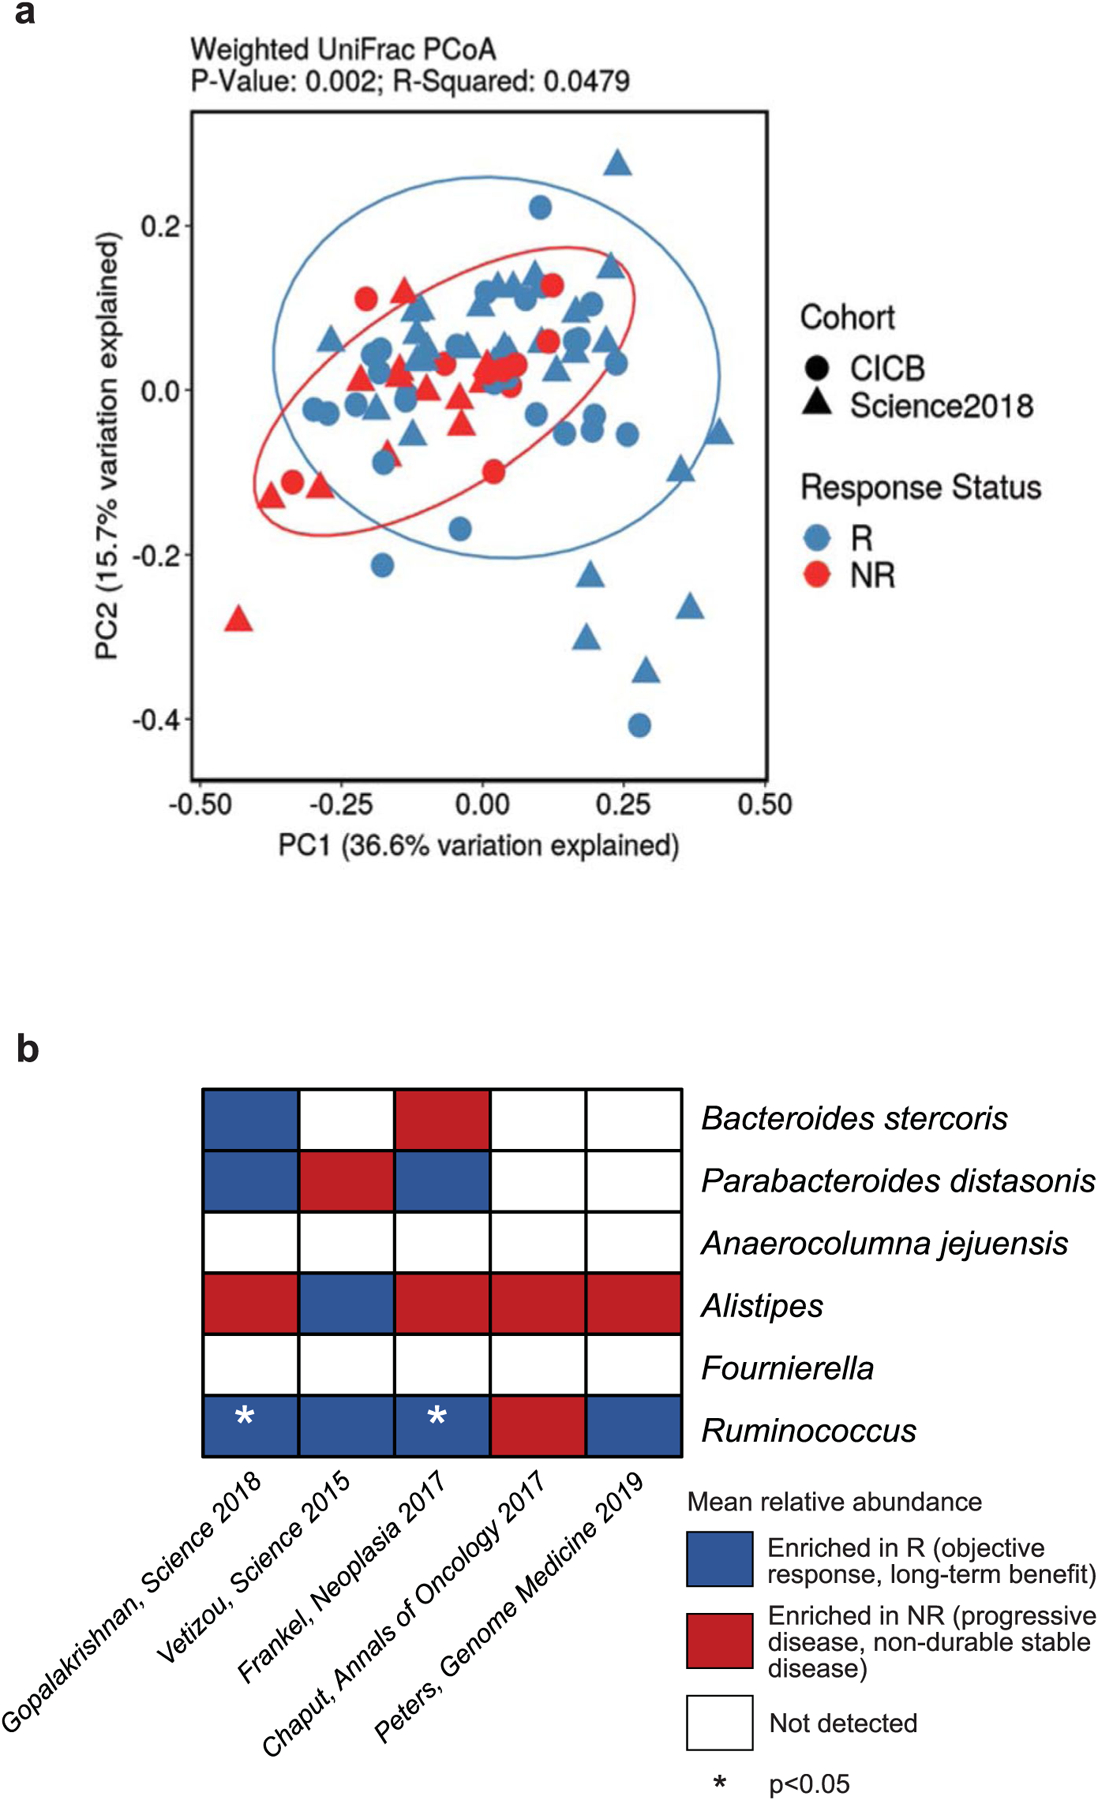
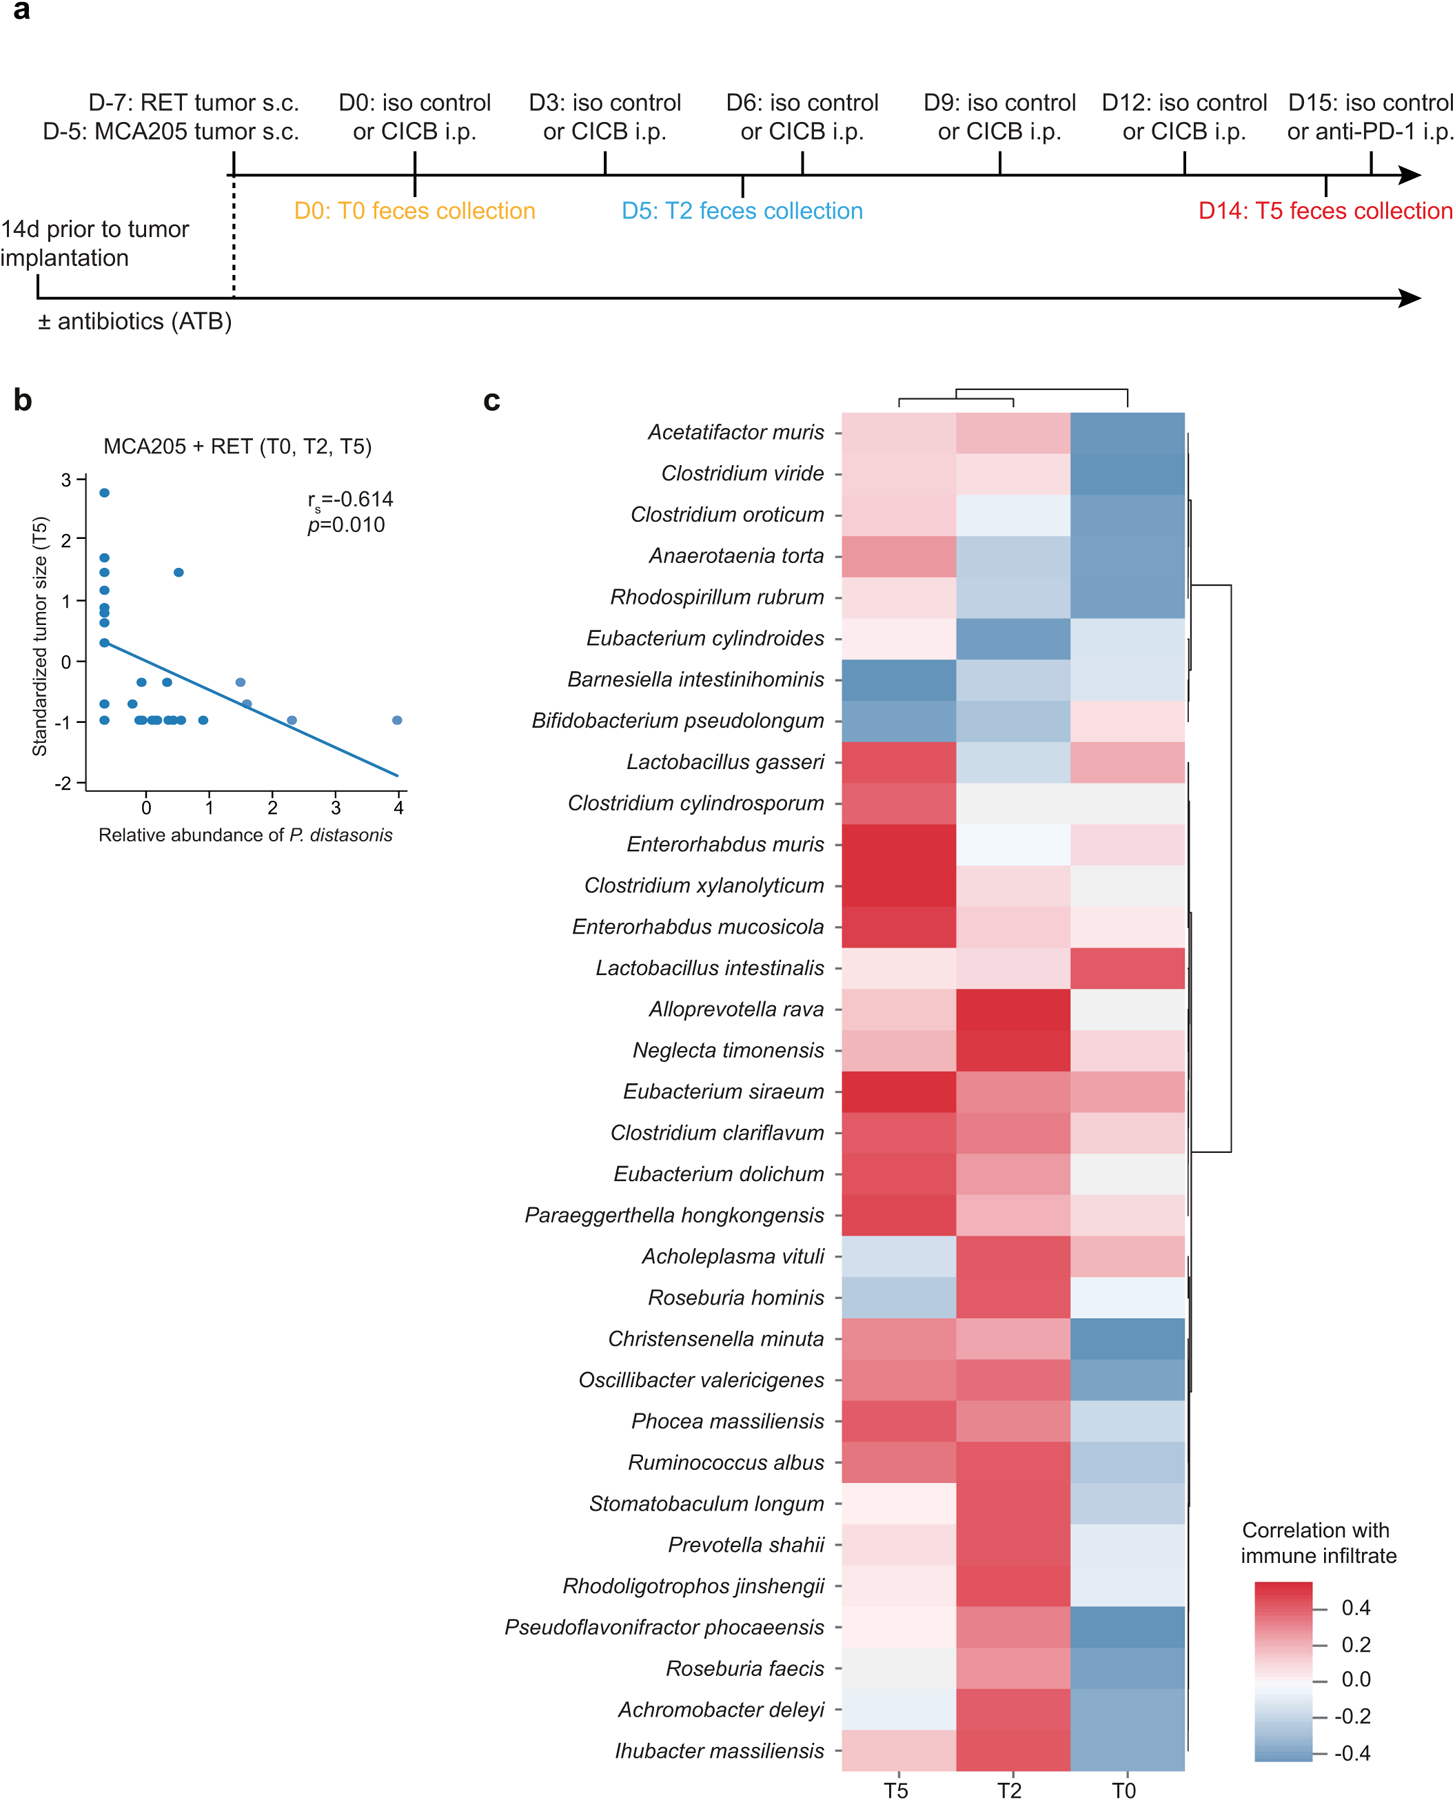
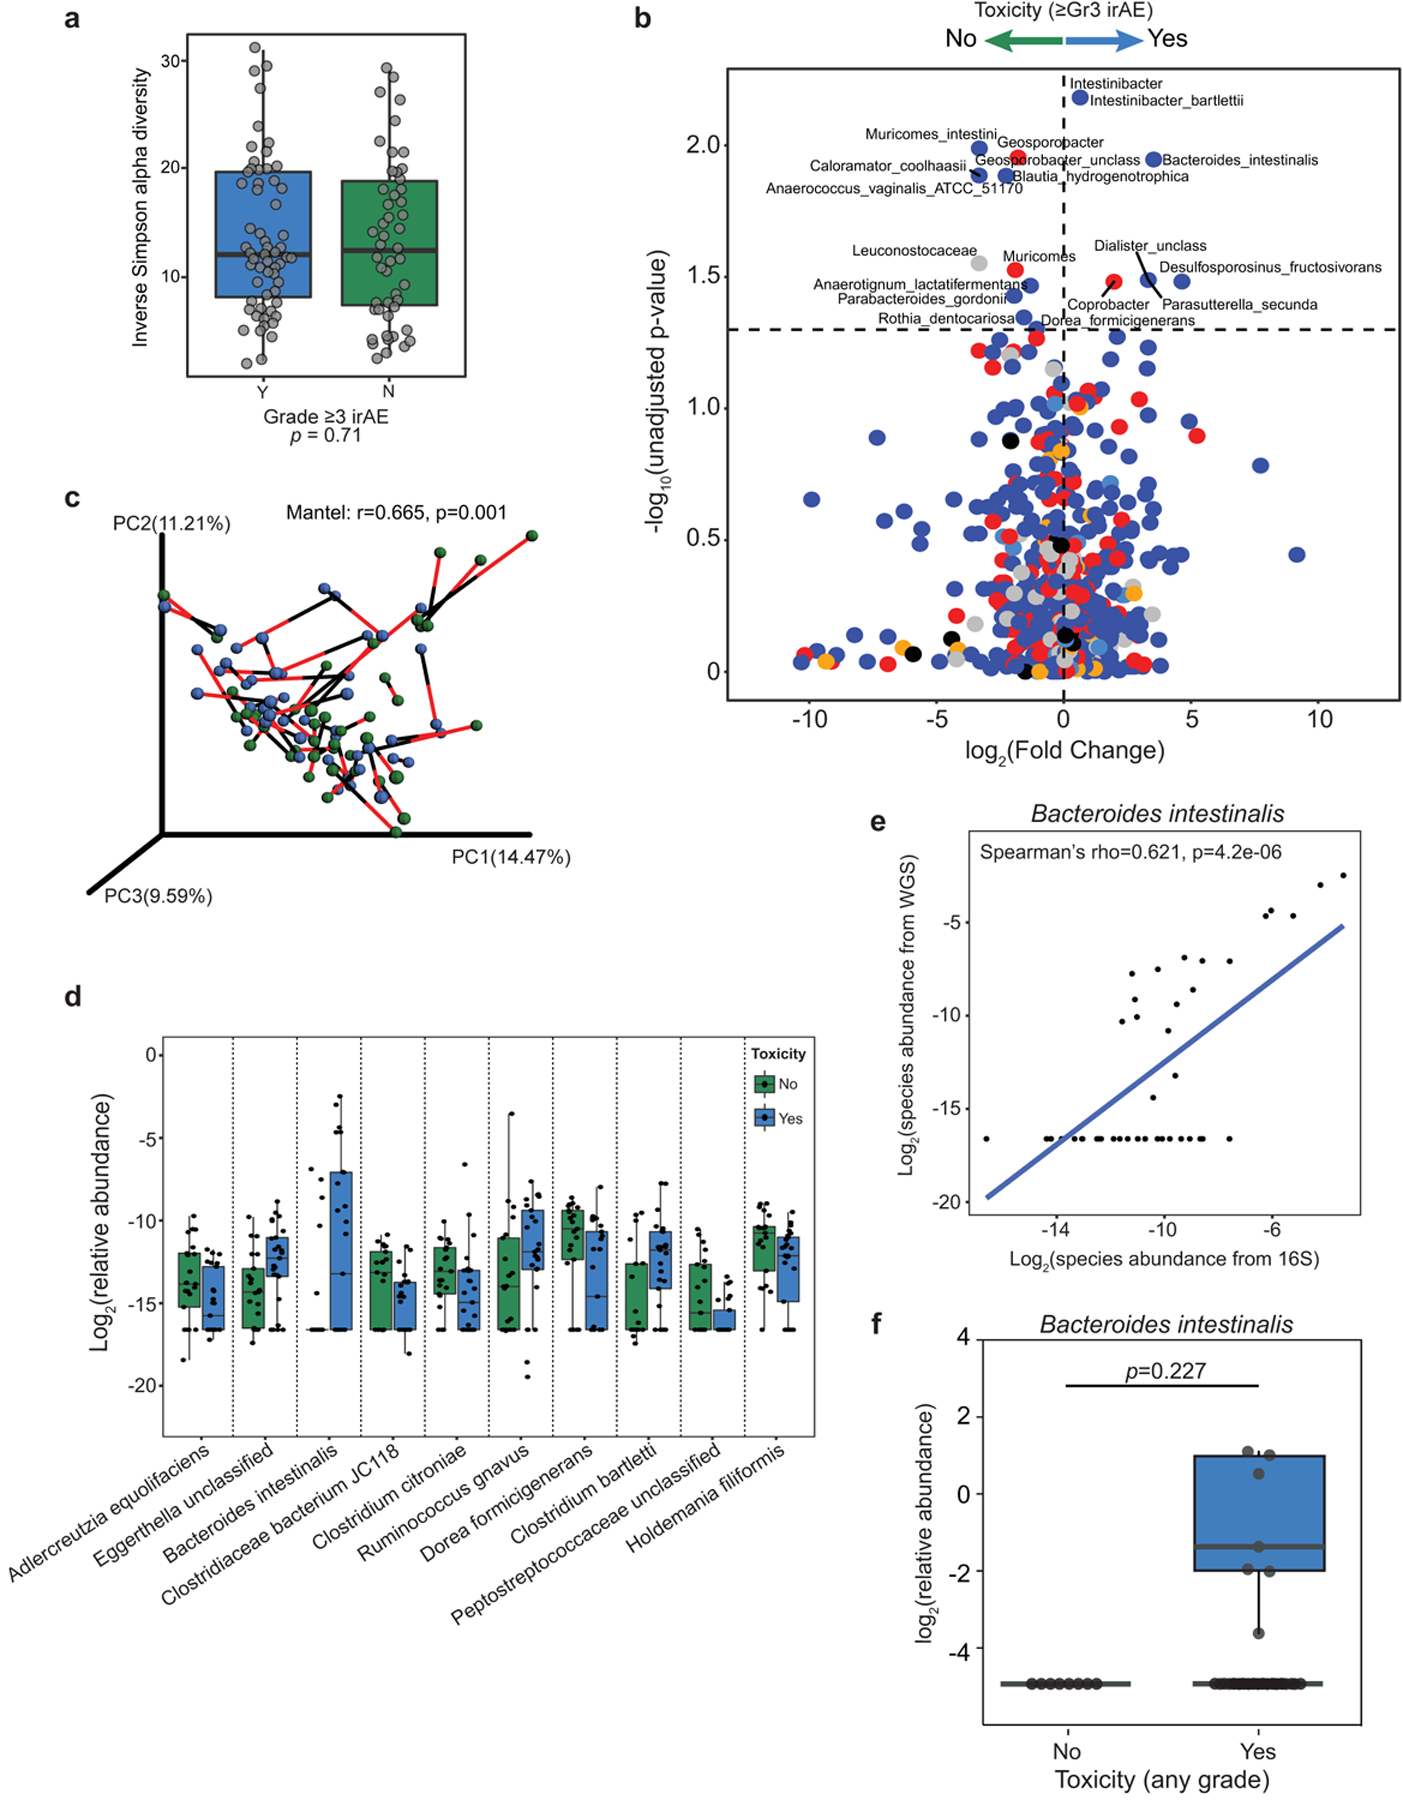
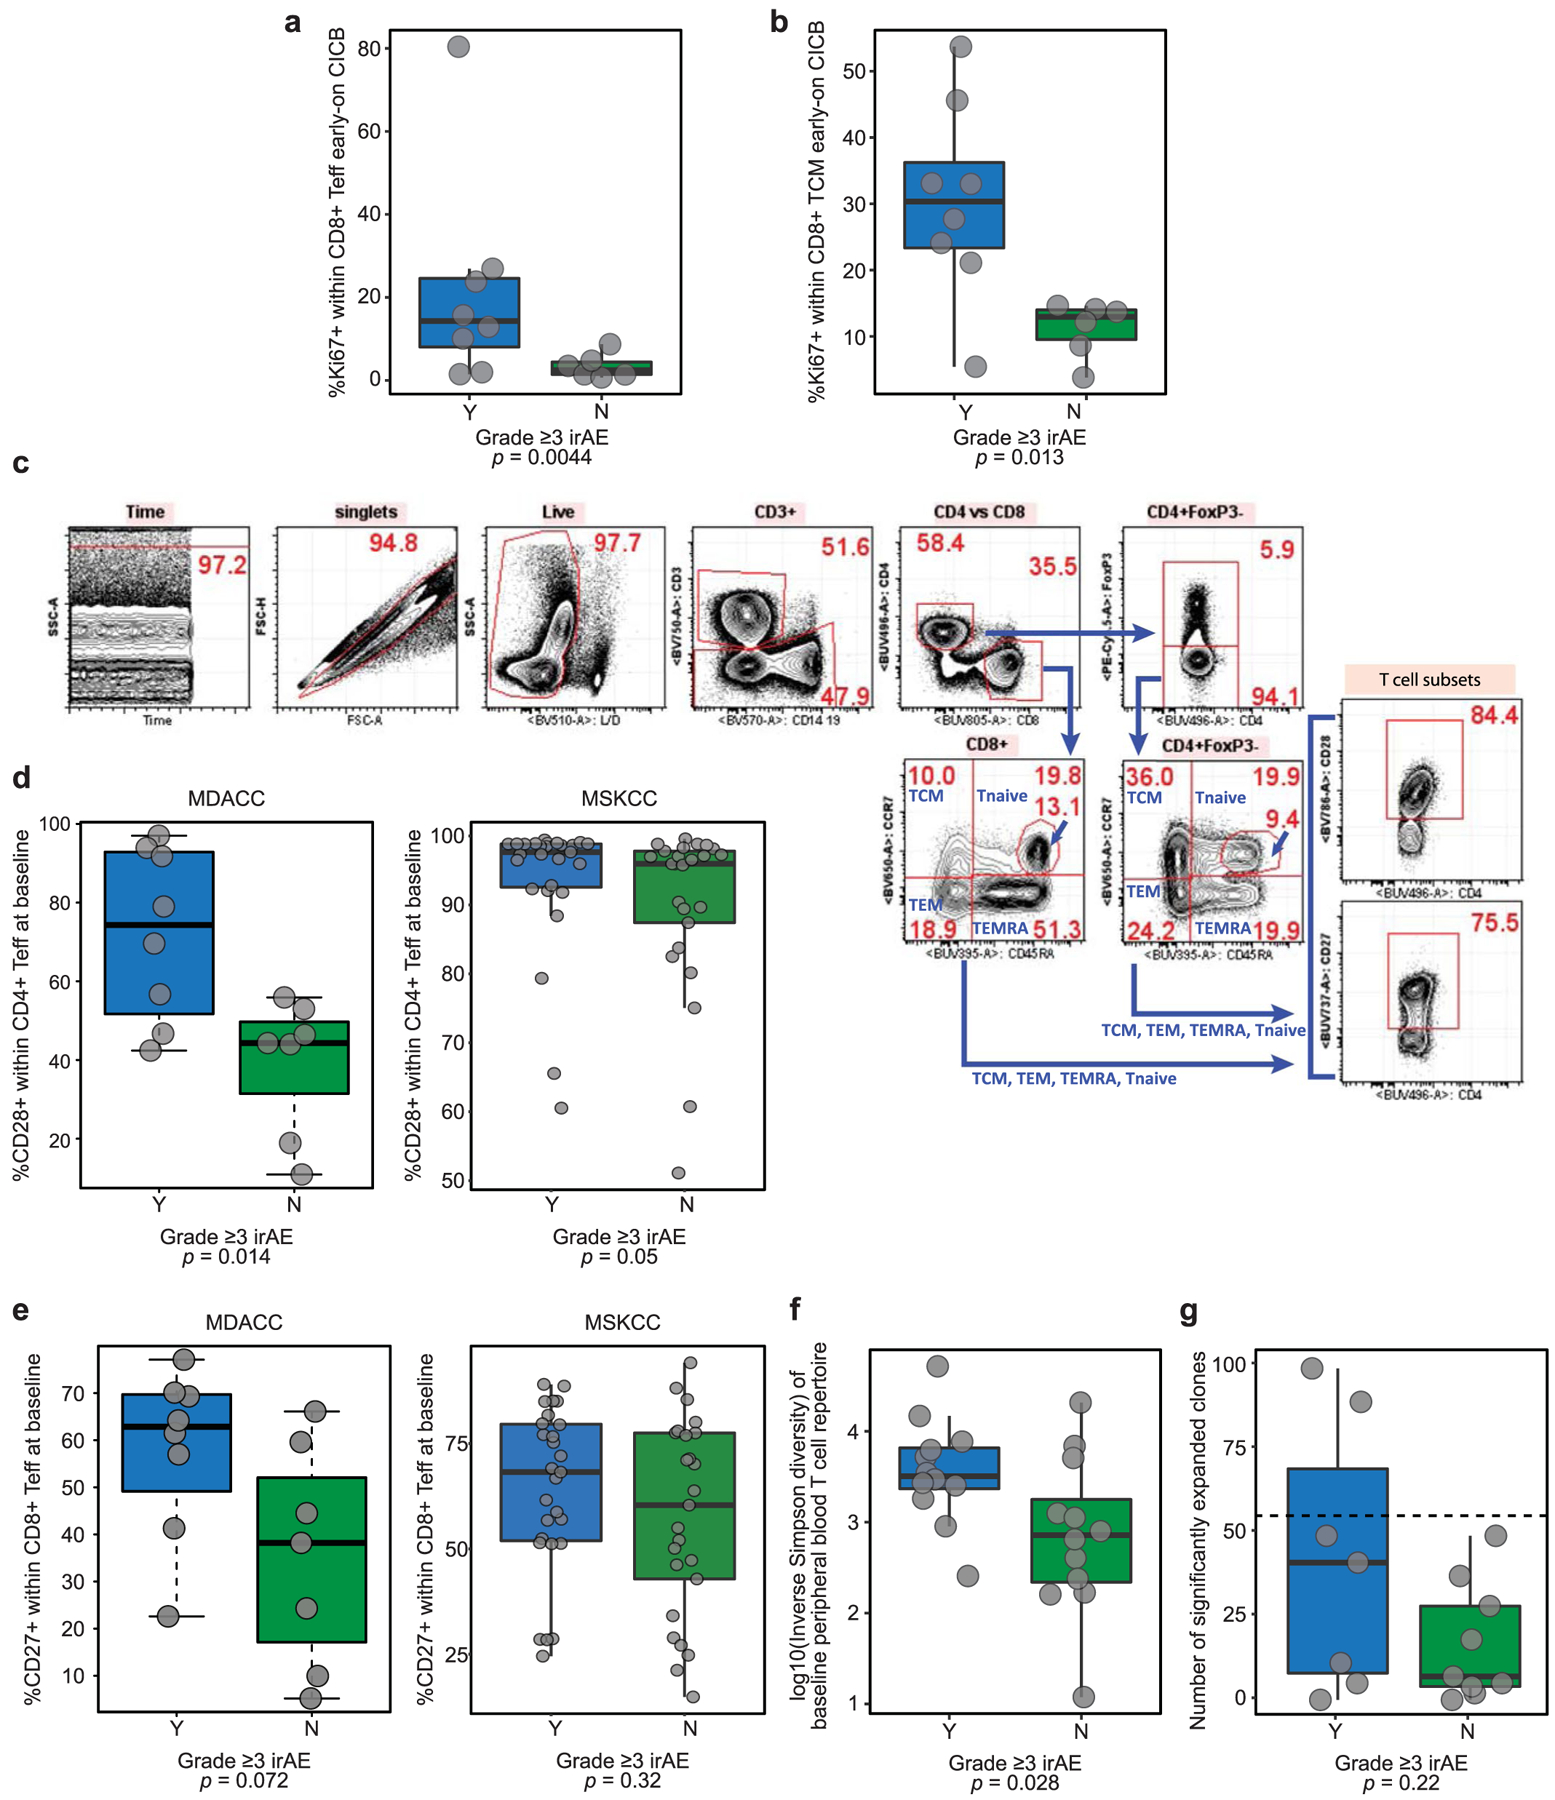
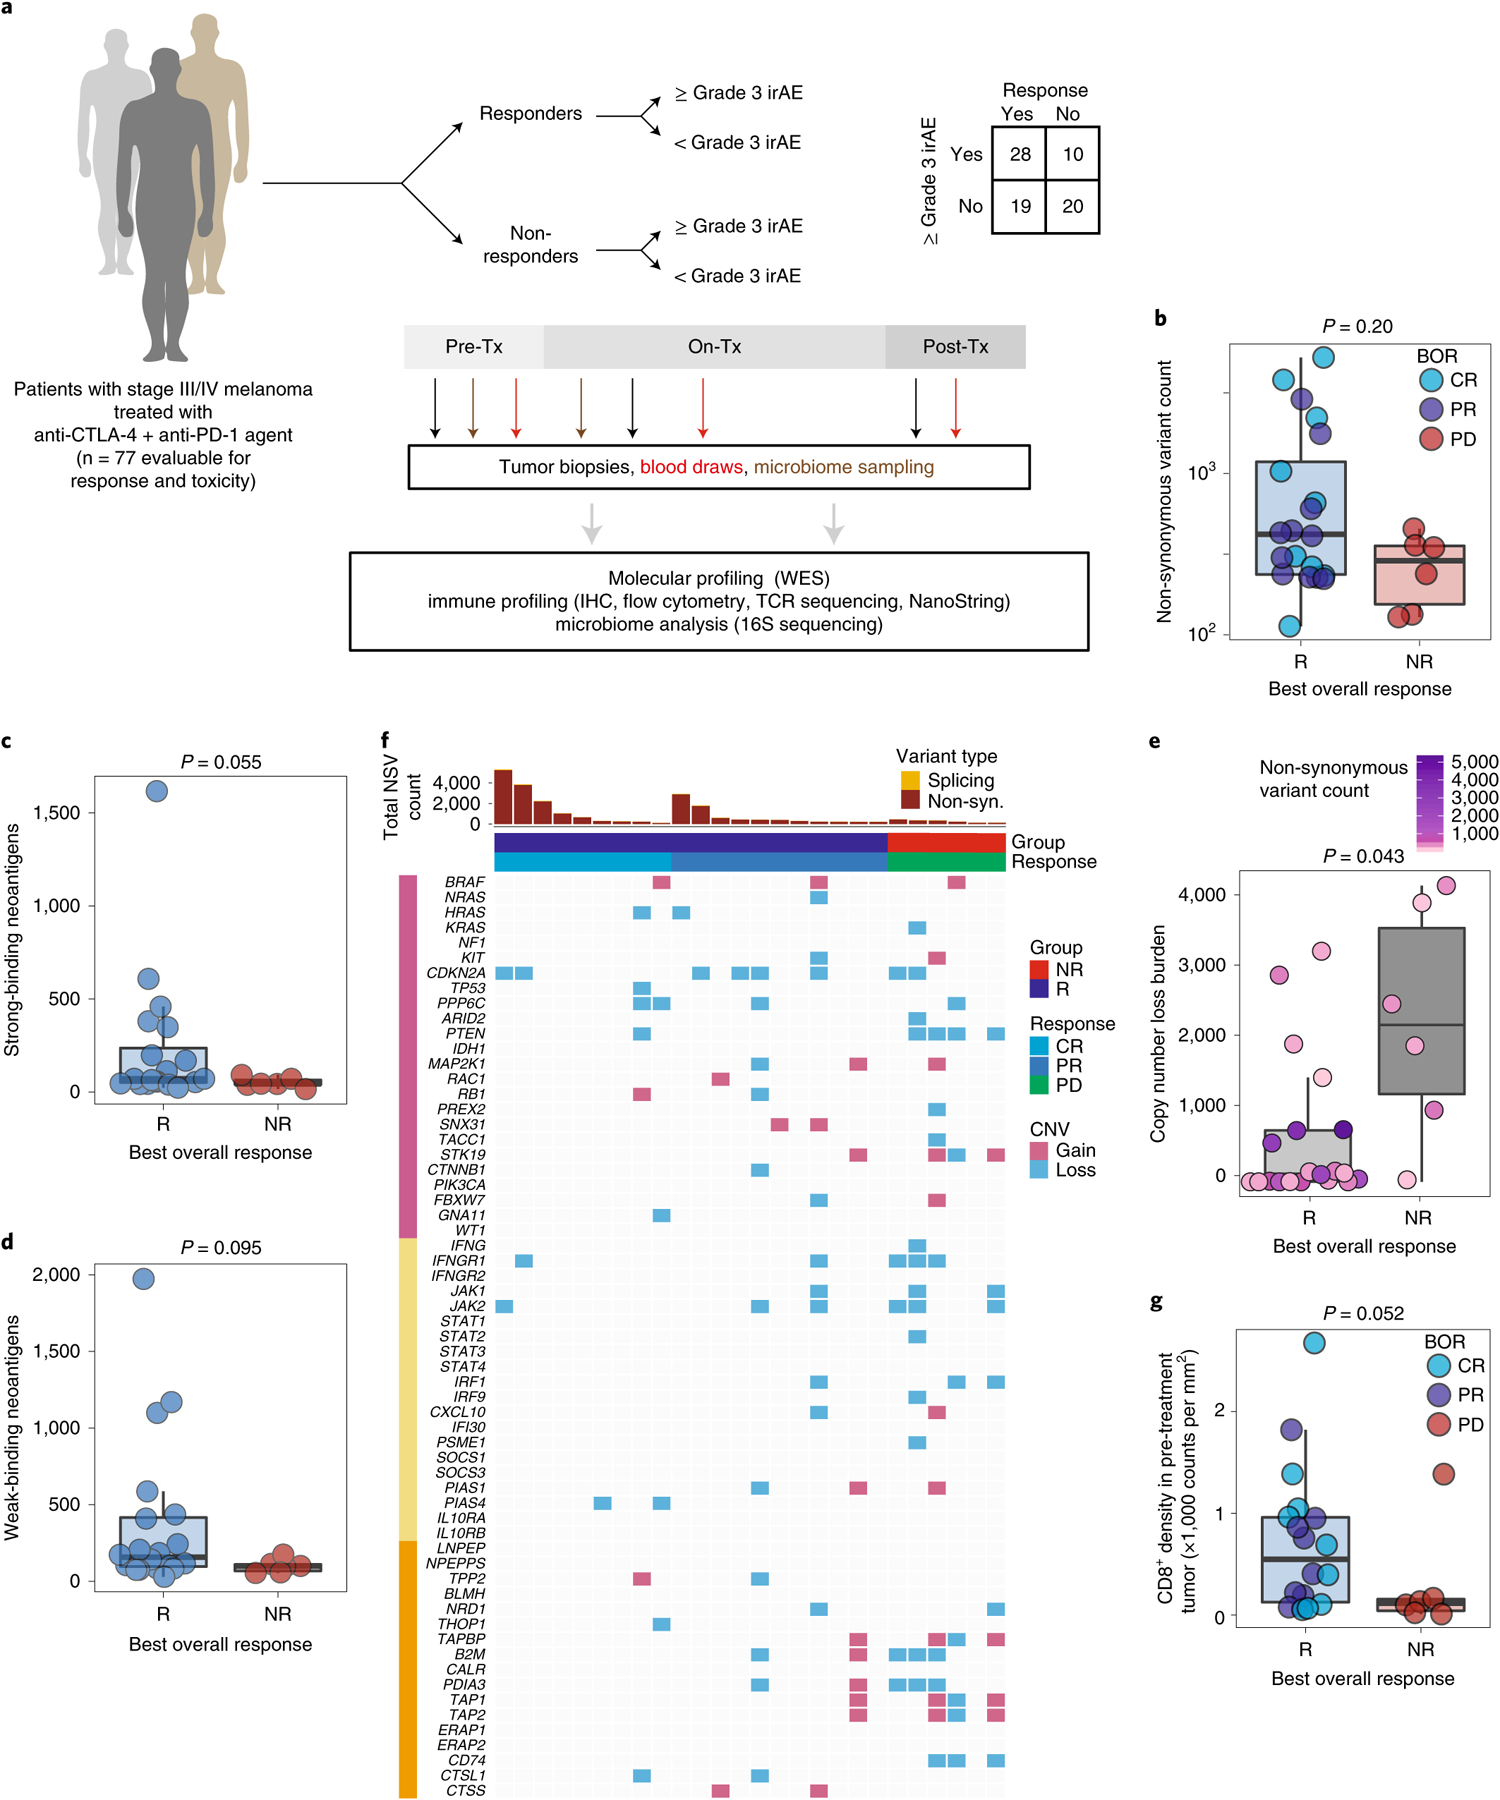
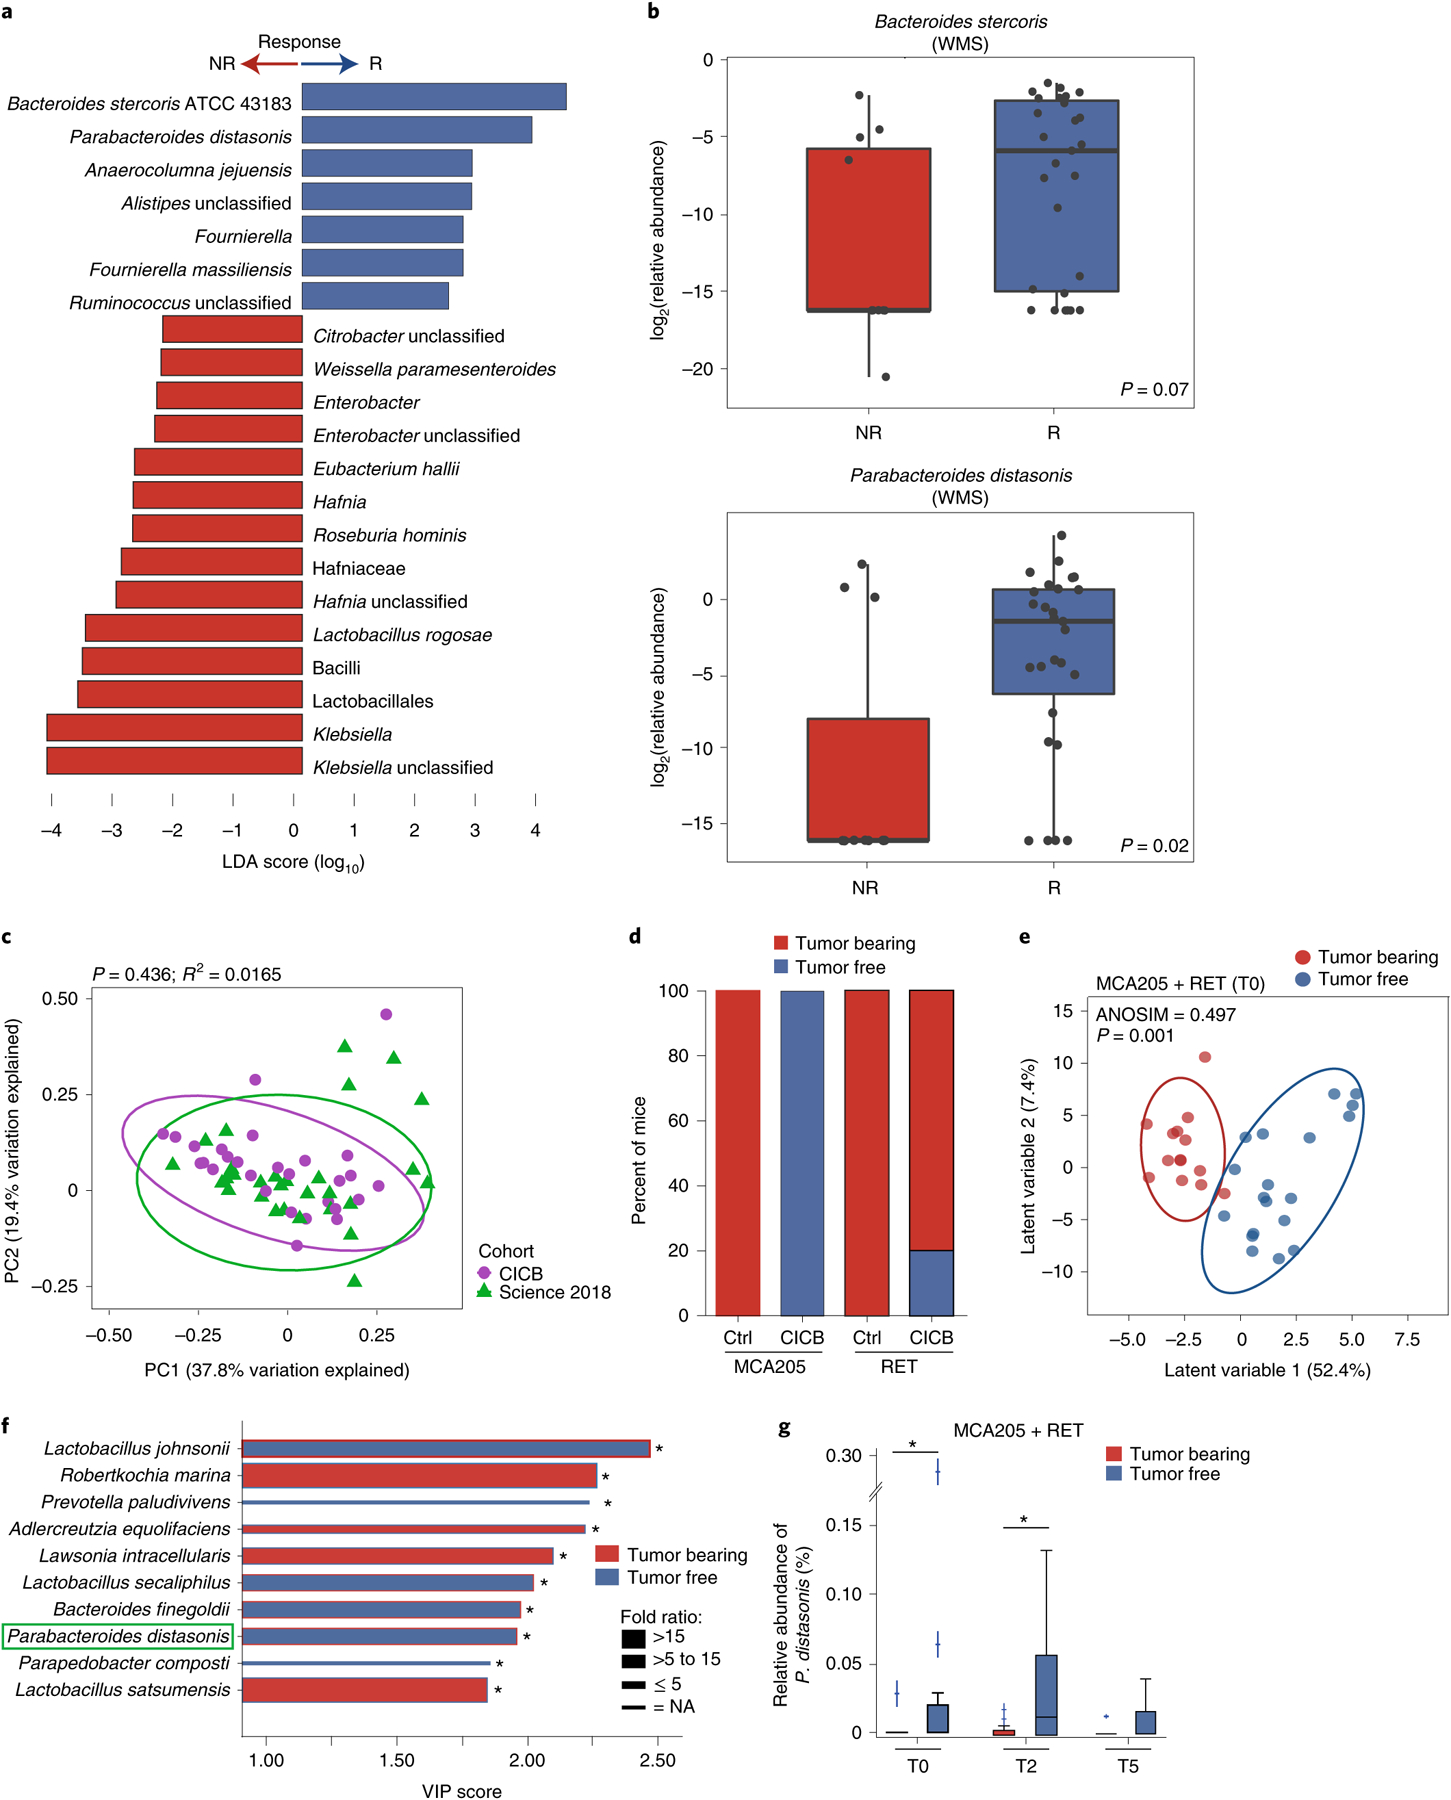
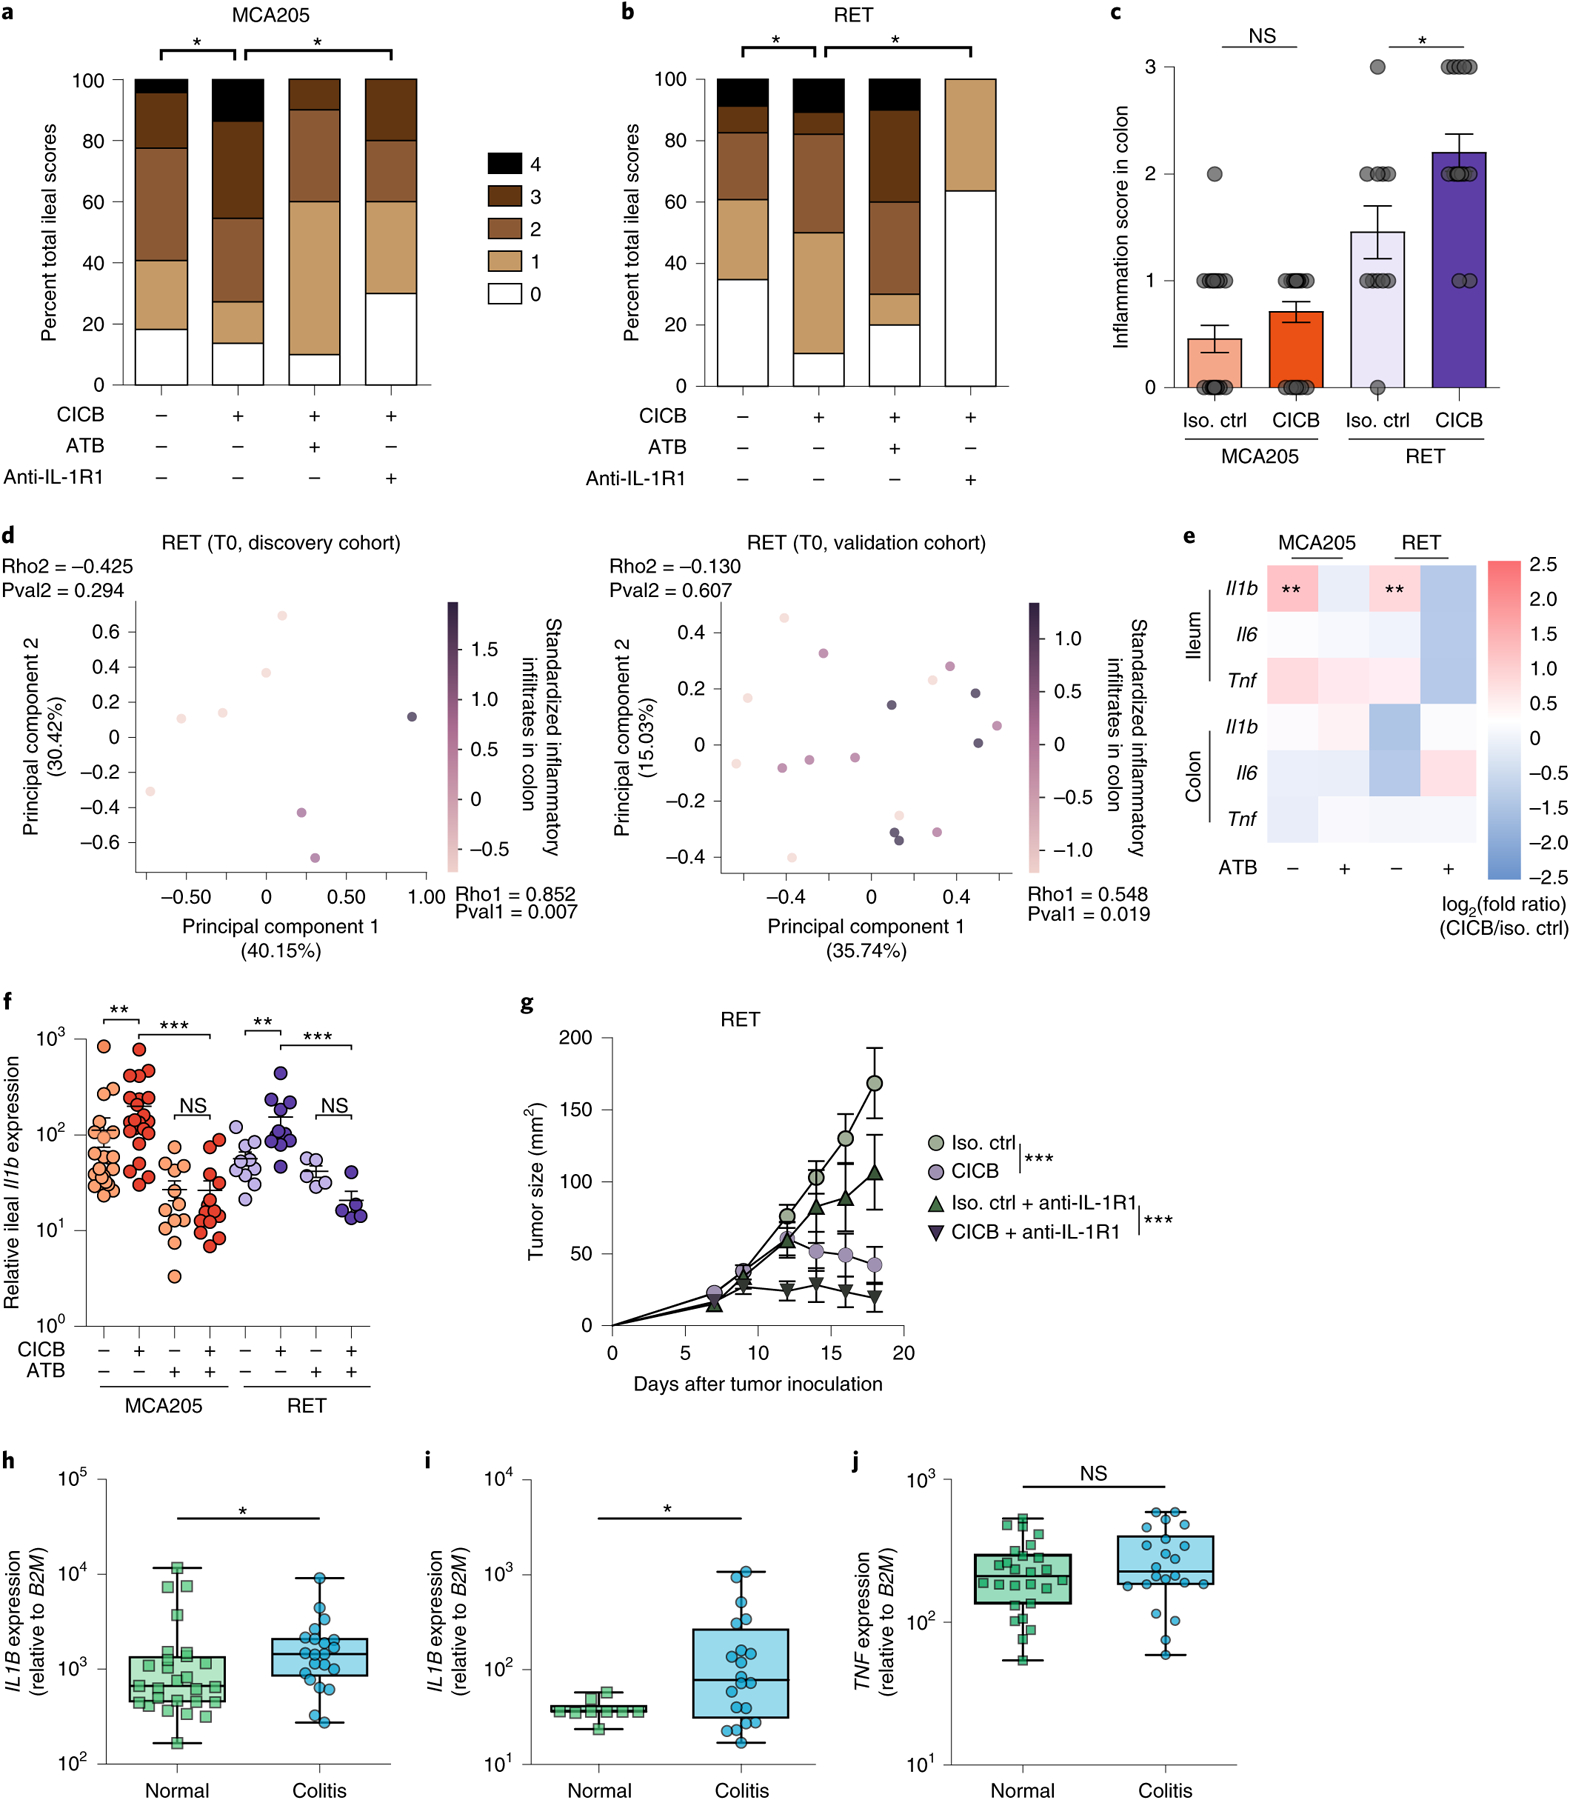
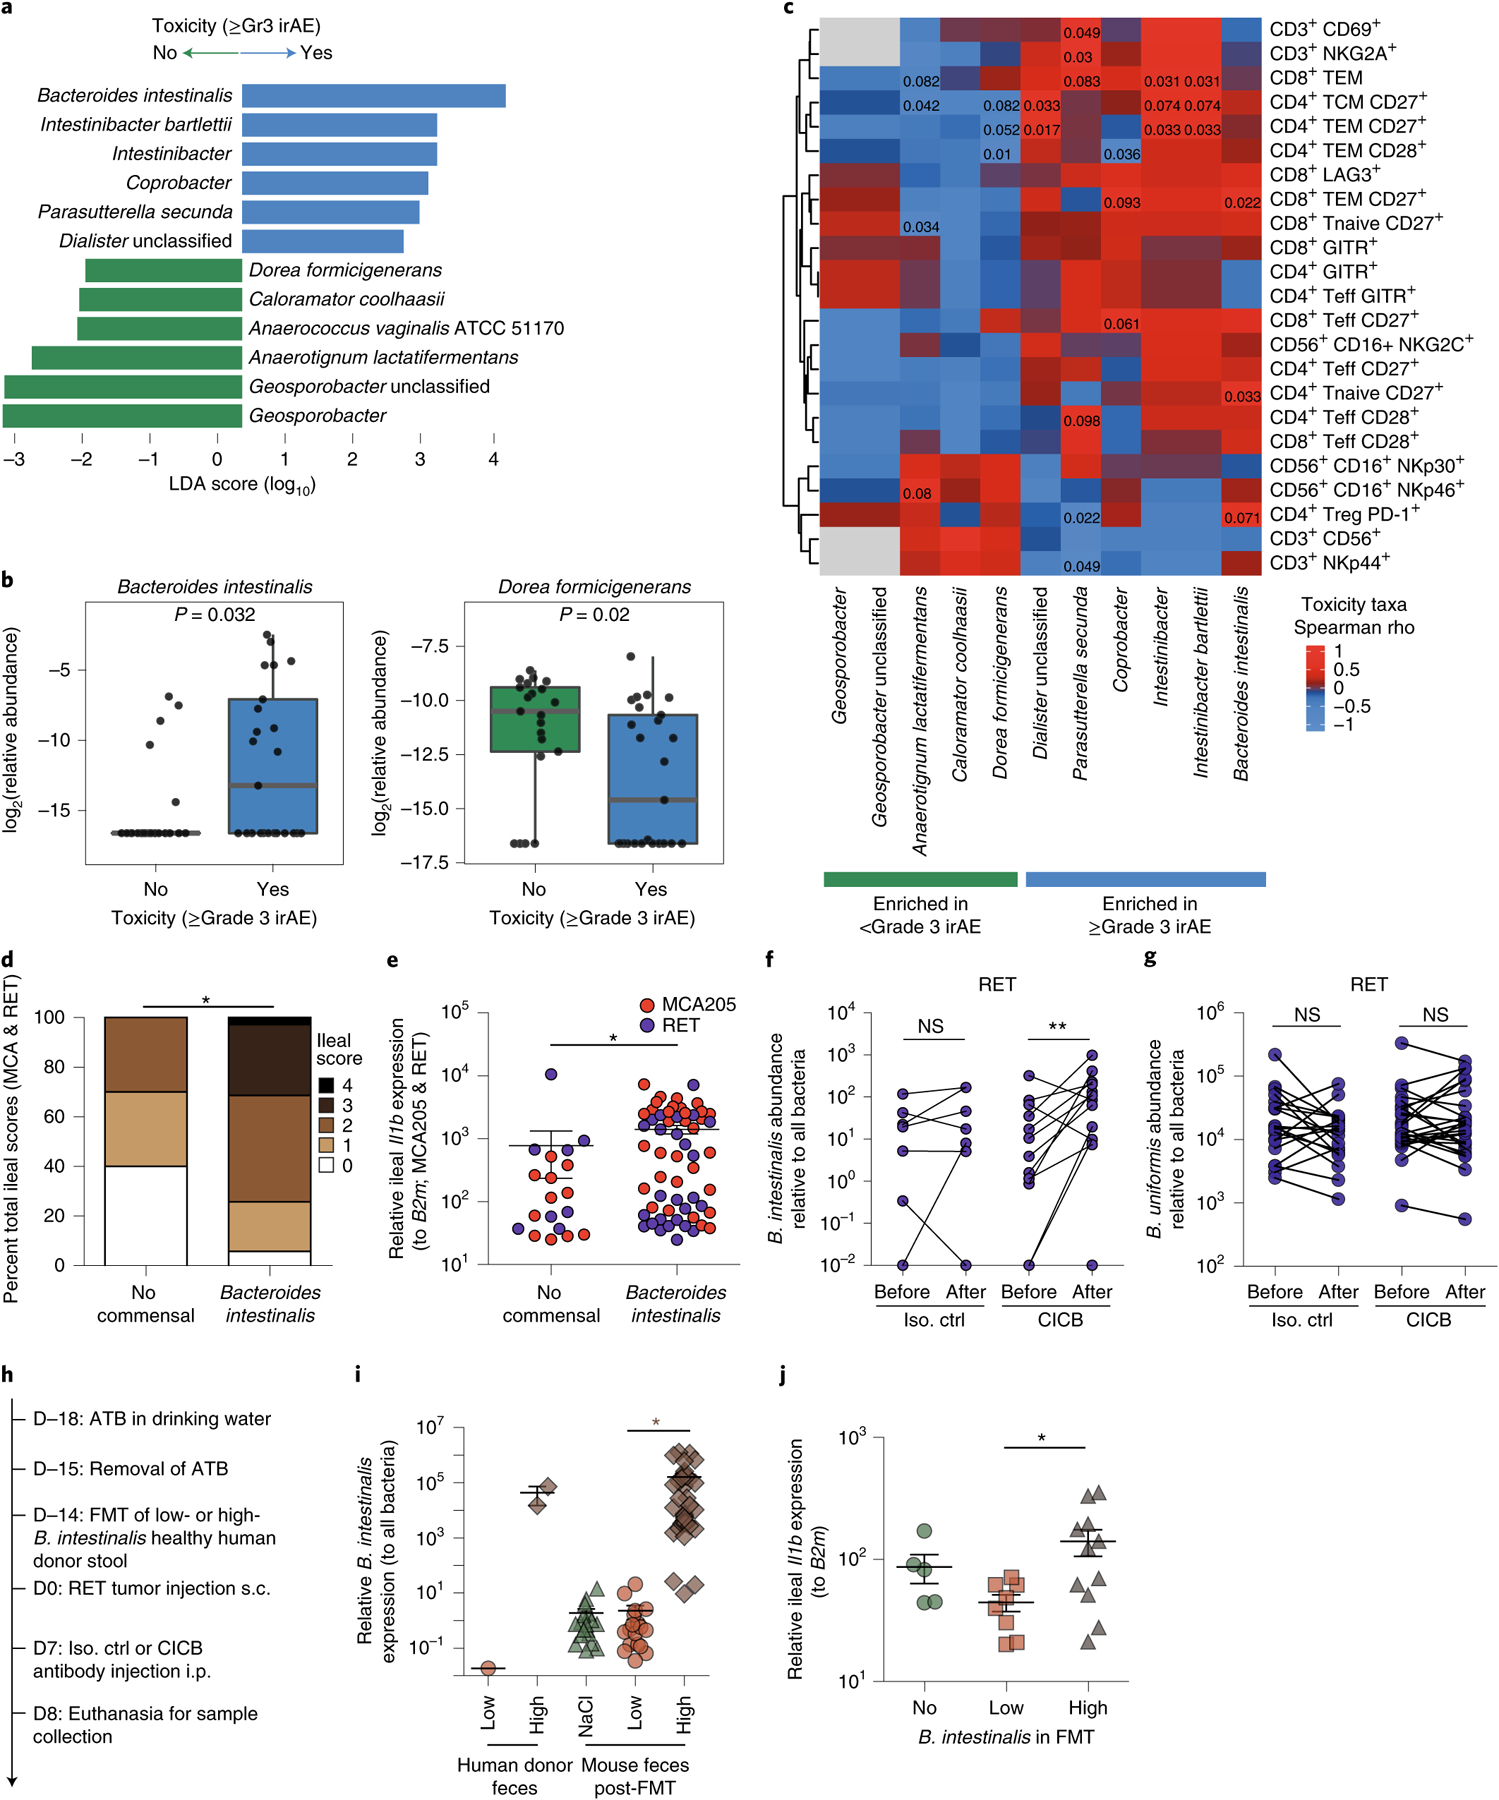
Treatment with combined immune checkpoint blockade (CICB) targeting CTLA-4 and PD-1 is associated with clinical benefit across tumor types, but also a high rate of immune-related adverse events. Insights into biomarkers and mechanisms of response and toxicity to CICB are needed. To address this, we profiled the blood, tumor and gut microbiome of 77 patients with advanced melanoma treated with CICB, with a high rate of any ≥grade 3 immune-related adverse events (49%) with parallel studies in pre-clinical models. Tumor-associated immune and genomic biomarkers of response to CICB were similar to those identified for ICB monotherapy, and toxicity from CICB was associated with a more diverse peripheral T-cell repertoire. Profiling of gut microbiota demonstrated a significantly higher abundance of Bacteroides intestinalis in patients with toxicity, with upregulation of mucosal IL-1β in patient samples of colitis and in pre-clinical models. Together, these data offer potential new therapeutic angles for targeting toxicity to CICB.


Conflict of interest statement

M.C.A. reports advisory board participation and honoraria from Merck Sharp and Dohme, outside the submitted work. V.G. and Z.A.C. are currently employees of AstraZeneca. R.N.A. reports research funding from Bristol-Myers Squibb (BMS), Merck and Genentech, all outside the submitted work. R.C.P. reports honoraria EMD Serono, Merck, Norvartis and Pfizer as well as consulting for Merck, BMS, Novartis, Pfizer and AstraZeneca, and research funding from Merck and Novartis outside the submitted work. H.A.T. reports personal fees from Novartis, grants from Merck and Celgene and grants and personal fees from BMS and Genentech, all outside the submitted work. M.A.D. has been a consultant to Roche/Genentech, Array, Novartis, BMS, GlaxoSmithKline (GSK), Sanofi-Aventis, Vaccinex and Apexigen, and he has been the PI of research grants to UT MD Anderson by Roche/Genentech, GSK, Sanofi-Aventis, Merck, Myriad and Oncothyreon. W.-J.H. reports research grants from Merck, BMS, MedImmune and GSK and has served on an advisory board for Merck, all outside the submitted work. J.E.G. reports advisory board participation with Merck, Regeneron, BMS, Novartis and Syndax. A.J.L. reports personal fees from BMS, Novartis, Genentech/Roche and Merck; personal fees and non-financial support from ArcherDX and Beta-Cat; grants and non-financial support from Medimmune/AstraZeneca and Sanofi; grants, personal fees and non-financial support from Janssen, all outside the submitted work. M.T.T. reports personal fees from Myriad Genetics, Seattle Genetics and Novartis, all outside the submitted work. A.P.C. reports advisory roles and/or stock ownership for Immunai and Vastbiome. M.A.P. reports honoraria from BMS and Merck, consulting fees from BMS, Merck, Array BioPharma, Novartis, Incyte, NewLink Genetics, Aduro, Eisai and Pfizer and institutional support from RGenix, Infinity, BMS, Merck, Array BioPharma, Novartis and AstraZeneca. S.P.P. reports institutional support for a clinical trial from InxMed. J.L.M. reports honoraria from Roche, BMS and Merck. R.R.J. has consulted for Karius, Merck, Microbiome DX and Prolacta, and is on the scientific advisory boards of Kaleido, LISCure, Maat Pharma and Seres, and has received patent royalties licensed to Seres. P.S. reports consulting, advisory roles and/or stocks/ownership for Achelois, Adaptive Biotechnologies, Apricity Health, BioAlta, BioNTech, Codiak Biosciences, Constellation, Dragonfly Therapeutics, Forty-Seven Inc., Hummingbird, ImaginAb, Infinity Pharma, Jounce Therapeutics, Lave Therapeutics, Lytix Biopharma, Marker Therapeutics, Oncolytics, Phenomics and Polaris, and owns a patent licensed to Jounce Therapeutics. J.P.A. reports consulting, advisory roles and/or stocks/ownership for Achelois, Adaptive Biotechnologies, Apricity Health, BioAlta, BioNTech, Codiak Biosciences, Constellation, Dragonfly Therapeutics, Forty-Seven Inc., Hummingbird, ImaginAb, Jounce Therapeutics, Lave Therapeutics, Lytix Biopharma, Marker Therapeutics, Phenomics and Polaris, and owns a patent licensed to Jounce Therapeutics. B.R. reports advisory board membership for Vedanta and research funding from Vedanta, Davoltera and Kaleido. V.G., C.N.S., A.R. and J.A.W. are co-inventors on US patent PCT/US17/53,717, relating to the microbiome. J.A.W., V.G., M.C.A., L. Zitvogel and V.I. are co-inventors on a provisional US patent (WO2020106983A1) relating to the microbiome, relevant to the current work. L. Zitvogel is the main founder of EverImmune, a biotech company devoted to the use of commensal bacteria for the treatment of cancers, is on the board of administrators of Transgene and in the scientific advisory board of EpiVax, Lytix Biopharma, and has received research contracts from Kaleido, BMS, Incyte, Transgene, MERUS and GSK. J.A.W. reports speaker fees from Imedex, Dava Oncology, Omniprex, Illumina, Gilead, MedImmune and BMS; consultant/advisor roles or advisory board membership for Roche-Genentech, Novartis, AstraZeneca, GSK, BMS, Merck/MSD, Biothera Pharma and Microbiome DX; and receives clinical trial support from GSK, Roche-Genentech, BMS and Novartis, all outside the current work. The remaining authors declare no competing interests.

Figures

Extended Data Fig. 1 |
Extended Data Fig. 1 |. Cohort description and tumor intrinsic genomic parameters.
a, Kaplan-Meier curve of progression-free survival in the patient cohort stratified by melanoma subtype (n = 77, n = 63 cutaneous/unknown primary, n = 8 mucosal, n = 6 uveal). b, Landscape of non-synonymous variants (NSV) identified by whole-exome sequencing (n = 26 tumors) affecting selected genes recurrently mutated in melanoma, IFN-signaling genes and antigen processing/presentation genes. c, Differences in counts of total predicted neoantigens, and all binding neoantigens in patients grouped by best overall response (R=responder (blue), n = 20; NR=non-responder (red), n = 6, two-sided Mann-Whitney test left panel p = 0.123, right panel p = 0.121). d, Genome-wide SGOL scores and (e) barplot of the number of genes affected by copy number losses aggregated by chromosome, demonstrating dominant copy number loss burden within chromosomes 5, 10 and 15. f, Copy number loss-affected genes located on chromosome 10 include a broad variety of functional classes. g, Entropy of pre-treatment intratumoral T cell receptor (TCR) repertoires comparing R (n = 19) versus NR (n = 6) repertoires (p = 0.058, two-sided Mann-Whitney test). Box plots present the median bar with the box bounding interquartile range (IQR) and whiskers to the most extreme point within 1.5 × IQR.
Extended Data Fig. 2 |
Extended Data Fig. 2 |. Fecal microbiome composition and diversity at baseline in CICB-treated patients.
a, Stacked bar plot depicting 16S microbial composition of each analyzed fecal sample from the cutaneous and unknown primary cohort at the order level (n = 39). b,c, Comparison of group-wise abundances of Firmicutes (b) (p = 0.39) and Clostridiales (c) (p = 0.38) by response outcome in the cutaneous/unknown primary cohort (n = 39). d, Inverse Simpson alpha diversity of the fecal microbiome grouped by response in CICB-treated patients with cutaneous or unknown primary melanomas (n = 39) taken at baseline (p = 0.68, Mann-Whitney test; R=responder, NR=non-responder). Box plots present the median bar with the box bounding interquartile range (IQR) and whiskers to the most extreme point within 1.5 × IQR. All tests are two-sided unless otherwise specified.
Extended Data Fig. 3 |
Extended Data Fig. 3 |. Microbial associations with CICB response are confirmed by whole metagenomic sequencing.
a, Volcano plot of pairwise comparisons of bacterial taxa (at all levels) identified from 16S sequencing (n = 40) dichotomized by response to CICB using Mann-Whitney tests applied to 1000 permutations of differential bacterial abundance. b, Procrustes analysis demonstrating high concordance between taxonomic identification using either 16S or WMS methods within the response cohort (Mantel: r=0.650, p = 0.001). c, A strong positive correlation was observed between abundance of Bacteroides stercoris quantified using 16S versus WMS (Spearman’s rho=0.934 p = 2.2e-16). d, Confirmation of bacterial candidate associations with response using WMS. Box plots present the median bar with the box bounding interquartile range (IQR) and whiskers to the most extreme point within 1.5 × IQR. All tests are two-sided unless otherwise specified.
Extended Data Fig. 4 |
Extended Data Fig. 4 |. Validation of microbial composition and response taxa across additional datasets.
a, Ordination of microbial beta diversity contrasting compositional differences between responders (R, n = 59) and non-responders (NR, n = 24) across the pooled CICB and previously published anti-PD-1 monotherapy (Science 2018) cohorts (Weighted UniFrac, PERMANOVA two-sided p = 0.002). b, Abundance of key response-associated taxa identified in the CICB cohort were evaluated in re-processed microbiome data from several published cohorts, indicating taxa enriched in responders (blue), taxa enriched in non-responders (red), or not detected (white) in each cohort by two-sided Mann-Whitney test (Ruminococcus; Gopalakrishnan, Science 2018 one-sided p = 0.0240, Frankel, Neoplasia 2017 one-sided p = 0.0487).
Extended Data Fig. 5 |
Extended Data Fig. 5 |. Associations between prevalent bacterial taxa and tumor response in murine models.
a, Experimental setting for murine studies shown in Figs. 2 and 3. Treatment of established transplantable tumors (MCA205 sarcoma or RET melanoma) by intraperitoneal (i.p.) administrations of CICB and feces collection at three time points for 16S rRNA gene sequencing. Feces collection time points: T0=before treatment initiation (Day 0), T2=48 hours after 2 treatments (Day 5), T5=48 hours after 5 treatments (Day 14). In studies utilizing antibiotic (ATB) treatment, ATB was commenced 14 days prior to tumor inoculation and continued throughout. b, Pearson correlation between the relative abundance of Parabacteroides distasonis (at T0, T2, and T5) and standardized tumor size at T5 in MCA205 and RET tumor-bearing mice (two-sided p = 0.010, r = −0.614). c, Heatmap of Spearman correlations between the most prevalent (>20%) bacterial species identified in mouse feces at different time points (T0, T2, T5) from RET tumor-bearing mice and colon inflammatory infiltrates. Data are derived from combined discovery and validation cohort animals. Red represents a positive correlation, while blue represents a negative correlation with colonic infiltrate score. Following FDR adjustment, no significant correlations were observed.
Extended Data Fig. 6 |
Extended Data Fig. 6 |. Microbial associations with immune-related toxicity are confirmed by whole metagenomic sequencing.
a, Inverse Simpson alpha diversity from 16S sequencing of baseline fecal microbiota in CICB-treated patients (n = 54) was not associated with subsequent development of high-grade immune-related adverse events (irAE). Mann-Whitney test (p = 0.71). b, Volcano plot of pairwise comparisons of bacterial taxa (at all levels) dichotomized by experience of high-grade (≥Grade 3) immune-related adverse events (n = 54 patients) using Mann-Whitney tests applied to 1000 permutations of differential bacterial abundance. Unadjusted p-values shown, adjusted values in supplemental tables 5 and 8. c, Procrustes analysis demonstrating high concordance between taxonomic identification using either 16S or WMS methods (Mantel: r=0.665, p = 0.001). d, Confirmation of bacterial candidate associations with toxicity using WMS (≥ Gr3 irAE: n = 25 Yes, n = 21 No). Significant associations existed for Bacteroides intestinalis (p = 0.032) and Dorea formicigenerans (p = 0.020) all other associations were non-significant. e, A strong positive correlation was observed between abundance of Bacteroides intestinalis quantified using 16S versus WMS (Spearman’s rho=0.62, p = 4.2e-6). f, Box-whisker plot of relative abundance of Bacteroides intestinalis in the combined McGill/University of Toronto cohort of melanoma patients treated with immune checkpoint blockade demonstrating identification of this species exclusively in patients developing irAE (≥Gr1 n = 37 Yes, n = 8 No; One-tailed Mann Whitney test p = 0.2269). Box plots present the median bar with the box bounding interquartile range (IQR) and whiskers to the most extreme point within 1.5 × IQR. All tests are two sided unless otherwise specified.
Extended Data Fig. 7 |
Extended Data Fig. 7 |. Immune markers of CICB toxicity.
a, b, Comparison of Ki67+ cells within CD8+ T effectors (Teff; a) and T central memory (TCM; b) cells in early on-treatment blood samples between patients with available blood samples (n = 14) grouped according to high-grade irAE (Mann-Whitney test left panel p = 0.0044, right panel p = 0.013). c, Gating strategy for key CD4/8+ T cell populations. d, e, Percentage of CD28+ cells within CD4+ Teff (c) and CD27+ cells within CD8+ Teff (d) measured at baseline in this patient cohort (MDACC; left panels) and a separate cohort of patients treated with CICB at Memorial Sloan-Kettering Cancer Center (MSKCC; right panels). Data are grouped by experience of high-grade irAE (Mann-Whitney test (d) left panel p = 0.014, right panel p = 0.050 (e) left panel p = 0.072, right panel p = 0.32)). f, Boxplot depicting a higher diversity of the peripheral T cell repertoire as measured by TCR Vβ sequencing in patients experiencing high-grade irAE (n = 24, Mann-Whitney test; p = 0.028). g, Boxplot showing the number of significantly expanded T cell clones (pre- to on-treatment) detected by TCR sequencing of the peripheral blood immune repertoire, grouped by presence or absence of high-grade irAE (n = 16, Mann-Whitney test: p = 0.22). Box plots present the median bar with the box bounding interquartile range (IQR) and whiskers to the most extreme point within 1.5 × IQR. All tests are two sided unless otherwise specified.
Fig. 1 |
Fig. 1 |. Molecular and immune predictors of response.
a, Cohort of patients with advanced melanoma (n = 77) evaluated for clinical outcomes and correlative biospecimen analyses prior to and following initiation of combined anti-CTLA-4 and anti-PD-1 blockade. Tx, treatment. b, Non-synonymous variant (NSV) count in pre-treatment tumor samples (n = 26) grouped by binarized best overall response (BOR) (R, responder, n = 20; NR, non-responder, n = 6; CR, complete response; PR, partial response; PD, progressive disease). Specific objective responses are indicated by the color of each data point (Mann–Whitney test, P = 0.20). c,d, Strong (c) and weak (d) binding neoantigen predictions grouped by best overall response as in b (Mann–Whitney test, P = 0.055 (c) and P = 0.005 (d)). e, Copy number loss burden (affected genomic regions) in pre-treatment tumor samples (n = 26) grouped by binarized best overall response (Mann–Whitney test, P = 0.043). Tumor mutation burden is indicated for each sample by color. f, Oncomap of copy number alterations affecting genes belonging to three groups: commonly mutated or copy number altered in melanoma (pink), IFN-γ related signaling (yellow) and antigen processing (orange). g, Density of infiltrating CD8+ cells (counts per mm2) in pre-treatment tumors by singlet stain immunohistochemistry grouped by binarized response (n = 19 R, n = 6 NR; one-sided Mann–Whitney test, P = 0.052). Box plots present the median bar with the box bounding the interquartile range (IQR) and whiskers the most extreme points within 1.5× IQR. All statistical tests are two-sided except where otherwise specified.
Fig. 2 |
Fig. 2 |. Gut microbial associations with CICB response.
a, Linear discriminant analysis score plot using the Mann–Whitney test of bacterial taxa significantly enriched in patients, either responders (n = 29) or non-responders (n = 11) to CICB, from the cutaneous and unknown primary cohort (n = 40; P < 0.05). b, Abundance of candidate response taxa determined by WMS compared between response groups (total n = 38 patients with cutaneous melanoma: n = 27 R, n = 11 NR). Mann–Whitney test (top, P = 0.07; bottom, P = 0.02). Box plots present the median bar with the box bounding the IQR and whiskers the most extreme points within 1.5× IQR. c, Comparison of gut microbial composition in responders to CICB (n = 29; ‘CICB’, purple) and responders to anti-PD-1 monotherapy in our previously published cohort (n = 30; ref., ‘Science 2018’, green) as determined by ordination of beta diversity (weighted UniFrac, PERMANOVA P = 0.436). d, Percentages of tumor-free versus tumor-bearing mice after four intraperitoneal administrations of anti-PD-1 Ab + anti-CTLA-4 mAb (CICB) or isotype control mAbs (Ctrl) used to treat day 7 established MCA205 or RET tumors (n = 24 mice per group, pooled data from two experiments). e, PLS-DA plot of the variance in beta diversity at T0, between CICB-treated mice that were eventually tumor-free or tumor-bearing at euthanasia, in both tumor models combined. ANOSIM defines the separation of the groups; the P value defines the significance of such separation after 999 permutations of the samples (ANOSIM = 0.497, P = 0.001). f, VIP score barplot highlighting bacterial species present at T0 significantly enriched in the group defined by the bar color (highest mean relative abundance) compared to the group defined by the border color (lowest mean relative abundance), indicating mice that were eventually tumor-free versus tumor-bearing following CICB treatment (RET and MCA205 models). An absent border indicates a mean relative abundance of zero in the compared cohort(s). The green box highlights a species in common with patient data. Mann–Whitney test: *P < 0.05; NS, not significant. Bar thickness reports the fold ratio value of the mean relative abundances for each species among the two cohorts. NA, not applicable. g, Relative abundance of P. distasonis (at T0, T2 and T5) in tumor-free and tumor bearers over time. *P < 0.05 by Mann–Whitney test. Error bars represent the mean ± s.e.m. All statistical tests are two-sided except where otherwise specified.
Fig. 3 |
Fig. 3 |. Role of gut microbiota and ileal IL-1β in CICB-induced intestinal inflammation in tumor-bearing mice.
a,b, Scoring (range 0–4) of hematoxylin and eosin-stained inflammatory infiltrates and pathological lesions of the ilea in MCA205 (a; P = 0.042) or RET (b; P = 0.024) tumor-bearing mice treated with isotype control or CICB, ± antibiotics (ATB) or with the IL-1R1 antagonist, anakinra, 24 h after at least one CICB injection (n = 9–22 per group). Student’s t-test. c, Scoring of inflammatory colonic lesions in MCA205 and RET tumor-bearing mice analogous to that shown in a and b (Mann–Whitney test, P = 0.018). Error bars represent mean ± s.e.m. d, Beta diversity ordination (Bray–Curtis dissimilarity) of the fecal microbiota assessed by sequencing of 16S rRNA gene amplicons colored according to score of colonic inflammatory infiltrate in RET tumor-bearing mice. Intensity of the purple indicates increasing inflammatory infiltrate score in the discovery (left) and validation (right) cohorts. Bacterial relative abundances and colonic inflammatory infiltrate were both normalized and standardized before correlation analysis. Pearson correlation and associated P values comparing each principal component with inflammatory infiltrate are indicated (discovery P = 0.294, ρ = −0.425; validation P = 0.607, ρ = −0.130). e, Heatmap of log2(fold change) of pro-inflammatory immune gene expression (CICB-treated versus isotype) in ilea and colons of MCA205 and RET tumor-bearing mice ± ATB. n = 10–22 mice per group. Mann–Whitney test: MCA P = 0.0032, RET P = 0.0016. f, Relative ileal Il1b expression in tumor-bearing mice treated with isotype/CICB ± ATB. n = 10–22 mice per group. Mann–Whitney test: *P < 0.05, **P < 0.01, ***P < 0.001; NS, not significant. g, Tumor growth kinetics of RET melanoma in mice treated with CICB ± IL-1R1 antagonist anakinra. Data presented as mean ± s.e.m. tumor sizes from a representative experiment of two yielding similar results, comprising six mice per group. ANOVA test: ***P < 0.001. Error bars represent mean ± s.e.m. hj, qPCR measurement of the relative IL1B (h; P = 0.042), IL17 (i; P = 0.041), TNF (j; NS) expression in colon samples from patients with melanoma experiencing immune-related colitis following ICB comparing areas of active inflammation (colitis) with areas of normal colonic tissue (‘normal’; intra-patient or cancer-free controls) (*P < 0.05, Mann–Whitney test). Box plots present the median bar with the box bounding the IQR and whiskers the most extreme points within 1.5× IQR. Additional details are provided in Supplementary Table 7. All statistical tests are two-sided except where otherwise specified.
Fig. 4 |
Fig. 4 |. Bacteroides intestinalis is associated with intestinal IL-1β and colitis in the melanoma cohort.
a, Linear discriminant analysis score plot using the Mann–Whitney test from LEfSe analysis of bacterial taxa significantly associated with development of, or freedom from, high-grade (≥grade 3, n = 29) irAEs in all patients with available fecal samples (n = 54; P < 0.05). b, Abundance of candidate taxa by WMS (total n = 46 patients: n = 25 ≥grade 3, n = 21 <grade 3). Mann–Whitney test (left, P = 0.032; right, P = 0.020). Box plots present the median bar with the box bounding the IQR and whiskers the most extreme points within 1.5× IQR. c, Heatmap of correlation (Spearman’s ρ) between key toxicity-associated or non-toxicity-associated bacterial taxa and circulating immune subsets quantitated by multiparameter flow cytometry of baseline blood samples (n = 13). Teff, T effector cells; TCM, T central memory; TEM, T effector memory; Treg, regulatory T cell. d,e, Total ileal toxicity scores (d; P = 0.0021) and relative Il1b expression (e; P = 0.0025) across MCA205 and RET tumor models showing higher toxicity (d) and higher Il1b expression (e) in animals treated with antibiotic microbiota ablation and subsequently colonized with B. intestinalis by gavage versus spontaneous recolonization (no administered commensal). Ileal toxicity was assessed at day 9 post-tumor inoculation in MCA205 (n = 5–32 per group, red dots) and RET (n = 5–26 per group, blue dots) combined. Data represent a pool of two individual experiments using three different strains of B. intestinalis, at 48 h post oral gavage. For ileal toxicity scoring, mice were classified according to low (score 0 or 1) versus high (score 2, 3 or 4) toxicity and compared by chi-square test: *P < 0.05. Ileal Il1b expression was analyzed using Mann–Whitney test: *P < 0.05. f,g, qPCR quantification of the relative abundance of B. intestinalis (f) or non-implicated B. uniformis (g) in feces of mice treated with isotype versus CICB, before and after therapy (**P = 0.0068 or NS). Data are shown in a paired manner (lines link samples from individual mice). n = 21–26 mice per group. Wilcoxon signed-rank test: **P < 0.01. h, Experimental schema for RET-model mice receiving FMT from human donors of differing B. intestinalis abundance and subsequent treatment with CICB or control. i, Differing B. intestinalis content in human donor feces (‘low’ versus ‘high’) and murine colonization following FMT or sham FMT (NaCl) was confirmed by qPCR. Mann–Whitney test (P < 0.001). j, Mice receiving FMT from B. intestinalis ‘high’ donor feces displayed higher expression of Il1b measured by qPCR of ileal tissue sampled 24 h after administration of a single dose of CICB. Mann–Whitney test (P = 0.0287). All statistical tests are two-sided except where otherwise specified.

Comment in

References

    1. Larkin J et al. Combined nivolumab and ipilimumab or monotherapy in untreated melanoma. N. Engl. J. Med 373, 23–34 (2015). - PMC - PubMed
    1. Hammers HJ et al. Safety and efficacy of nivolumab in combination with ipilimumab in metastatic renal cell carcinoma: the CheckMate 016 Study. J. Clin. Oncol 35, 3851–3858 (2017). - PMC - PubMed
    1. Sznol M et al. Pooled analysis safety profile of nivolumab and ipilimumab combination therapy in patients with advanced melanoma. J. Clin. Oncol 35, 3815–3822 (2017). - PubMed
    1. Attia P et al. Autoimmunity correlates with tumor regression in patients with metastatic melanoma treated with anti-cytotoxic T-lymphocyte antigen-4. J. Clin. Oncol 23, 6043–6053 (2005). - PMC - PubMed
    1. Das S & Johnson DB Immune-related adverse events and anti-tumor efficacy of immune checkpoint inhibitors. J. Immunother. Cancer 7, 306 (2019). - PMC - PubMed

Publication types