. 2021 Jun;66(6):2095-2109.
doi: 10.1002/lno.11711. Epub 2021 Feb 28.

Spatial variability of prokaryotic and viral abundances in the Kermadec and Atacama Trench regions

Affiliations

Spatial variability of prokaryotic and viral abundances in the Kermadec and Atacama Trench regions

Clemens Schauberger et al. Limnol Oceanogr. 2021 Jun.

Abstract

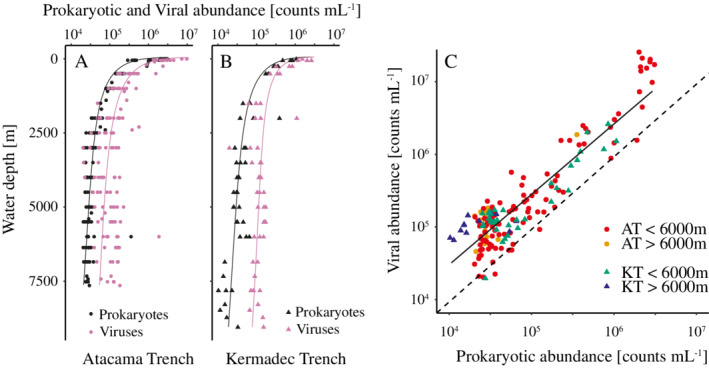
Hadal trenches represent the deepest part of the ocean and are dynamic depocenters with intensified prokaryotic activity. Here, we explored the distribution and drivers of prokaryotic and viral abundance from the ocean surface and 40 cm into sediments in two hadal trench regions with contrasting surface productivity. In the water column, prokaryotic and viral abundance decreased with water depth before reaching a rather stable level at ~ 4000 m depth at both trench systems, while virus to prokaryote ratios were increasing with depth, presumably reflecting the declining availability of organic material. Prokaryotic and viral abundances in sediments were lower at the adjacent abyssal sites than at the hadal sites and declined exponentially with sediment depth, closely tracking the attenuation of total organic carbon (TOC) content. In contrast, hadal sediment exhibited erratic depth profiles of prokaryotes and viruses with many subsurface peaks. The prokaryotic abundance correlated well to extensive fluctuations in TOC content at centimeter scale, which were likely caused by recurring mass wasting events. Yet while prokaryotic and viral abundances cross correlated well in the abyssal sediments, there was no clear correlation in the hadal sites. The results suggested that dynamic depositional conditions and higher substrate availability result in a high spatial heterogeneity in viral and prokaryotic abundances in hadal sediments in comparison to more stable abyssal settings. We argue that these conditions enhance the relatively importance of viruses for prokaryotic mortality and carbon recycling in hadal settings.


Conflict of interest statement

None declared.

Figures

Fig. 1
Fig. 1
Maps of the regions studied (black boxes) in the Kermadec Trench and Atacama Trench (A), bathymetric maps with sampling sites (black circles) in the Kermadec Trench (B), and Atacama Trench (C). All bathymetry data were sourced from the Global Multi‐Resolution Topography Synthesis (Ryan et al. 2009).
Fig. 2
Fig. 2
Water depth distributions of pelagic prokaryotic (black) and viral (pink) abundances in the Atacama Trench (A; circles; n = 131) and Kermadec Trench (B; triangles; n = 47). The regression equation of Atacama Trench prokaryotic (log10) and viral (log10) abundance as a function of oceanic depth (log10) was y = −0.67x + 5.6 (R 2 = 0.91) and y = −0.72x + 6.1 (R 2 = 0.80), respectively. In the Kermadec Trench, these fitted regressions were y = −0.66x + 5.6 (R 2 = 0.84) for prokaryotic abundance and y = −0.48x + 5.8 (R 2 = 0.66) for viral abundance. (C) Relationship between pelagic viral (y‐axis) and prokaryotic (x‐axis) abundances of the Kermadec Trench (green and blue triangles) and Atacama Trench (red and orange circles) with a fitted regression (black line) on log‐transformed data (y = 0.9871x + 0.5279; R 2 = 0.82; Pearson P < 0.001). The dotted line represents a 1 : 1 relationship.
Fig. 3
Fig. 3
Comparison of benthic viral abundances quantified with epifluorescence microscopy and flow cytometry in sediments from the abyssal plain (red and green) and hadal sites (orange and blue) of the Atacama Trench (circles; n = 41) and Kermadec Trench (triangles; n = 20). The stippled line represents a 1 : 1 relationship. The equation of the linear regression between flow cytometry and epifluorescence microscopy counts (non‐log transformed) was y = 1.39x + 3.3*107 (R 2 = 0.54, p ~ 2 × 10−11).
Fig. 4
Fig. 4
Sediment depth distributions of benthic prokaryotic (black) and viral abundances (pink) in cores from the Atacama Trench (circles; upper eight panels; n = 242) and Kermadec trench (triangles; lower six panels; n = 115). At the Kermadec Trench, only samples from K6, K4 SL, and K7 were without visual disturbances of the sediment surfaces. The dotted lines represent the oxygen penetration depths at the respective sites (Glud et al. 2021).
Fig. 5
Fig. 5
Mean depth integrated prokaryotic (black) and viral abundances (pink) to 15 cm depth at abyssal (left; each bar: n = 2) and hadal sites (right; Atacama Trench: n = 12; Kermadec Trench: n = 3) of the Atacama and Kermadec Trenches. Error bars indicate the standard error between individual sediment cores.
Fig. 6
Fig. 6
Comparison of benthic viral and prokaryotic abundances in sediment at abyssal sites (A) (n = 76) and hadal sites (B) (n = 281) of the Kermadec Trench (triangles) and the Atacama Trench (circles). The stippled lines represent a 1 : 1 relationship. The equation for the regression between log‐transformed viral and prokaryotic abundance was y = 1.05x − 0.27 (R 2 = 0.64, Pearson P < 0.001) in abyssal settings and y = 0.62x + 3.35 (R 2 = 0.20, Pearson P < 0.001) for hadal samples.
Fig. 7
Fig. 7
Sediment depth distributions of prokaryotic abundance (black) and TOC (brown; % dry weight) profiles from selected sites from the Kermadec Trench (triangles) and Atacama Trench (circles) (AD).
Fig. 8
Fig. 8
Relationships of prokaryotic (A) and viral (B) abundances (y‐axes) and the total organic content (TOC) (x‐axes) in sediments from the Atacama Trench (orange circles; n = 174) and Kermadec Trench (blue triangles; n = 88). The equation for the linear regressions between log‐transformed prokaryotic abundances and TOC was y = 0.75x + 7.86 (R 2 = 0.43) and between log‐transformed viral abundances and TOC concentrations y = 0.39x + 8.17 (R 2 = 0.05).
Fig. 9
Fig. 9
(A) Relationship between pelagic viral and prokaryotic abundances from hadal depths from the Mariana Trench (green squares, n = 6; Nunoura et al. 2015), Japan Trench (red squares, n = 16; Nunoura et al. 2016), Kermadec Trench (blue triangles, n = 13; this study), and Atacama Trench (orange circles, n = 24; this study), in comparison with a global compilation of abundance data (gray circles, Wigington et al. 2016). The stippled line represents a 1 : 1 relationship. (B) VP ratios with oceanic depth of all datapoints from the aforementioned studies.

References

    1. Angel, M. V. 1982. Ocean trench conservation. Environmentalist 2: 1–17. doi:10.1007/BF02340472 - DOI
    1. Azam, F. 1998. Microbial control of oceanic carbon flux: The plot thickens. Science 280: 694–696. doi:10.1126/science.280.5364.694 - DOI
    1. Bendtsen, J. , Lundsgaard C., Middelboe M., and Archer D.. 2002. Influence of bacterial uptake on deep‐ocean dissolved organic carbon. Global Biogeochem. Cycles 16: 74‐1–74‐12. doi:10.1029/2002GB001947 - DOI
    1. Blankenship, L. E. , Yayanos A. A., Cadien D. B., and Levin L. A.. 2006. Vertical zonation patterns of scavenging amphipods from the Hadal zone of the Tonga and Kermadec Trenches. Deep‐Sea Res. Part I Oceanogr. Res. Pap. 53: 48–61. doi:10.1016/j.dsr.2005.09.006 - DOI
    1. Brussaard, C. P. 2004. Optimization of procedures for counting viruses by flow cytometry. Appl. Environ. Microbiol. 70: 1506–1513. doi:10.1128/AEM.70.3.1506-1513.2004 - DOI - PMC - PubMed

LinkOut - more resources