

Bayesian Structure Learning in Multi-layered Genomic Networks
- PMID: 34239216
- PMCID: PMC8259335
- DOI: 10.1080/01621459.2020.1775611
Bayesian Structure Learning in Multi-layered Genomic Networks
Abstract
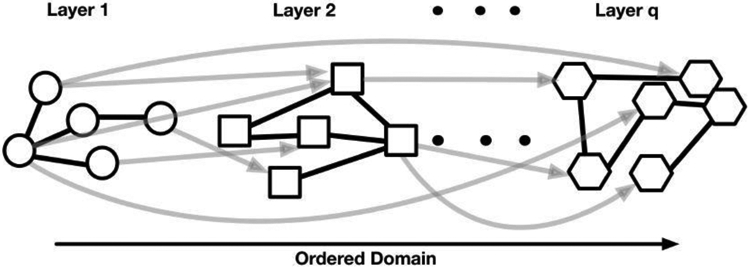
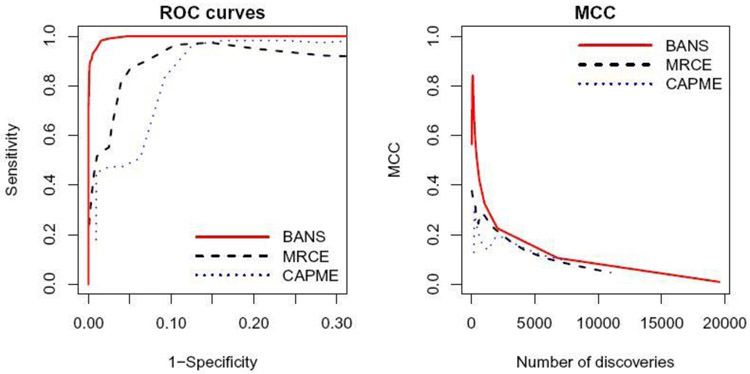
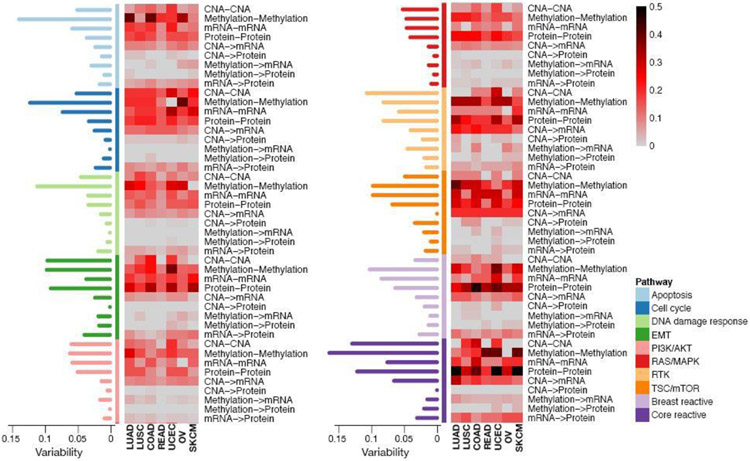
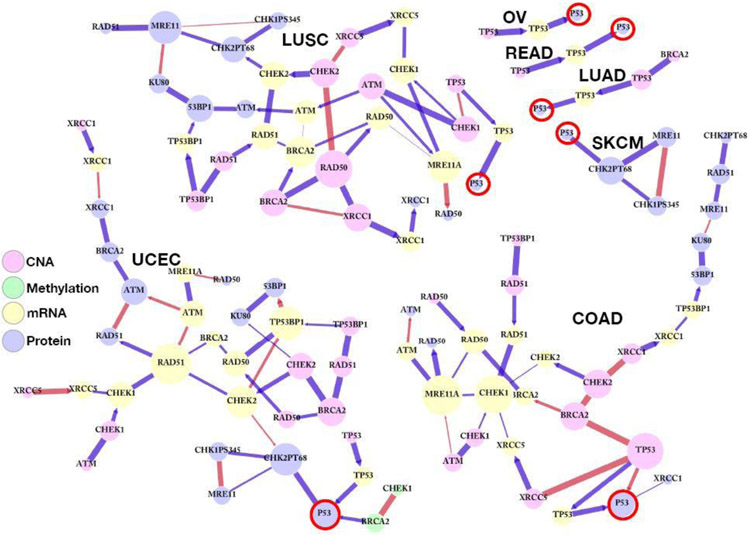
Integrative network modeling of data arising from multiple genomic platforms provides insight into the holistic picture of the interactive system, as well as the flow of information across many disease domains including cancer. The basic data structure consists of a sequence of hierarchically ordered datasets for each individual subject, which facilitates integration of diverse inputs, such as genomic, transcriptomic, and proteomic data. A primary analytical task in such contexts is to model the layered architecture of networks where the vertices can be naturally partitioned into ordered layers, dictated by multiple platforms, and exhibit both undirected and directed relationships. We propose a multi-layered Gaussian graphical model (mlGGM) to investigate conditional independence structures in such multi-level genomic networks in human cancers. We implement a Bayesian node-wise selection (BANS) approach based on variable selection techniques that coherently accounts for the multiple types of dependencies in mlGGM; this flexible strategy exploits edge-specific prior knowledge and selects sparse and interpretable models. Through simulated data generated under various scenarios, we demonstrate that BANS outperforms other existing multivariate regression-based methodologies. Our integrative genomic network analysis for key signaling pathways across multiple cancer types highlights commonalities and differences of p53 integrative networks and epigenetic effects of BRCA2 on p53 and its interaction with T68 phosphorylated CHK2, that may have translational utilities of finding biomarkers and therapeutic targets.
Keywords: Bayesian variable selection; Multi-layered Gaussian graphical models; Multi-level data integration.
Figures
References
-
- Anderson T (1984), ‘Multivariate statistical analysis’, Wiley and Sons, New York, NY.
-
- Andersson SA, Madigan D and Perlman MD (2001), ‘Alternative markov properties for chain graphs’, Scandinavian journal of statistics 28(1), 33–85.
-
- Armstrong H (2005), Bayesian estimation of decomposable Gaussian graphical models, PhD thesis, The University of New South Wales.
Grants and funding
LinkOut - more resources
Full Text Sources
Research Materials
Miscellaneous