

Altered profiles of fecal bile acids correlate with gut microbiota and inflammatory responses in patients with ulcerative colitis
- PMID: 34239273
- PMCID: PMC8240054
- DOI: 10.3748/wjg.v27.i24.3609
Altered profiles of fecal bile acids correlate with gut microbiota and inflammatory responses in patients with ulcerative colitis
Abstract
Background: Gut microbiota and its metabolites may be involved in the pathogenesis of inflammatory bowel disease. Several clinical studies have recently shown that patients with ulcerative colitis (UC) have altered profiles of fecal bile acids (BAs). It was observed that BA receptors Takeda G-protein-coupled receptor 5 (TGR5) and vitamin D receptor (VDR) participate in intestinal inflammatory responses by regulating NF-ĸB signaling. We hypothesized that altered profiles of fecal BAs might be correlated with gut microbiota and inflammatory responses in patients with UC.
Aim: To investigate the changes in fecal BAs and analyze the relationship of BAs with gut microbiota and inflammation in patients with UC.
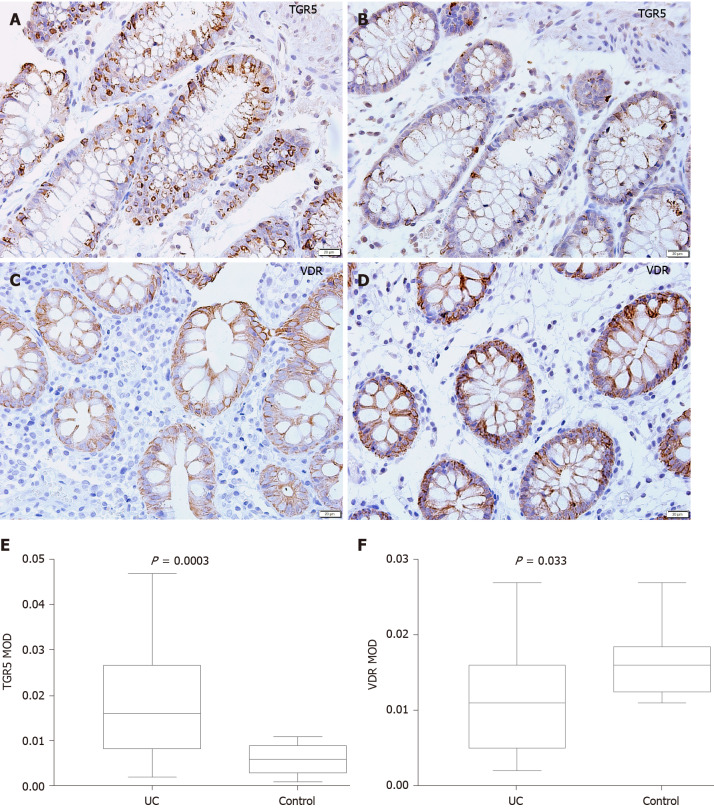
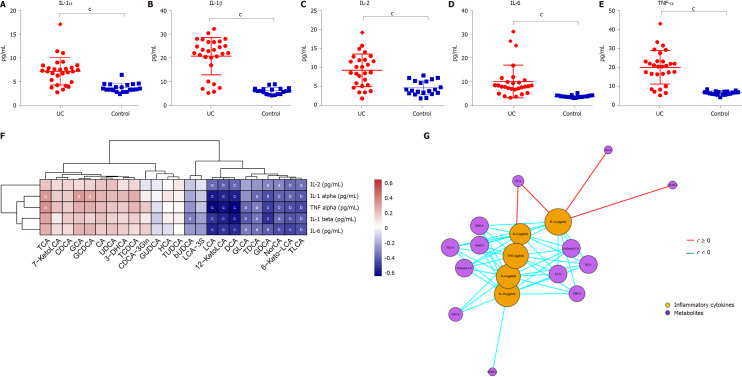
Methods: The present study used 16S rDNA sequencing technology to detect the differences in the intestinal flora between UC patients and healthy controls (HCs). Fecal BAs were measured by targeted metabolomics approaches. Mucosal TGR5 and VDR expression was analyzed using immunohistochemistry, and serum inflammatory cytokine levels were detected by ELISA.
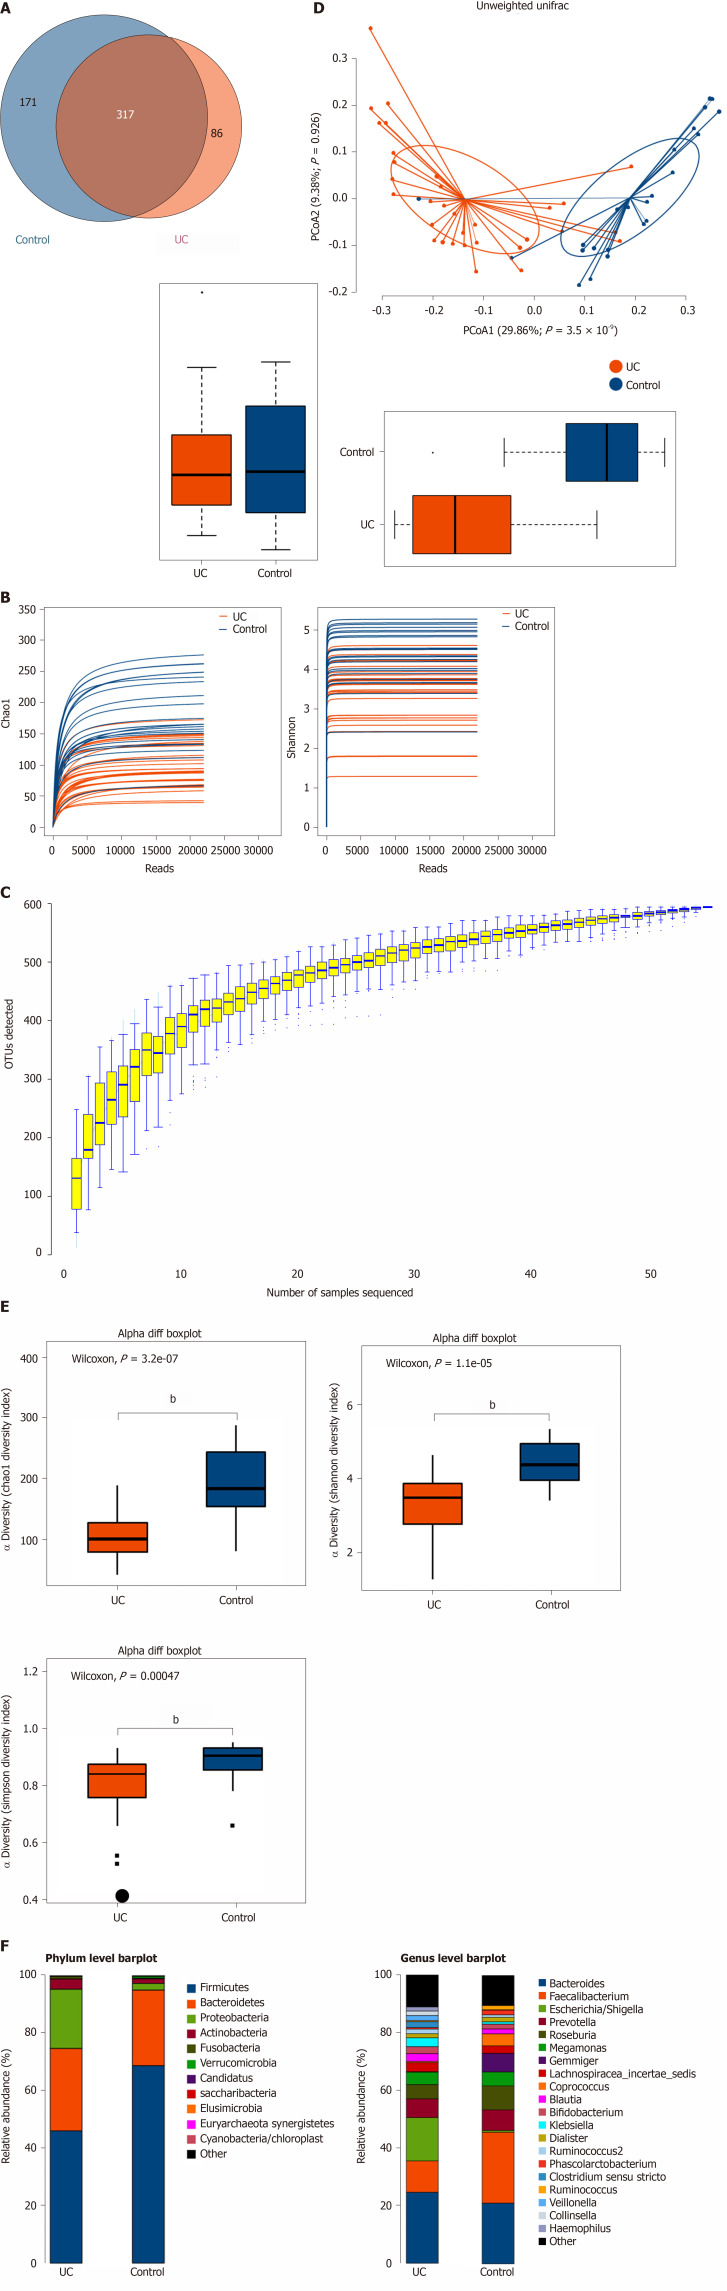
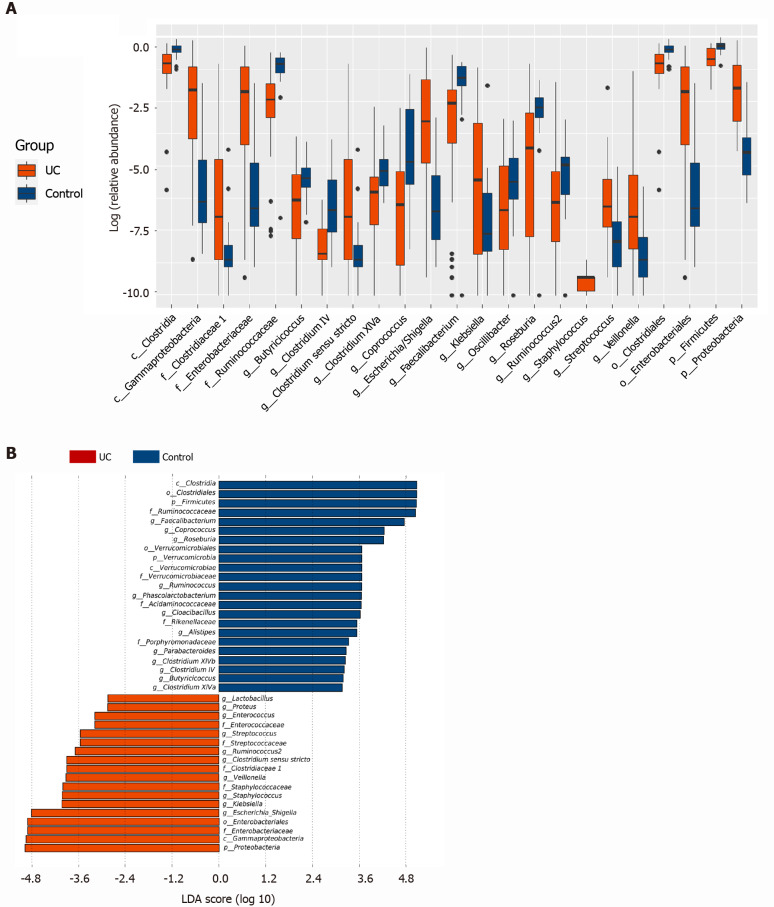
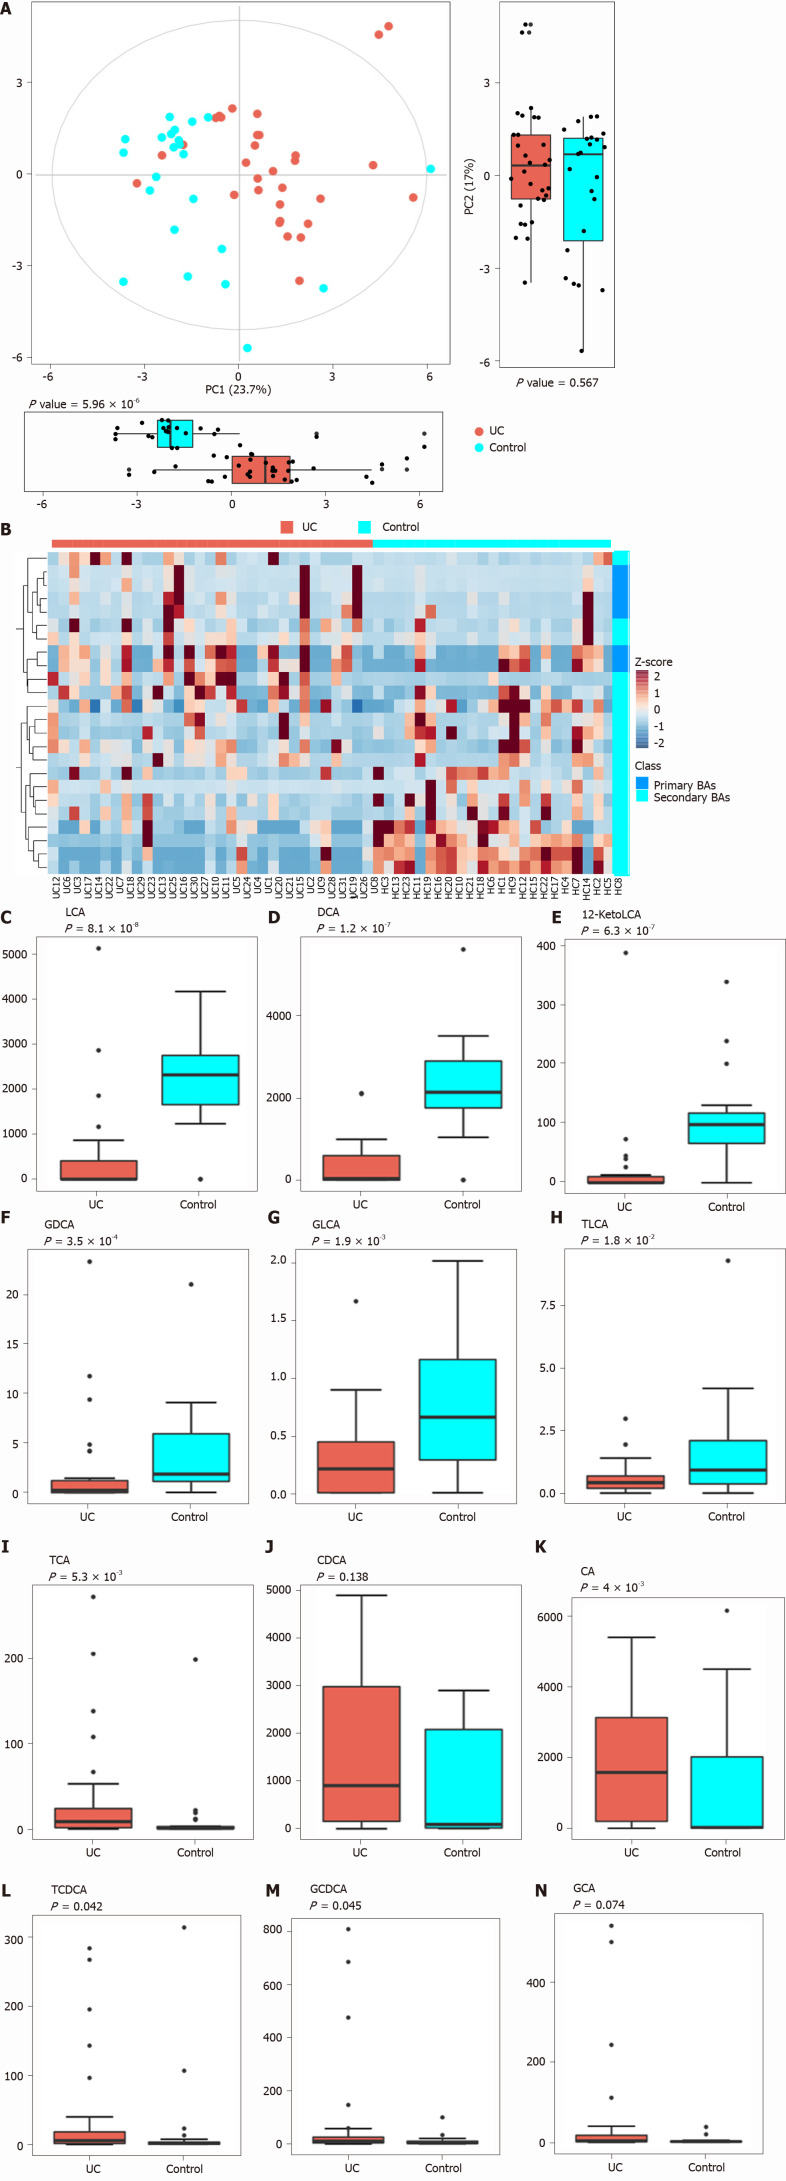
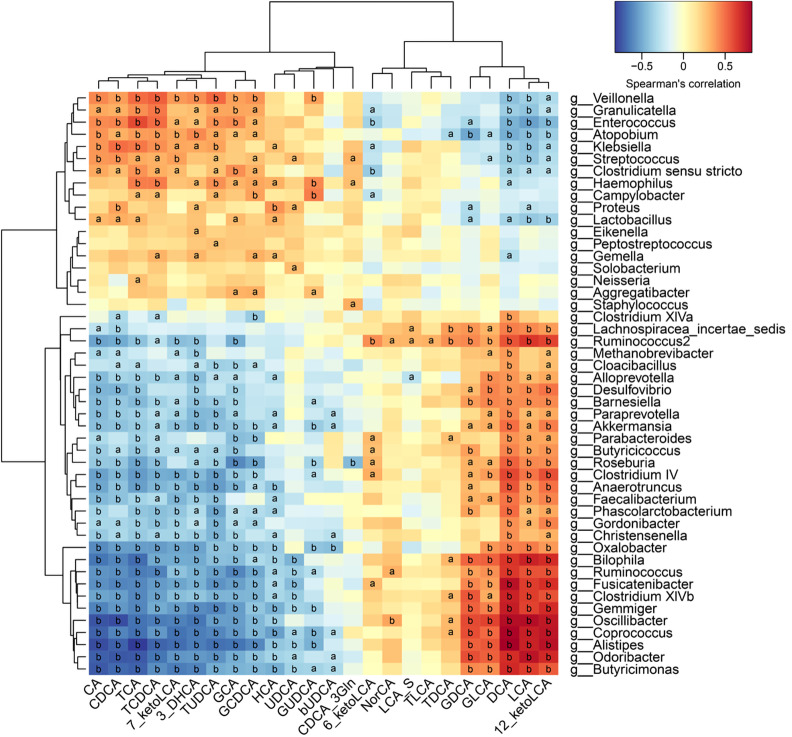
Results: Thirty-two UC patients and twenty-three HCs were enrolled in this study. It was found that the diversity of gut microbiota in UC patients was reduced compared with that in HCs. Firmicutes, Clostridium IV, Butyricicoccus, Clostridium XlVa, Faecalibacterium, and Roseburia were significantly decreased in patients with UC (P = 3.75E-05, P = 8.28E-07, P = 0.0002, P = 0.003, P = 0.0003, and P = 0.0004, respectively). Proteobacteria, Escherichia, Enterococcus, Klebsiella, and Streptococcus were significantly enriched in the UC group (P = 2.99E-09, P = 3.63E-05, P = 8.59E-05, P = 0.003, and P = 0.016, respectively). The concentrations of fecal secondary BAs, such as lithocholic acid, deoxycholic acid, glycodeoxycholic acid, glycolithocholic acid, and taurolithocholate, in UC patients were significantly lower than those in HCs (P = 8.1E-08, P = 1.2E-07, P = 3.5E-04, P = 1.9E-03, and P = 1.8E-02, respectively) and were positively correlated with Butyricicoccus, Roseburia, Clostridium IV, Faecalibacterium, and Clostridium XlVb (P < 0.01). The concentrations of primary BAs, such as taurocholic acid, cholic acid, taurochenodeoxycholate, and glycochenodeoxycholate, in UC patients were significantly higher than those in HCs (P = 5.3E-03, P = 4E-02, P = 0.042, and P = 0.045, respectively) and were positively related to Enterococcus, Klebsiella, Streptococcus, Lactobacillus, and pro-inflammatory cytokines (P < 0.01). The expression of TGR5 was significantly elevated in UC patients (0.019 ± 0.013 vs 0.006 ± 0.003, P = 0.0003). VDR expression in colonic mucosal specimens was significantly decreased in UC patients (0.011 ± 0.007 vs 0.016 ± 0.004, P = 0.033).
Conclusion: Fecal BA profiles are closely related to the gut microbiota and serum inflammatory cytokines. Dysregulation of the gut microbiota and altered constitution of fecal BAs may participate in regulating inflammatory responses via the BA receptors TGR5 and VDR.
Keywords: Bile acids; Gut microbiota; Takeda G-protein-coupled receptor 5; Ulcerative colitis; Vitamin D receptor.
©The Author(s) 2020. Published by Baishideng Publishing Group Inc. All rights reserved.
Conflict of interest statement
Conflict-of-interest statement: All authors report no conflicts of interest.
Figures
Similar articles
-
Altered metabolism of bile acids correlates with clinical parameters and the gut microbiota in patients with diarrhea-predominant irritable bowel syndrome.World J Gastroenterol. 2020 Dec 7;26(45):7153-7172. doi: 10.3748/wjg.v26.i45.7153. World J Gastroenterol. 2020. PMID: 33362374 Free PMC article.
-
Baitouweng Tang ameliorates DSS-induced ulcerative colitis through the regulation of the gut microbiota and bile acids via pathways involving FXR and TGR5.Biomed Pharmacother. 2021 May;137:111320. doi: 10.1016/j.biopha.2021.111320. Epub 2021 Feb 9. Biomed Pharmacother. 2021. PMID: 33578232
-
Dihydromyricetin improves DSS-induced colitis in mice via modulation of fecal-bacteria-related bile acid metabolism.Pharmacol Res. 2021 Sep;171:105767. doi: 10.1016/j.phrs.2021.105767. Epub 2021 Jul 14. Pharmacol Res. 2021. PMID: 34273490
-
Targeting Bile-Acid Metabolism: Nutritional and Microbial Approaches to Alleviate Ulcerative Colitis.Nutrients. 2025 Mar 28;17(7):1174. doi: 10.3390/nu17071174. Nutrients. 2025. PMID: 40218932 Free PMC article. Review.
-
Bile Acid and Gut Microbiota in Irritable Bowel Syndrome.J Neurogastroenterol Motil. 2022 Oct 30;28(4):549-561. doi: 10.5056/jnm22129. J Neurogastroenterol Motil. 2022. PMID: 36250362 Free PMC article. Review.
Cited by
-
The involvement of oral bacteria in inflammatory bowel disease.Gastroenterol Rep (Oxf). 2024 Aug 26;12:goae076. doi: 10.1093/gastro/goae076. eCollection 2024. Gastroenterol Rep (Oxf). 2024. PMID: 39188957 Free PMC article. Review.
-
Paeonol Ameliorates Ulcerative Colitis in Mice by Modulating the Gut Microbiota and Metabolites.Metabolites. 2022 Oct 8;12(10):956. doi: 10.3390/metabo12100956. Metabolites. 2022. PMID: 36295858 Free PMC article.
-
Untangling the oral-gut axis in the pathogenesis of intestinal inflammation.Int Immunol. 2022 Sep 6;34(9):485-490. doi: 10.1093/intimm/dxac027. Int Immunol. 2022. PMID: 35716367 Free PMC article. Review.
-
Composition of Human-Associated Gut Microbiota Determines 3-DF and 3-HF Anti-Colitic Activity in IL-10 -/- Mice.Nutrients. 2024 Dec 7;16(23):4232. doi: 10.3390/nu16234232. Nutrients. 2024. PMID: 39683625 Free PMC article.
-
The role of gut microbiota and plasma metabolites in ulcerative colitis: Insights from Mendelian randomization analysis.Medicine (Baltimore). 2025 Feb 28;104(9):e41710. doi: 10.1097/MD.0000000000041710. Medicine (Baltimore). 2025. PMID: 40020117 Free PMC article.
References
-
- Ng SC, Shi HY, Hamidi N, Underwood FE, Tang W, Benchimol EI, Panaccione R, Ghosh S, Wu JCY, Chan FKL, Sung JJY, Kaplan GG. Worldwide incidence and prevalence of inflammatory bowel disease in the 21st century: a systematic review of population-based studies. Lancet. 2017;390:2769–2778. - PubMed
-
- Kaplan GG, Ng SC. Understanding and Preventing the Global Increase of Inflammatory Bowel Disease. Gastroenterology 2017; 152: 313-321. :e2. - PubMed
-
- D'Haens GR, Sartor RB, Silverberg MS, Petersson J, Rutgeerts P. Future directions in inflammatory bowel disease management. J Crohns Colitis. 2014;8:726–734. - PubMed
-
- Nikfar S, Rahimi R, Rezaie A, Abdollahi M. A meta-analysis of the efficacy of sulfasalazine in comparison with 5-aminosalicylates in the induction of improvement and maintenance of remission in patients with ulcerative colitis. Dig Dis Sci. 2009;54:1157–1170. - PubMed
-
- De Cassan C, Fiorino G, Danese S. Second-generation corticosteroids for the treatment of Crohn's disease and ulcerative colitis: more effective and less side effects? Dig Dis. 2012;30:368–375. - PubMed
MeSH terms
Substances
LinkOut - more resources
Full Text Sources
Other Literature Sources
Medical
