. 2021 Jun 18:2021:5551036.
doi: 10.1155/2021/5551036. eCollection 2021.

Pan-Cancer Analysis of the Prognostic and Immunological Role of HSF1: A Potential Target for Survival and Immunotherapy

Affiliations

Pan-Cancer Analysis of the Prognostic and Immunological Role of HSF1: A Potential Target for Survival and Immunotherapy

Fei Chen et al. Oxid Med Cell Longev. .

Abstract

Emerging evidence revealed the significant roles of heat shock factor 1 (HSF1) in cancer initiation, development, and progression, but there is no pan-cancer analysis of HSF1. The present study first comprehensively investigated the expression profiles and prognostic significance of HSF1 and the relationship of HSF1 with clinicopathological parameters and immune cell infiltration using bioinformatic techniques. HSF1 is significantly upregulated in various common cancers, and it is associated with prognosis. Pan-cancer Cox regression analysis indicated that the high expression of HSF1 was associated with poor overall survival (OS), disease-specific survival (DSS), and progression-free interval (PFI) in cervical squamous cell carcinoma and endocervical adenocarcinoma (CESC), head and neck squamous cell carcinoma (HNSC), and kidney renal papillary cell carcinoma (KIRP) patients. The methylation of HSF1 DNA was decreased in most cancers and negatively correlated with the HSF1 expression. Increased phosphorylation of S303, S307, and S363 in HSF1 was observed in some cancers. HSF1 remarkably correlated with the levels of infiltrating cells and immune checkpoint genes. Our pan-cancer analysis provides a deep understanding of the functions of HSF1 in oncogenesis and metastasis in different cancers.


Conflict of interest statement

The authors declare no conflicts.

Figures
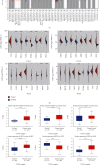
Figure 1
Figure 1
Upregulated mRNA expression of HSF1 in pan-cancer. (a) The results from the TIMER database indicated that the HSF1 expression was remarkably increased in 16 cancer types. The red and blue boxes represent tumor tissues and normal tissues, respectively. (b) The expression level of HSF1 in different cancer types from TCGA. (c) The HSF1 protein expression level in normal tissues and primary tissues of breast cancer, ovarian cancer, colon cancer, clear cell RCC, and UCEC was examined using the CPTAC dataset. p < 0.05, ∗∗p < 0.01, and ∗∗∗p < 0.001.
Figure 2
Figure 2
Correlations between the HSF1 expression and the main pathological stages, including stage I, stage II, stage III, and stage IV of ACC, BLCA, BRCA, CHOL, COAD, ESCA, HNSC, KICH, KIRC, KIRP, LIHC, LUAD, LUSC, MESO, PAAD, READ, SKCM and UVM, were investigated based on the TCGA data. Log2 (TPM+1) was used for log scale. p < 0.05, ∗∗p < 0.01, and ∗∗∗p < 0.001.
Figure 3
Figure 3
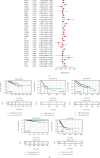
Association between the HSF1 expression and the OS of cancer patients. (a) A forest plot of hazard ratios of HSF1 in 33 types of tumors. (b) Kaplan-Meier survival curves of OS for patients stratified by the different expressions of HSF1 in LAML, LUAD, LIHC, KIRP, and THCA.
Figure 4
Figure 4
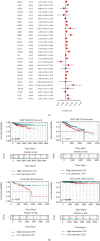
Association between the HSF1 expression and DSS in cancer patients. (a) A forest plot of hazard ratios of HSF1 in 33 types of tumors. (b) Kaplan-Meier survival curves of DSS for patients stratified by the different expressions of HSF1 in LIHC, KIRP, THCA, and UVM.
Figure 5
Figure 5
DNA methylation and mutation features of HSF1 in pan-cancer. (a) Promoter methylation level of HSF1 in pan-cancer. The results were obtained from the UALCAN database. (b) The alteration frequency with different types of mutations was examined using the cBioPortal database. (c) The effect of HSF1 mutation status on overall, disease-specific, disease-free, and progression-free survival of cancer patients was investigated using the cBioPortal database. p < 0.05, ∗∗p < 0.01, and ∗∗∗p < 0.001.
Figure 6
Figure 6
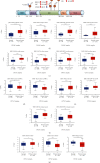
Phosphorylation of HSF1 in several selected cancers according to the CPTAC database. (a) The schematic diagram and phosphorylation sites of the HSF1 protein are shown. The phosphorylation of HSF1 at S303, S307, S303/S307, S363, S121, and T323 was analyzed in breast cancer (b), colon cancer (c), clear cell RCC (d), LUAD (e), ovarian cancer (f), and UCEC (g). The results were obtained from the UALCAN database. p < 0.05, ∗∗p < 0.01, and ∗∗∗p < 0.001.
Figure 7
Figure 7
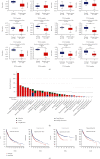
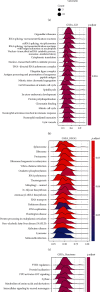
Merged enrichment plots for HSF1 obtained from KEGG and GSEA. (a) Top 20 pathways enriched in the KEGG analysis in COAD. (b)–(d) Merged plots of GSEA indicating the signaling pathways associated with HSF1 expression according to GO, KEGG, and Reactome analyses in COAD.
Figure 8
Figure 8
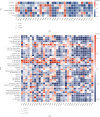
The HSF1 expression correlated with immune infiltration. (a) The HSF1 expression significantly correlated with the infiltration levels of various immune cells in the TIMER database. (b) The HSF1 expression significantly correlated with the infiltration levels of various immune cells based on xCell. p < 0.05, ∗∗p < 0.01, and ∗∗∗p < 0.001.
Figure 9
Figure 9
Correlation analyses of the HSF1 expression with immune checkpoint genes in pan-cancer. p < 0.05, ∗∗p < 0.01, ∗∗∗p < 0.001, and ∗∗∗∗p < 0.0001.
Figure 10
Figure 10
Correlation between the HSF1 gene expression and TMB and MSI in pan-cancer. (a) A stick chart shows the relationship between the HSF1 gene expression and TMB in diverse tumors. The red curve represents the correlation coefficient, and the blue value represents the range. (b) A stick chart shows the association between the HSF1 gene expression and MSI in diverse tumors. (d) Relationship between the HSF1 gene expression and TMB in pan-cancer. Correlation analysis was performed using Spearman's method.

References

    1. Sung H., Ferlay J., Siegel R. L., et al. Global cancer statistics 2020: GLOBOCAN estimates of incidence and mortality worldwide for 36 cancers in 185 countries. CA: a Cancer Journal for Clinicians. 2021;71(3):209–249. doi: 10.3322/caac.21660. - DOI - PubMed
    1. Siegel R. L., Miller K. D., Jemal A. Cancer statistics, 2019. CA: a Cancer Journal for Clinicians. 2019;69(1):7–34. doi: 10.3322/caac.21551. - DOI - PubMed
    1. Liu B., Fan Y., Song Z., et al. Identification of DRP1 as a prognostic factor correlated with immune infiltration in breast cancer. International Immunopharmacology. 2020;89(Part B):p. 107078. doi: 10.1016/j.intimp.2020.107078. - DOI - PubMed
    1. Jeggo P. A., Pearl L. H., Carr A. M. DNA repair, genome stability and cancer: a historical perspective. Nature Reviews Cancer. 2016;16(1):35–42. doi: 10.1038/nrc.2015.4. - DOI - PubMed
    1. Chatterjee A., Rodger E. J., Eccles M. R. Epigenetic drivers of tumourigenesis and cancer metastasis. Seminars in Cancer Biology. 2018;51:149–159. doi: 10.1016/j.semcancer.2017.08.004. - DOI - PubMed

Substances

LinkOut - more resources