. 2021 Jun 17:2021:5584447.
doi: 10.1155/2021/5584447. eCollection 2021.

Autophagic Degradation of Gasdermin D Protects against Nucleus Pulposus Cell Pyroptosis and Retards Intervertebral Disc Degeneration In Vivo

Affiliations

Autophagic Degradation of Gasdermin D Protects against Nucleus Pulposus Cell Pyroptosis and Retards Intervertebral Disc Degeneration In Vivo

Zhiwei Liao et al. Oxid Med Cell Longev. .

Abstract

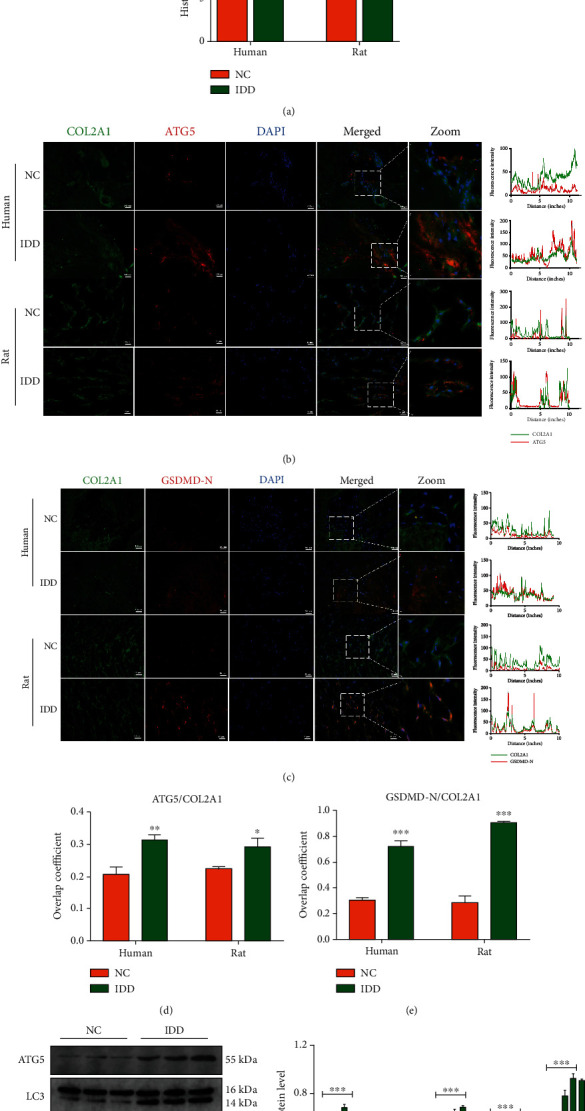
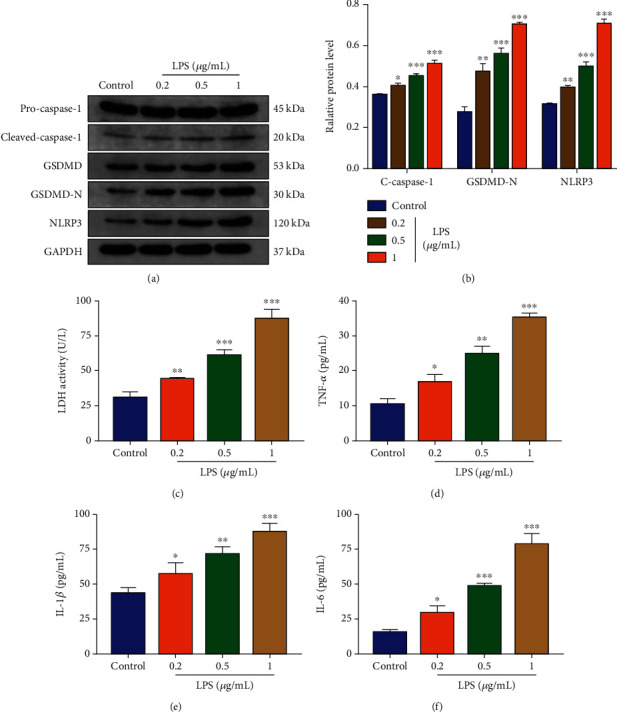
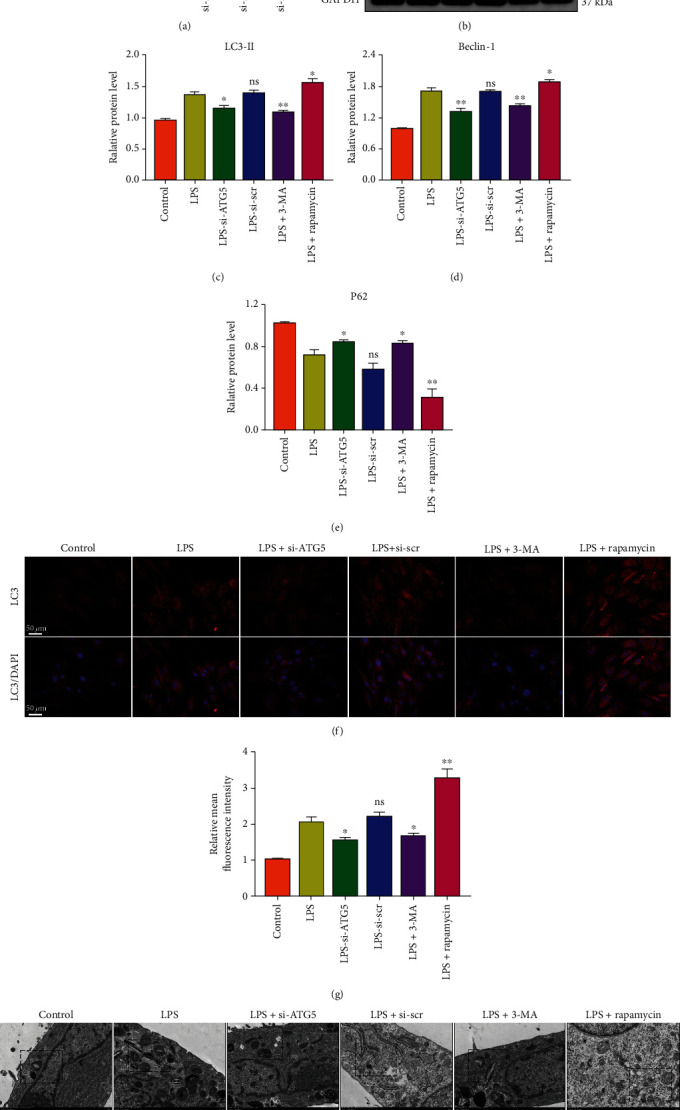
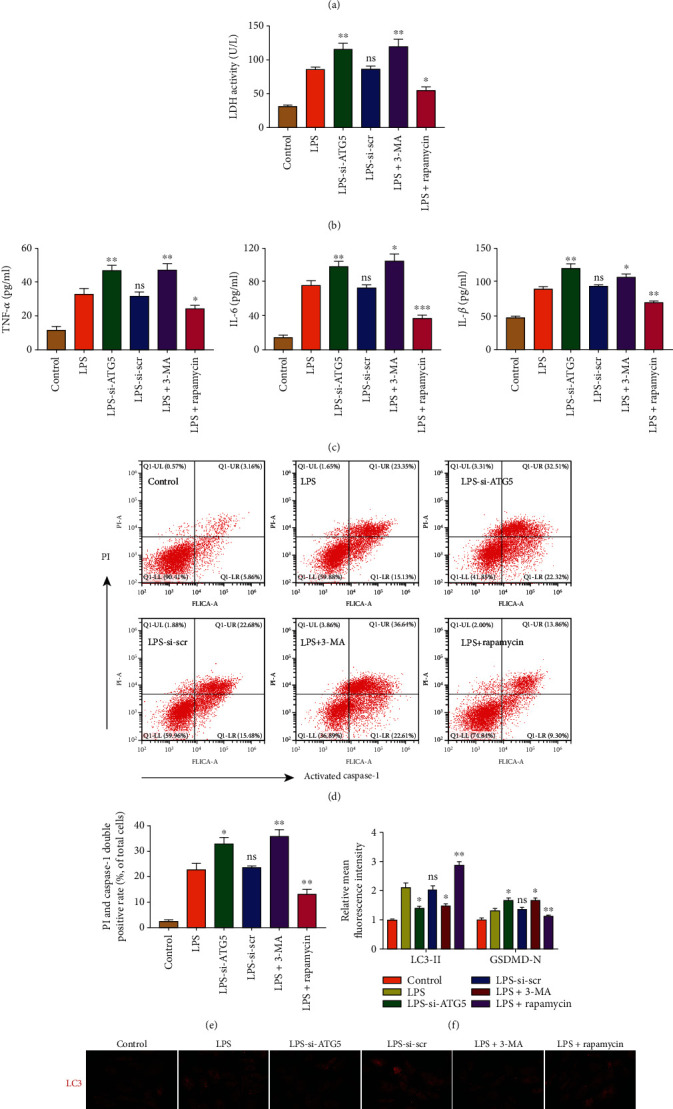
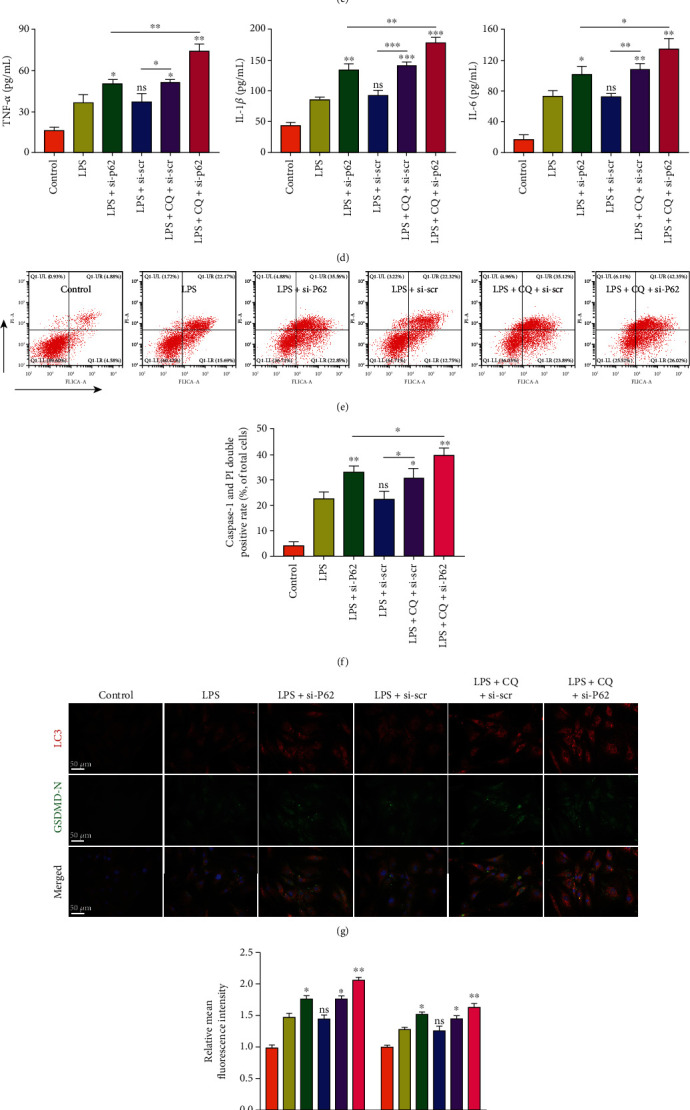
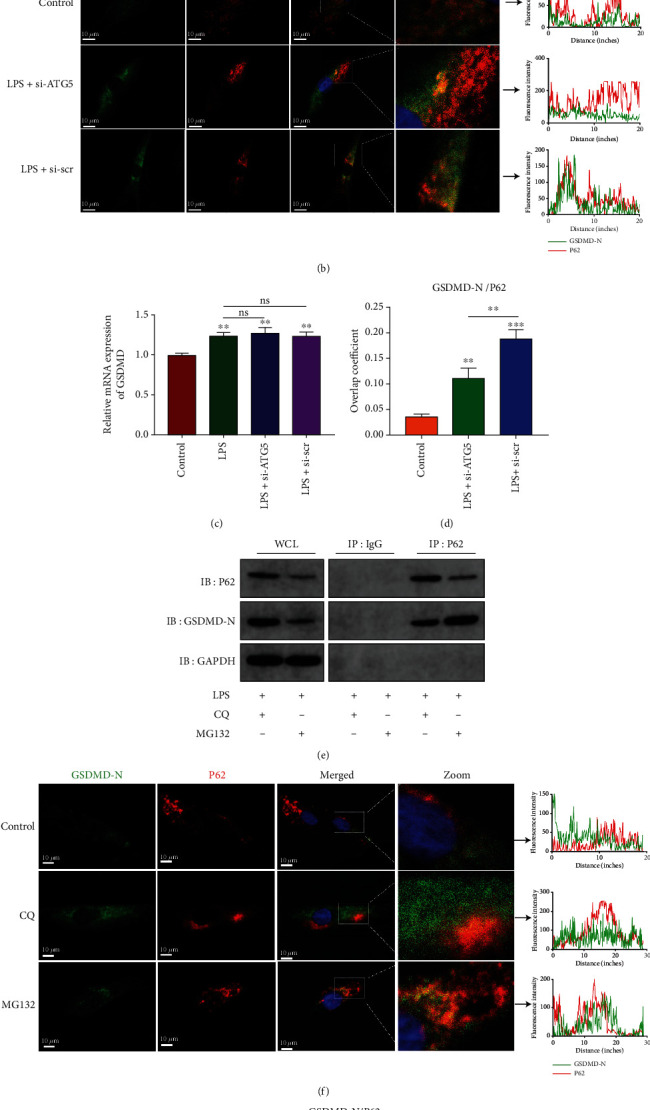
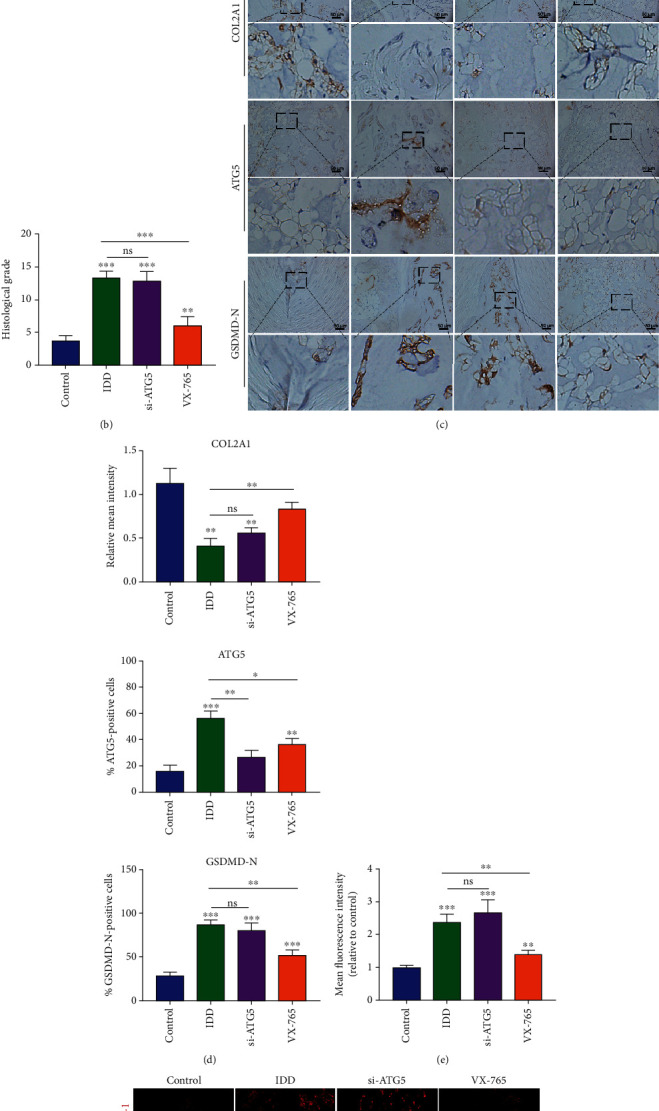
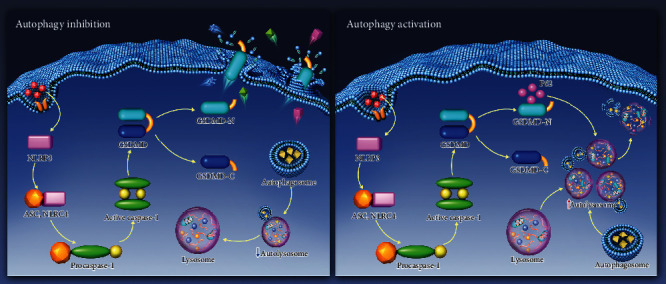
Intervertebral disc degeneration (IDD) is the primary culprit of low back pain and renders heavy social burden worldwide. Pyroptosis is a newly discovered form of programmed cell death, which is also involved in nucleus pulposus (NP) cells during IDD progression. Moderate autophagy activity is critical for NP cell survival, but its relationship with pyroptosis remains unknown. This study is aimed at investigating the relationship between autophagy and pyroptotic cell death. The pyroptosis executor N-terminal domain of gasdermin D (GSDMD-N) and inflammation-related proteins were measured in lipopolysaccharide- (LPS-) treated human NP cells. Inhibition of autophagy by siRNA transfection and chemical drugs aggravated human NP cell pyroptosis. Importantly, we found that the autophagy-lysosome pathway and not the proteasome pathway mediated the degradation of GSDMD-N as lysosome dysfunction promoted the accumulation of cytoplasmic GSDMD-N. Besides, P62/SQSTM1 colocalized with GSDMD-N and mediated its degradation. The administration of the caspase-1 inhibitor VX-765 could reduce cell pyroptosis as confirmed in a rat disc IDD model in vivo, whereas ATG5 knockdown significantly accelerated the progression of IDD. In conclusion, our study indicated that autophagy protects against LPS-induced human NP cell pyroptosis via a P62/SQSTM1-mediated degradation mechanism and the inhibition of pyroptosis retards IDD progression in vivo. These findings deepen the understanding of IDD pathogenesis and hold implications in unraveling therapeutic targets for IDD treatment.


Conflict of interest statement

The authors declare no conflict of interest.

Figures

Figure 1
Figure 1
Histological staining results of human and rat intervertebral discs. (a) HE staining showed the morphology of rat discs and human NP tissues (upper panel), and histological grades were calculated based on HE staining (lower panel). (b) Immunofluorescence analysis of ATG5 (red) and type collagen II (green) in rat and human NP tissues. Corresponding fluorescence intensity analysis is listed in the right panel. Scale bar, 50 μm. (c) Immunofluorescence analysis of GSDMD-N (red) and type collagen II (green) in rat and human NP tissues (left panel) and fluorescence intensity results (right panel). Overlap coefficient based on immunofluorescence results showed the colocalization relationship of (d) ATG5 and COL2A1 or (e) GSDMD-N and COL2A1. (f) Western blot analysis of ATG5, LC3, GSDMD-N, COL2A1, and MMP3 in human nondegenerative and degenerative NP tissues and (g) corresponding quantification of protein levels. NC: nondegenerative discs; IDD: degenerative discs. GAPDH was used as an internal control. Data were presented as the means ± SD, n = 3. P < 0.05, ∗∗P < 0.01, and ∗∗∗P < 0.001 vs. the NC group.
Figure 2
Figure 2
LPS induced NP cell pyroptosis in vitro in a dose-dependent manner. (a) Western blot analysis of pro-caspase-1, cleaved caspase-1, GSDMD, GSDMD-N, and NLRP3 in NP cells treated with LPS (0.2 μg/mL, 0.5 μg/mL, and 1 μg/mL) for 24 h. The control group was treated with equivalent solvent. (b) Quantification of cleaved caspase-1, GSDMD-N, and NLRP3 protein levels. GAPDH was used as an internal control. (c) Measurement of LDH activity in LPS-treated NP cells. ELISA analyzed the levels of secreted (d) TNF-α, (e) IL-1β, and (f) IL-6 in LPS-treated NP cells. Data were presented as the means ± SD, n = 3. P < 0.05, ∗∗P < 0.01, and ∗∗∗P < 0.001 vs. the control group.
Figure 3
Figure 3
Detection of autophagy activity in NP cells in vitro. (a) The mRNA level of ATG5 in ATG5 siRNA-treated NP cells was analyzed by qRT-PCR. si-ATG5-1 was used in the following experiments. ∗∗∗P < 0.001 vs. the control group; ns, P > 0.05, no significant difference. (b) Western blot analysis of LC3, Beclin-1, and P62. LPS-treated (1 μg/mL, 24 h) NP cells were cotreated with 3-MA (10 mM, 24 h) or rapamycin (1 μM, 24 h). Quantification of (c) LC3-II, (d) Beclin-1, and (e) P62 protein levels. GAPDH was used as an internal control. (f) Immunofluorescence analysis showed the expression level of LC3 and (g) relative mean fluorescence was calculated. Data were presented as the means ± SD, n = 3. P < 0.05 and ∗∗P < 0.01 vs. the LPS group; ns, P > 0.05, no significant difference. (h) TEM images of NP cells indicated the number and morphology of autophagosomes (red arrowheads).
Figure 4
Figure 4
Impaired autophagy activity aggravated LPS-induced NP cell pyroptosis in vitro. (a) Western blot analysis and quantification of NLRP3, cleaved caspase-1, and GSDMD-N protein levels. GAPDH was used as an internal control. (b) Measurement of extracellular LDH activity in NP cells. (c) ELISA analysis assessed the levels of secreted TNF-α, IL-1β, and IL-6. (d) Flow cytometry analyzed the pyroptotic cells, which were double positive of activated caspase-1 and PI. (e) The rate of double-positive cells was calculated. (g) Double immunofluorescence analysis showed the expression level of LC3 (red) and GSDMD-N (green). Scale bar, 50 μm. (f) The relative mean fluorescence in each group was calculated. Data were presented as the means ± SD, n = 3. P < 0.05, ∗∗P < 0.01, and ∗∗∗P < 0.001 vs. the corresponding LPS group; ns, P > 0.05, no significant difference.
Figure 5
Figure 5
Dysfunction of the autophagy-lysosome pathway promoted the accumulation of cytoplasmic GSDMD-N. (a) The mRNA level of P62 was analyzed by qRT-PCR, and si-P62-3 was selected in the following experiments. ∗∗P < 0.01 and ∗∗∗P < 0.001 vs. the control group; ns, P > 0.05, no significant difference. (b) Western blot analysis and quantification of P62, NLRP3, cleaved caspase-1, and GSDMD-N. (c) Measurement of extracellular LDH activity. (d) ELISA analyzed the levels of secreted TNF-α, IL-1β, and IL-6. (e) Flow cytometry analyzed the double-positive cell of activated caspase-1 and PI and (f) calculated the rate of double-positive cells. (g) Immunofluorescence analysis of LC3 (red) and GSDMD-N (green) and (h) the relative mean fluorescence in each group was calculated. (i) Immunofluorescence analysis of P62 (red) and GSDMD-N (green) and (j) the relative mean fluorescence in each group was calculated. Scale bar, 50 μm. Data were presented as the means ± SD, n = 3. P < 0.05, ∗∗P < 0.01, and ∗∗∗P < 0.001 vs. the corresponding LPS group; ns, P > 0.05, no significant difference.
Figure 6
Figure 6
P62 mediated GSDMD-N degradation via an autophagy-lysosome pathway. (a) Immunoprecipitation for P62 was conducted to detect the integration of P62 and GSDMD-N. IgG was as a negative control. WCL: whole cell lysate. (b) Confocal images of GSDMD-N (green) and P62 (red) and fluorescence intensity results (right panel). (c) The mRNA level of GSDMD was analyzed by qRT-PCR. ∗∗P < 0.01 vs. the control group; ns, P > 0.05, no significant difference. (d) Overlap coefficient based on immunofluorescence images showed the colocalization relationship of GSDMD-N and P62. ∗∗P < 0.01 and ∗∗∗P < 0.001 vs. the control group. (e) Immunoprecipitation for P62 was conducted to detect the integration of P62 and GSDMD-N in CQ (20 μM, 24 h) or MG132 (10 μM, 24 h) treated NP cells under LPS stimulation. (f) Confocal images of GSDMD-N (green) and P62 (red) and fluorescence intensity measurement (right panel). (g) Overlap coefficient analyzed the colocalization of GSDMD-N and P62. ∗∗P < 0.01 vs. the CQ group. Data were presented as the means ± SD, n = 3.
Figure 7
Figure 7
Administration of VX-765 ameliorated the progression of IDD in vivo. (a) Histological staining, including HE, Alcian blue, and Masson staining, showed the morphology of rat intervertebral disc. The IDD, si-ATG5, and VX-765 groups were treated with needle puncture, while the control group is an untreated group. (b) Histological grades were calculated based on the histological staining results. (c) Immunohistochemistry staining for COL2A1, ATG5, and GSDMD-N was conducted to evaluate the expression level of proteins in tissues. (d) Quantification of COL2A1, ATG5, and GSDMD-N in immunohistochemistry staining. (f) Immunofluorescence staining of caspase-1 and (e) quantification results of the caspase-1 mean fluorescence intensity. ∗∗P < 0.01 and ∗∗∗P < 0.001 vs. the control group; ns, P > 0.05, no significant difference. Data were presented as the means ± SD, n = 5.
Figure 8
Figure 8
Schematic model illustrating the autophagy regulative mechanism of GSDMD-mediated pyroptosis. Autophagy inhibition promotes the accumulation of cytoplasmic GSDMD-N and elicits cell membrane perforation (a). Upon autophagy activation, P62 mediates the degradation of GSDMD-N in autolysosome and reduces the cell pyroptosis (b). NLRP3: NLR family PYRIN domain-containing 3; ASC: apoptosis-associated speck-like protein containing a CARD; NLRC4: NLR family CARD domain-containing protein 4; GSDMD: gasdermin D; GSDMD-N: N-terminal of gasdermin D; GSDMD-C: C-terminal of gasdermin D; P62: SQSTM1/sequestosome 1.

Similar articles

Cited by

References

    1. Kerr G. J., Veras M. A., Kim M. K., Séguin C. A. Decoding the intervertebral disc: unravelling the complexities of cell phenotypes and pathways associated with degeneration and mechanotransduction. Seminars in Cell & Developmental Biology. 2017;62:94–103. doi: 10.1016/j.semcdb.2016.05.008. - DOI - PubMed
    1. Cunha C., Silva A. J., Pereira P., Vaz R., Gonçalves R. M., Barbosa M. A. The inflammatory response in the regression of lumbar disc herniation. Arthritis Research & Therapy. 2018;20(1):p. 251. doi: 10.1186/s13075-018-1743-4. - DOI - PMC - PubMed
    1. Johnson Z. I., Schoepflin Z. R., Choi H., Shapiro I. M., Risbud M. V. Disc in flames: roles of TNF-α and IL-1β in intervertebral disc degeneration. European Cells & Materials. 2015;30:104–117. doi: 10.22203/eCM.v030a08. - DOI - PMC - PubMed
    1. Tendulkar G., Chen T., Ehnert S., Kaps H. P., Nüssler A. K. Intervertebral disc nucleus repair: hype or hope? International Journal of Molecular Sciences. 2019;20(15):p. 3622. doi: 10.3390/ijms20153622. - DOI - PMC - PubMed
    1. Vande Walle L., Lamkanfi M. Pyroptosis. Current Biology. 2016;26(13):R568–R572. doi: 10.1016/j.cub.2016.02.019. - DOI - PubMed

Substances

LinkOut - more resources