Observational Study
. 2021 Dec 16;144(11):3492-3504.
doi: 10.1093/brain/awab255.

Metabolic derangements are associated with impaired glucose delivery following traumatic brain injury

Affiliations
Observational Study

Metabolic derangements are associated with impaired glucose delivery following traumatic brain injury

Jeroen Hermanides et al. Brain. .

Abstract

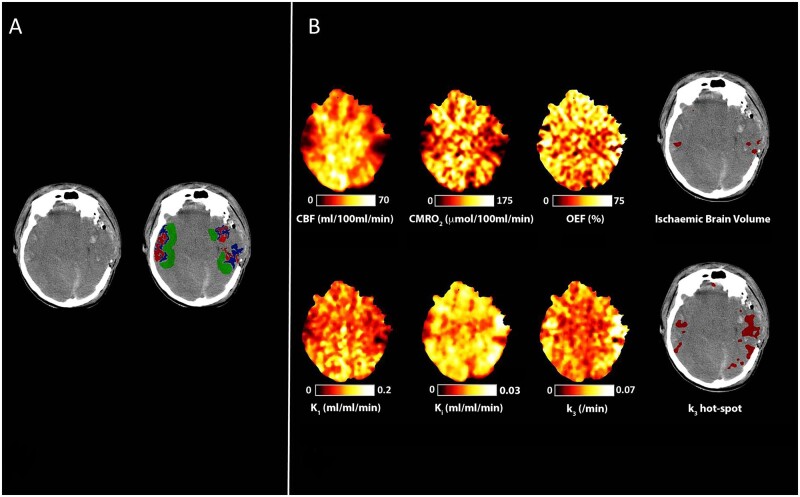
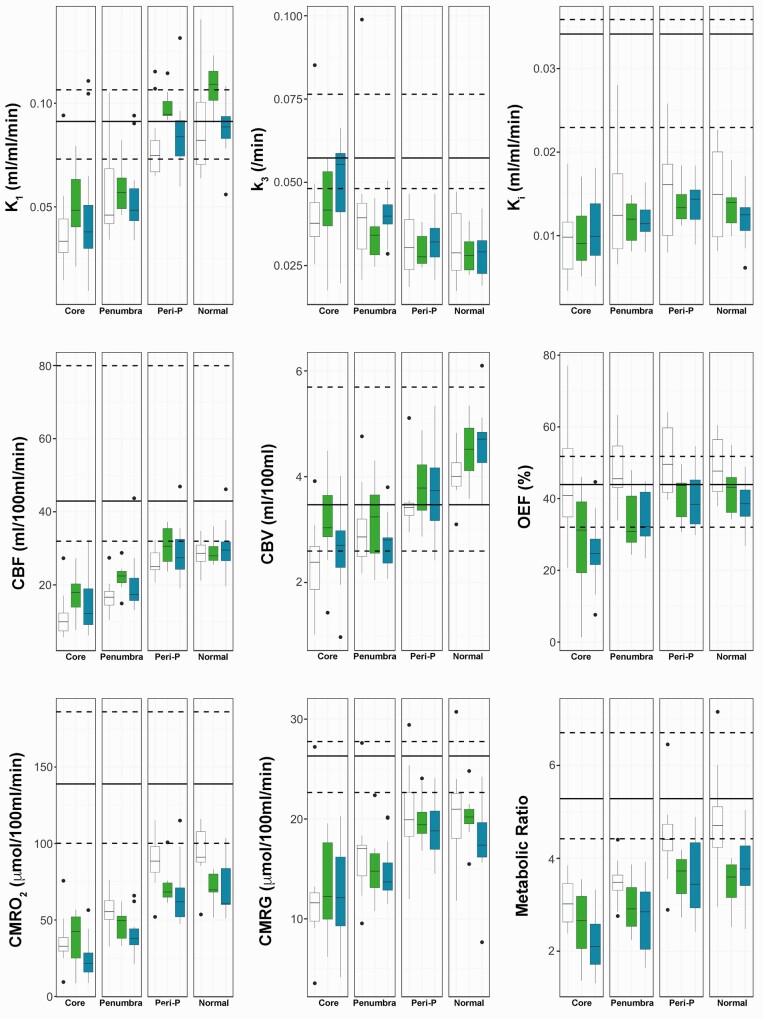
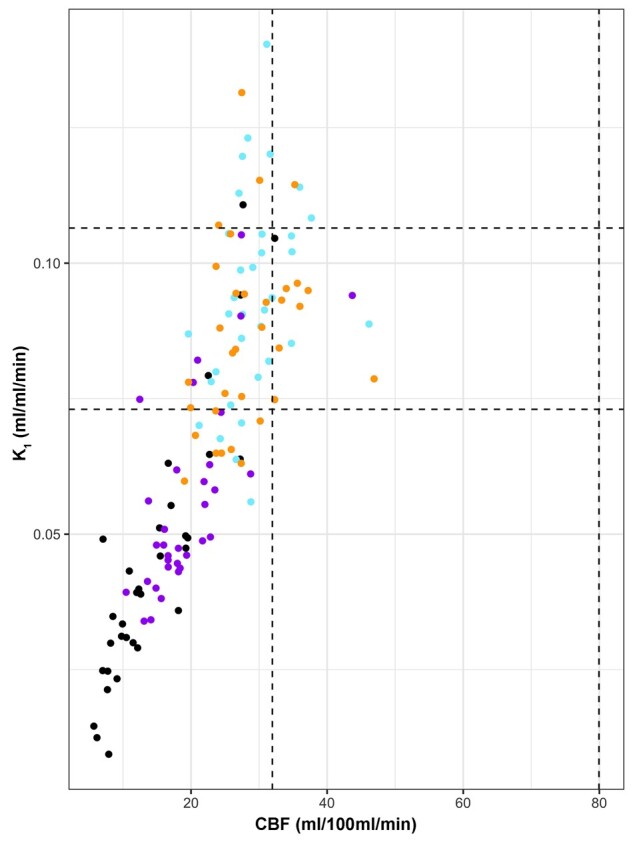
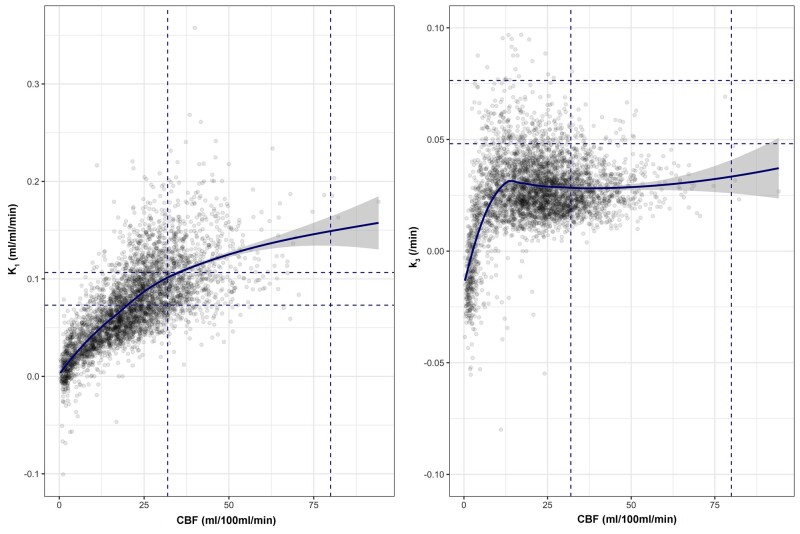
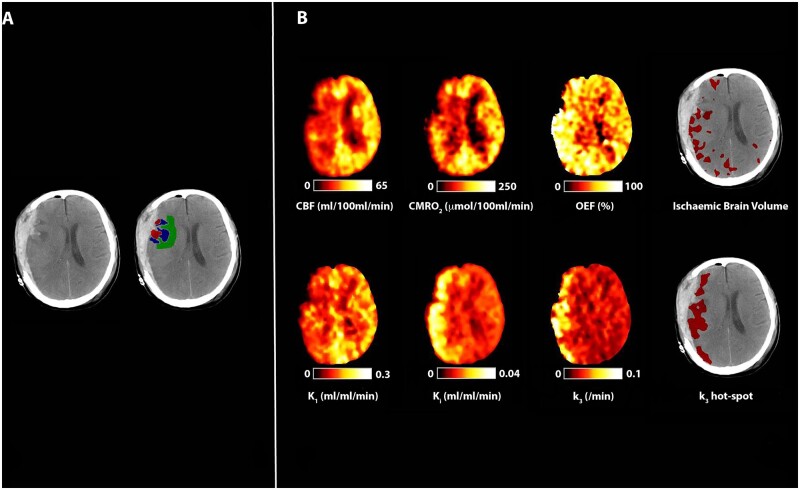
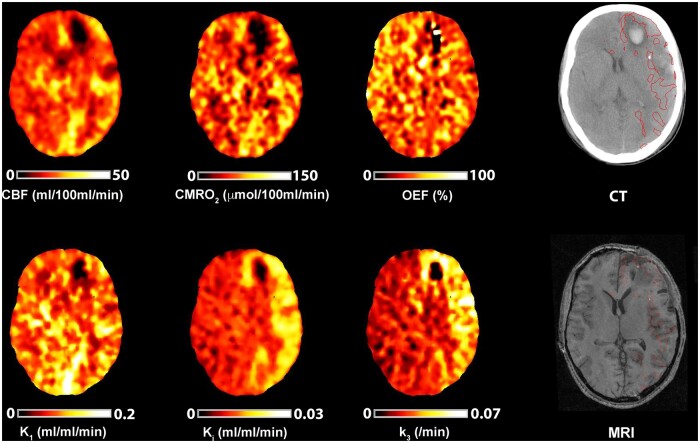
Metabolic derangements following traumatic brain injury are poorly characterized. In this single-centre observational cohort study we combined 18F-FDG and multi-tracer oxygen-15 PET to comprehensively characterize the extent and spatial pattern of metabolic derangements. Twenty-six patients requiring sedation and ventilation with intracranial pressure monitoring following head injury within a Neurosciences Critical Care Unit, and 47 healthy volunteers were recruited. Eighteen volunteers were excluded for age over 60 years (n = 11), movement-related artefact (n = 3) or physiological instability during imaging (n = 4). We measured cerebral blood flow, blood volume, oxygen extraction fraction, and 18F-FDG transport into the brain (K1) and its phosphorylation (k3). We calculated oxygen metabolism, 18F-FDG influx rate constant (Ki), glucose metabolism and the oxygen/glucose metabolic ratio. Lesion core, penumbra and peri-penumbra, and normal-appearing brain, ischaemic brain volume and k3 hotspot regions were compared with plasma and microdialysis glucose in patients. Twenty-six head injury patients, median age 40 years (22 male, four female) underwent 34 combined 18F-FDG and oxygen-15 PET at early, intermediate, and late time points (within 24 h, Days 2-5, and Days 6-12 post-injury; n = 12, 8, and 14, respectively), and were compared with 20 volunteers, median age 43 years (15 male, five female) who underwent oxygen-15, and nine volunteers, median age 56 years (three male, six female) who underwent 18F-FDG PET. Higher plasma glucose was associated with higher microdialysate glucose. Blood flow and K1 were decreased in the vicinity of lesions, and closely related when blood flow was <25 ml/100 ml/min. Within normal-appearing brain, K1 was maintained despite lower blood flow than volunteers. Glucose utilization was globally reduced in comparison with volunteers (P < 0.001). k3 was variable; highest within lesions with some patients showing increases with blood flow <25 ml/100 ml/min, but falling steeply with blood flow lower than 12 ml/100 ml/min. k3 hotspots were found distant from lesions, with k3 increases associated with lower plasma glucose (Rho -0.33, P < 0.001) and microdialysis glucose (Rho -0.73, P = 0.02). k3 hotspots showed similar K1 and glucose metabolism to volunteers despite lower blood flow and oxygen metabolism (P < 0.001, both comparisons); oxygen extraction fraction increases consistent with ischaemia were uncommon. We show that glucose delivery was dependent on plasma glucose and cerebral blood flow. Overall glucose utilization was low, but regional increases were associated with reductions in glucose availability, blood flow and oxygen metabolism in the absence of ischaemia. Clinical management should optimize blood flow and glucose delivery and could explore the use of alternative energy substrates.

Keywords: PET; cerebral blood flow; glucose metabolism; microdialysis; traumatic brain injury.


Figures

Figure 1
Figure 1
Peri-lesional hyperglycolysis in the absence of cerebral ischaemia. CT, CBF, CMRO2, OEF, and 18F-FDG kinetic parameters obtained in a 29-year-old male within 24 h of severe TBI following a road traffic accident. Plasma glucose during imaging was 6.6 mmol/l. (A) CT demonstrates bilateral temporal and parietal haemorrhagic contusions. Regions of interest are defined for haemorrhagic lesion (core, red), hypodense tissue (penumbra, blue), and a 1 cm border zone of normal-appearing tissue (peri-penumbra, green). (B) Co-registered parametric maps of CBF, CMRO2, OEF, K1, Ki and k3. The regions with a critical increase in OEF above the individually calculated threshold (ischaemic brain volume) and region of increased phosphorylation activity (k3 hotspot) are both shown in red overlying the CT scan. The ischaemic brain and k3 hotspot volumes were 7 ml and 56 ml, respectively, and overlap between these two tissue classes in this patient was 0.4 ml.
Figure 2
Figure 2
Spatial and temporal pattern of metabolic parameters. Box-and-whisker plots of the 18F-FDG kinetic parameters (K1, k3, Ki), CBF, CBV, OEF, CMRO2, CMRG, and CMRO2/CMRG metabolic ratio for the different regions of interest in patients within 24 h (Early; white), Days 2–5 (Intermediate; green) and Days 6–12 (Late, blue) post-injury. The horizontal line within each box denotes the median value, the lower and upper boundaries the 25th and 75th centile, the vertical lines the 10th and 90th centile, and the closed circles outlying data-points. The solid and dashed black lines represent the median and the full range of values for healthy volunteers, respectively. For the metabolic ratio the median and range in healthy volunteers is calculated from two different cohorts of subjects.
Figure 3
Figure 3
Relationship between glucose transport and CBF based on region of interest data. Scatterplot of 18F-FDG transport (K1) and CBF in patient regions of interest: lesion core (black), penumbra (purple), peri-penumbra (blue) and normal-appearing (orange). The black vertical and horizontal dotted lines indicate the full range for healthy volunteer CBF and K1 values, respectively.
Figure 4
Figure 4
Relationships between 18F-FDG kinetic parameters and CBF based on voxel data. For each PET imaging session in patients the relationship between CBF and 18F-FDG transport (K1; left) and phosphorylation activity (k3; right) is plotted for voxels across the whole brain. The fitted light blue lines represent modelling of the relationship between each parameter using locally weighted scatterplot smoothing (LOWESS), with the 95% confidence interval shown in grey. The blue vertical and horizontal dotted lines indicate the full range for healthy volunteer CBF and 18F-FDG kinetic parameters, respectively.
Figure 5
Figure 5
Evidence of cerebral ischaemia and hyperglycolysis. CT, CBF, CMRO2, OEF, and 18F-FDG kinetic parameters obtained in a 40-year-old female within 24 h of severe TBI resulting from a fall. Imaging was obtained following evacuation of a subdural haematoma. Plasma glucose during PET was 3.7 mmol/l. (A) CT demonstrates residual subdural blood with minimal midline shift and underlying haemorrhagic contusions. Regions of interest are defined for haemorrhagic lesion (core, red), hypodense tissue (penumbra, blue), and a 1 cm border zone of normal-appearing tissue (peri-penumbra, green). (B) Co-registered parametric maps of CBF, CMRO2, OEF, K1, Ki and k3. The regions with a critical increase in OEF above the individually calculated threshold (ischaemic brain volume) and increased phosphorylation activity (k3 ‘hotspot’) are both shown in red overlying the CT scan. The ischaemic brain volume and k3 hotspot volume were 96 ml and 174 ml, respectively, and the volume of overlap between these two tissue classes in this patient was 38 ml.
Figure 6
Figure 6
Association between early metabolic derangements and tissue fate. Imaging obtained in a 17-year-old male with moderate TBI following a road traffic accident with initial GCS of 12, but who required sedation and ventilation for control of raised ICP. Co-registered CBF, CMRO2, OEF, 18F-FDG kinetic parameters and CT imaging obtained on Day 8 following TBI. Plasma glucose during imaging was 5.4 mmol/l. The CT demonstrates left frontal and temporal haemorrhagic contusions and is shown with the T1-weighted MRI obtained at 9 months post-injury; the MRI has been non-rigidly registered to the CT. Both structural images are displayed with the region of k3 hotspot outlined in red, but both lesion core and penumbra have been excluded from the hotspot to ensure that only increases in k3 outside of the lesion identified on CT imaging are shown. The volume of brain within the k3 hotspot in this subject was 149 ml and, in comparison with brain that appeared structurally normal, had CBF 19.6 versus 19.6 ml/100 ml/min, CMRO2 55.2 versus 60.2 µmol/100 ml/min, OEF 37.8 versus 42.4%, K1 0.097 versus 0.087 ml/ml/min, Ki 0.018 versus 0.012 ml/ml/min and k3 0.058 versus 0.024/min, respectively. The T1-weighted MRI demonstrates established lesions within the left frontal and temporal brain regions in close proximity with k3 increases outside of lesion core and penumbra identified on the CT image.

References

    1. Coles JP, Cunningham AS, Salvador R, et al.Early metabolic characteristics of lesion and nonlesion tissue after head injury. J Cereb Blood Flow Metab. 2009;29(5):965–975. - PubMed
    1. Hattori N, Huang SC, Wu HM, et al.Acute changes in regional cerebral (18)F-FDG kinetics in patients with traumatic brain injury. J Nucl Med. 2004;45(5):775–783. - PubMed
    1. Wu HM, Huang SC, Hattori N, et al.Subcortical white matter metabolic changes remote from focal hemorrhagic lesions suggest diffuse injury after human traumatic brain injury. Neurosurgery. 2004;55(6):1306–1315; discussion 1316–1317. - PubMed
    1. Wu HM, Huang SC, Vespa P, Hovda DA, Bergsneider M.. Redefining the pericontusional penumbra following traumatic brain injury: Evidence of deteriorating metabolic derangements based on positron emission tomography. J Neurotrauma. 2013;30(5):352–360. - PMC - PubMed
    1. Vespa P, Bergsneider M, Hattori N, et al.Metabolic crisis without brain ischemia is common after traumatic brain injury: A combined microdialysis and positron emission tomography study. J Cereb Blood Flow Metab. 2005;25(6):763–774. - PMC - PubMed

Publication types