. 2021 Oct 27;38(11):4832-4846.
doi: 10.1093/molbev/msab209.

Genome Analysis Traces Regional Dispersal of Rice in Taiwan and Southeast Asia

Affiliations

Genome Analysis Traces Regional Dispersal of Rice in Taiwan and Southeast Asia

Ornob Alam et al. Mol Biol Evol. .

Abstract

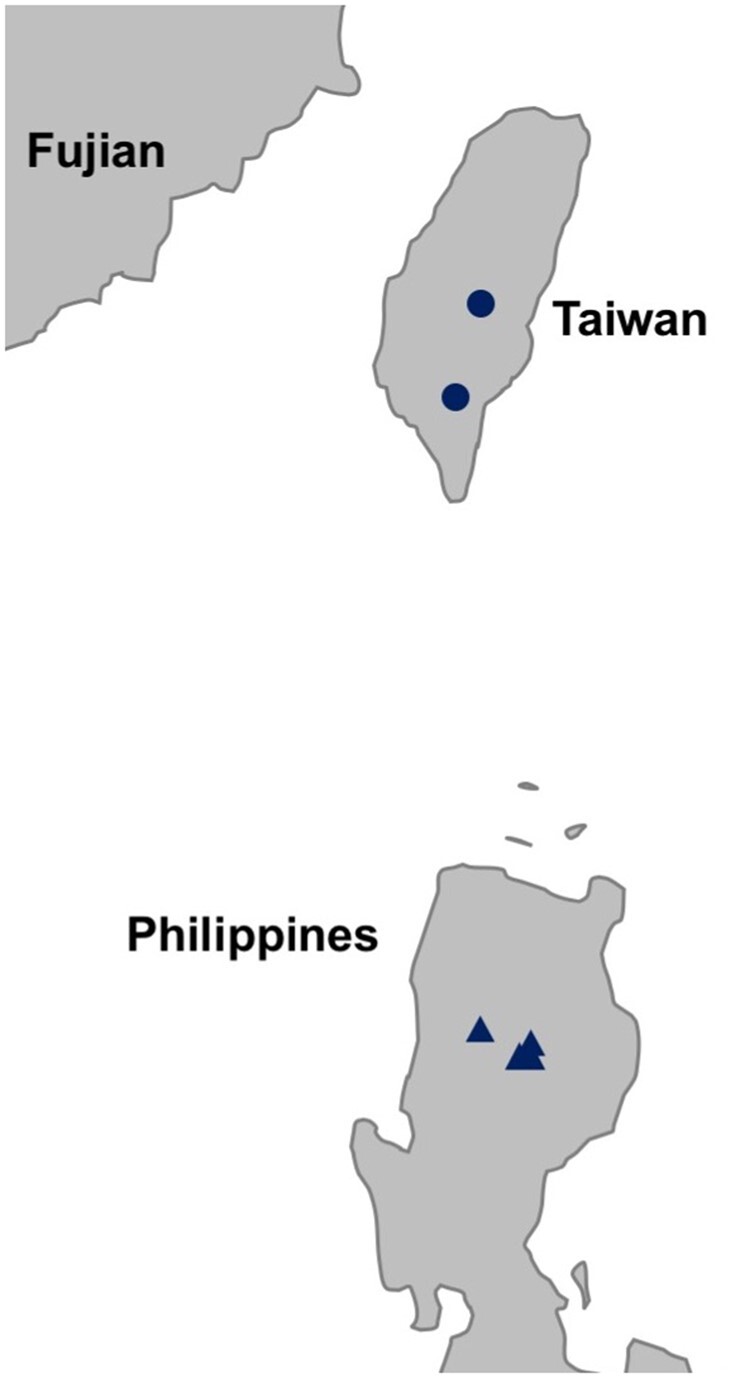
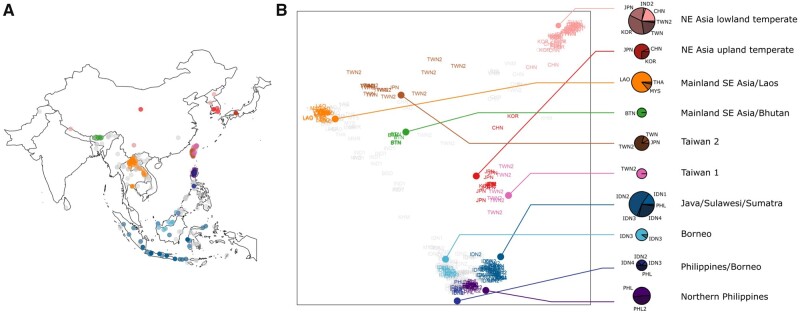
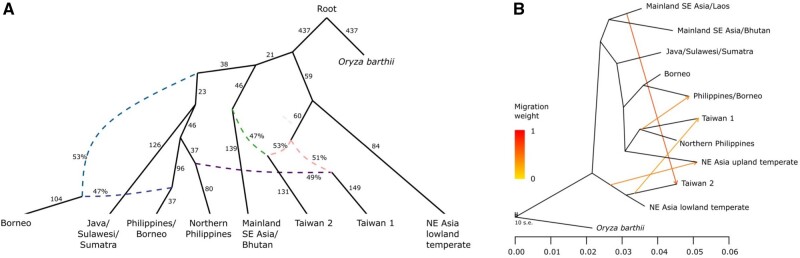
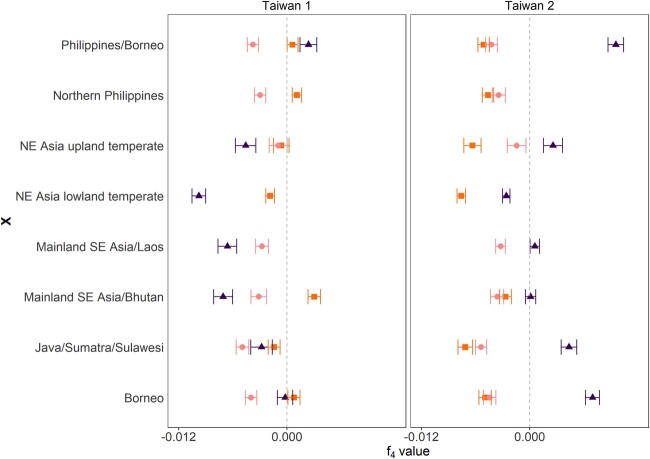
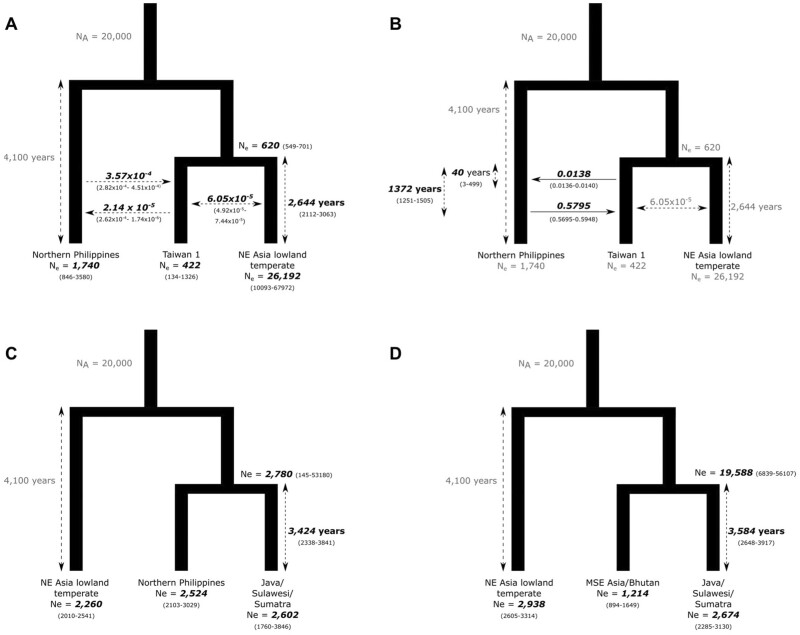
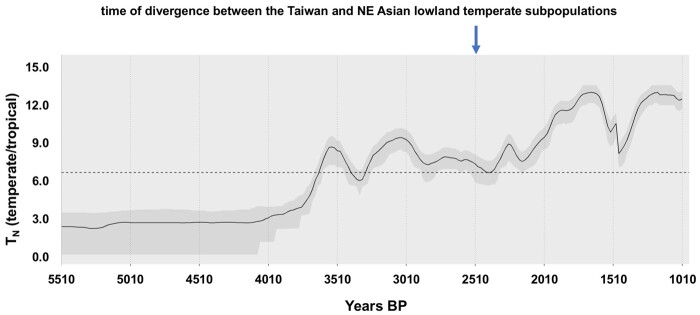
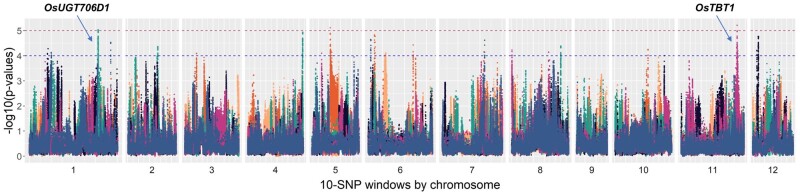
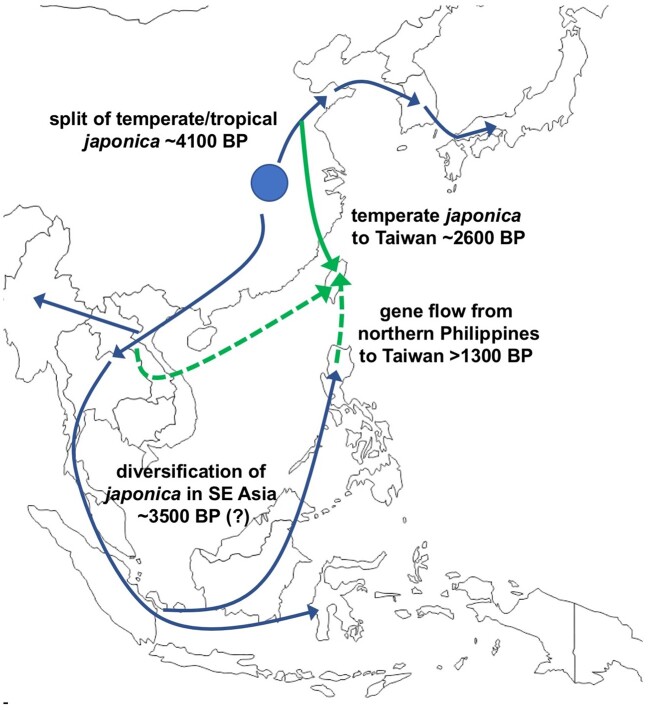
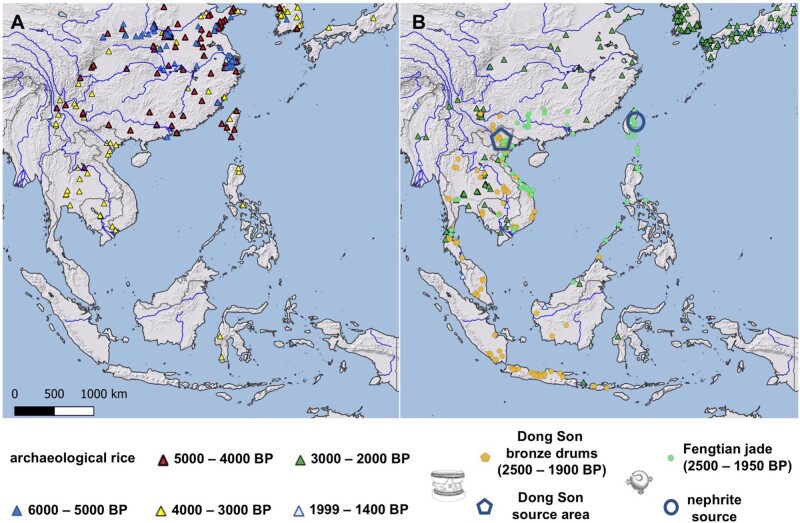
The dispersal of rice (Oryza sativa) following domestication influenced massive social and cultural changes across South, East, and Southeast (SE) Asia. The history of dispersal across islands of SE Asia, and the role of Taiwan and the Austronesian expansion in this process remain largely unresolved. Here, we reconstructed the routes of dispersal of O. sativa ssp. japonica rice to Taiwan and the northern Philippines using whole-genome resequencing of indigenous rice landraces coupled with archaeological and paleoclimate data. Our results indicate that japonica rice found in the northern Philippines diverged from Indonesian landraces as early as 3,500 years before present (BP). In contrast, rice cultivated by the indigenous peoples of the Taiwanese mountains has complex origins. It comprises two distinct populations, each best explained as a result of admixture between temperate japonica that presumably came from northeast Asia, and tropical japonica from the northern Philippines and mainland SE Asia, respectively. We find that the temperate japonica component of these indigenous Taiwan populations diverged from northeast Asia subpopulations at about 2,600 BP, whereas gene flow from the northern Philippines had begun before ∼1,300 BP. This coincides with a period of intensified trade established across the South China Sea. Finally, we find evidence for positive selection acting on distinct genomic regions in different rice subpopulations, indicating local adaptation associated with the spread of japonica rice.

Keywords: Austronesian expansion; admixture; crop evolution; domestication.


Figures

Fig. 1.
Fig. 1.
Sampling locations of Taiwan and Northern Philippines Oryza sativa ssp. japonica landraces. The approximate locations of Taiwan indigenous landraces in the central mountain range are indicated by the circle; the precise sampling locations are unknown. The triangles indicate sampling locations of the northern Philippine landraces in the Cordillera region of the island of Luzon.
Fig. 2.
Fig. 2.
Population structure of japonica rice. (A) Map of collection sites for all the japonica landraces used in this study. Colors represent regions of origin, as indicated in the next panel. Gray dots are landraces that do not fall into the discretized genetic/geographic clusters. (B) Subpopulations of japonica rice. All japonica landraces projected onto the first two dimensions after multidimensional scaling of genomic distances. The japonica genotypes were clustered using K-medoids (K = 11 subpopulations) and filtered using silhouette parameters, which resulted in Kd = 11 discrete subpopulations (colored labels). Pie charts representing the geographical composition of each discrete subpopulation of japonica subgroups. Each cluster is named for the general region where these landraces are found (e.g., SE Asia) and/or type of landrace (e.g., temperate, upland). Chart diameter is proportional to the number of individuals in each subpopulation. Geographical country codes are: BTN = Bhutan, CHN = China, IDN1 = Sumatra, IDN2 = Java, IDN3 = Borneo, IDN4 = Sulawesi, JPN = Japan, KOR = Korea, LAO = Laos, MYS = Malay Peninsula or neighboring, PHL = Philippines from Gutaker et al. (2020), PHL2 = Philippines from the current study, THA = Thailand, TWN = Taiwan from Gutaker et al. (2020), TWN2 = Taiwan from the current study.
Fig. 3.
Fig. 3.
Admixture graph and TREEMIX models of japonica rice. (A) Admixture graph Kd = 9 japonica subpopulations (maximum |z-score| = 2.907), rooted with Oryza barthii as an outgroup. This graph represents topology that is consistent between models for all lower values of K. Solid lines with arrowheads indicate lineages with uniform genetic ancestries, with the scaled drift parameter f2 shown next to these lines. Dashed lines lead to subpopulations with mixed ancestries, with the estimated proportion of ancestry indicated by the percentage values. (B) Maximum likelihood trees based on Treemix. When a subpopulation has multiple ancestry sources, it forms a clade with one of the sources whereas an accompanying arrow indicates shared ancestry with the other source; this analysis is suggestive (but not conclusive) on the level and direction of gene flow.
Fig. 4.
Fig. 4.
f4 statistics to detect relative degrees of gene flow. The f4 statistics is calculated between each Taiwanese subpopulation and the putative admixing sources mainland SE Asia/Laos, NE Asia lowland temperate, and Northern Philippine subpopulations. The f4 statistic were calculated for the model (OUT, mainland SE Asia; Taiwan, X) in squares, (OUT, NE Asia lowland temperate; Taiwan, X) in circles, and (OUT, Northern Philippines; Taiwan, X) in triangles, with OUT being Oryza barthii and X the subpopulations in the rows. The error around the mean (± standard error) of the f4 statistics are indicated. The dashed line denotes f4 = 0.
Fig. 5.
Fig. 5.
Demographic models of japonica rice in Taiwan and SE Asia using δaδi. (A) Model of diffuse bidirectional asymmetric gene flow between Taiwan and northern Philippines. (B) Model of pulsed bidirectional asymmetric gene flow between Taiwan and northern Philippines. (C) Model of divergence between Java/Sulawesi/Sumatra and northern Philippines and (D) mainland SE Asia/Bhutan subpopulations. All inferred parameter estimates are in bold. Migration parameters are indicated over horizontal arrows, whereas divergence times by vertical arrows. The 95% confidence intervals are in parentheses. Models depicted in (B) and (C) did not include gene flow as there was no evidence of significant admixture with these subpopulations.
Fig. 6.
Fig. 6.
Thermal niche modeling for japonica rice in Taiwan. Tn is 100 × log of the ratio of probability of temperate versus tropical rice thermal niche suitability (assuming requirement of 2,900 GDD at 10 °C base for tropical japonica and 2,500 GDD at 10 °C base for temperate japonica) over time. The line represents mean and the gray-shaded area represents 25–75% probability of being in the thermal niche. The estimated time of divergence between the Taiwan and NE Asian lowland temperate subpopulations is indicated.
Fig. 7.
Fig. 7.
Selection in specific subpopulation branches using Graph-aware Retrieval of Selective Sweeps (GRoSS). The horizontal lines demarcate the thresholds of P < 10−4 and P < 10−5. The different colors in the plot represent branches leading to different subpopulations in the admixture graph. Borneo, black; NE Asia lowland temperate, peach; Northern Philippines, blue; Philippines/Borneo, pink; Taiwan 1, orange; Taiwan 2; teal. The peaks associated with OsUGT706D1 and OsTBT1 are indicated.
Fig. 8.
Fig. 8.
Schematic model of the movement of japonica rice into Taiwan and SE Asia. The blue lines broadly indicate main lines of japonica dispersal across NE and SE Asia. The solid green line represents dispersal of temperate japonica into Taiwan, whereas dashed green lines indicate gene flow into Taiwan japonica rice subpopulations from mainland SE Asia and the northern Philippines. The question mark on the date for japonica rice diversification in SE Asia indicates uncertainty in the timing given different estimates based on this study and our earlier work (Gutaker et al. 2020).
Fig. 9.
Fig. 9.
Archaeological evidence for presence of rice and goods associated with maritime trading across SE Asia, Taiwan, and China. (A) Rice finds from 6,000–3,000 BP. (B) Rice finds from 1,999–1,400 BP, and Dong Son drums from Northern Vietnam (2,500–1,900 BP) and Fengtian jade (2,500–1,950 BP).

References

    1. Anggraeni ST, Bellwood P, Piper P.. 2014. Neolithic foundations in the Karama valley, West Sulawesi, Indonesia. Antiquity 88:740–756.
    1. Barron A, Datan I, Bellwood P, Wood R, Fuller DQ, Denham T.. 2020. Sherds as archaeobotanical assemblages: Gua Sireh reconsidered. Antiquity 94(377):1325–1336.
    1. Bedford S. 2006. Pieces of the Vanuatu puzzle: archaeology of the north, south and centre. Terra Australis 23. Canberra (ACT; ): Australian National University.
    1. Bellina B. 2017. Khao Sam Kaeo. An early port-city between the Indian Ocean and the South China Sea. Paris: École Française d'Extrême-Orient.
    1. Bellwood P. 1997. Prehistory of the Indo-Malaysian Archipelago. Honolulu (HI: ): University of Hawaii Press.

Publication types