. 2021 Oct 27;38(11):4822-4831.
doi: 10.1093/molbev/msab208.

Global Genetic Heterogeneity in Adaptive Traits

Affiliations

Global Genetic Heterogeneity in Adaptive Traits

William Andres Lopez-Arboleda et al. Mol Biol Evol. .

Abstract

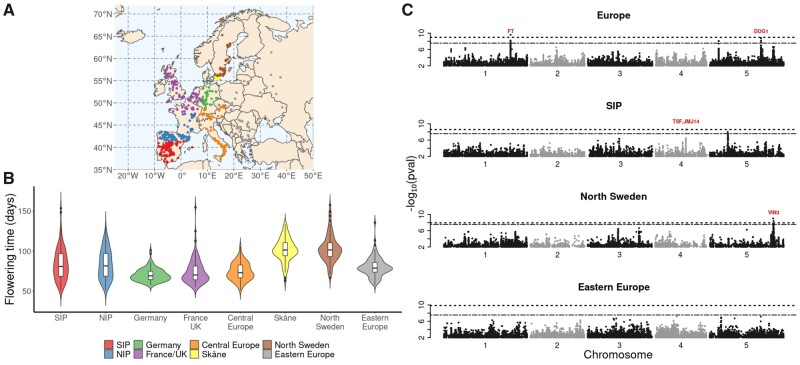
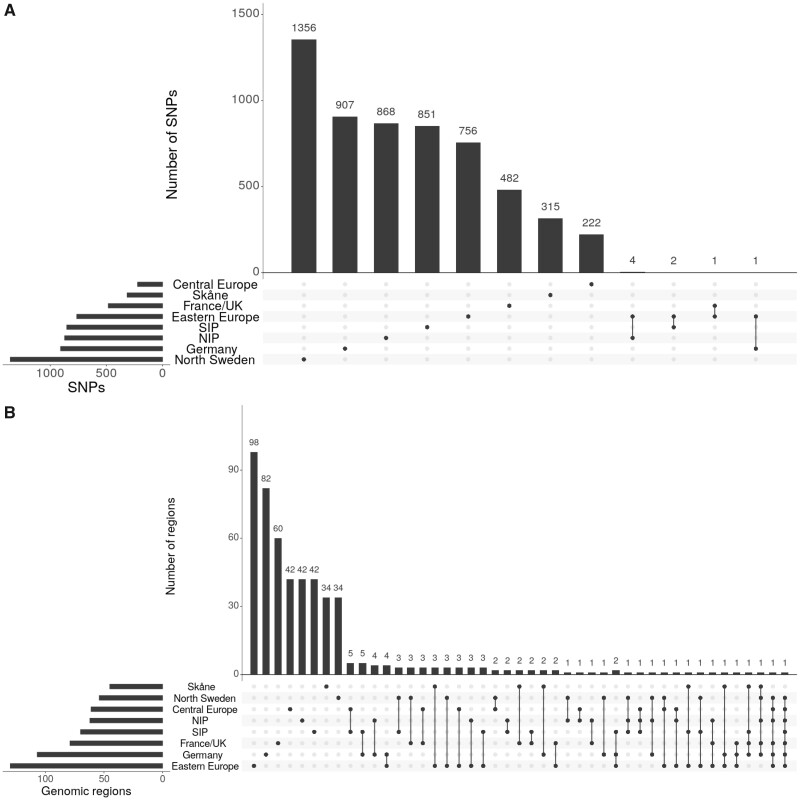
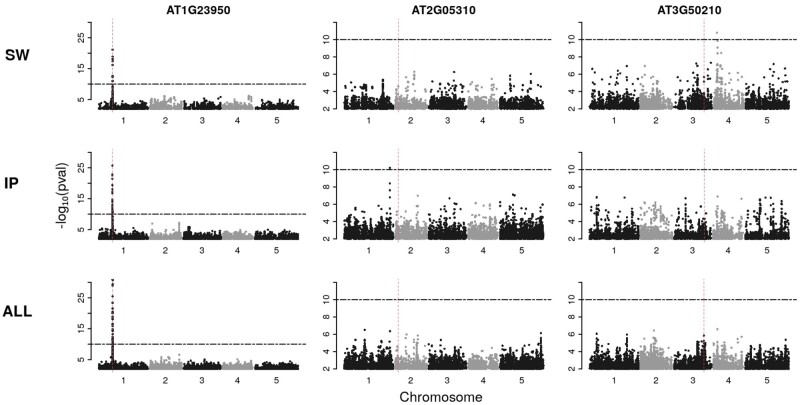
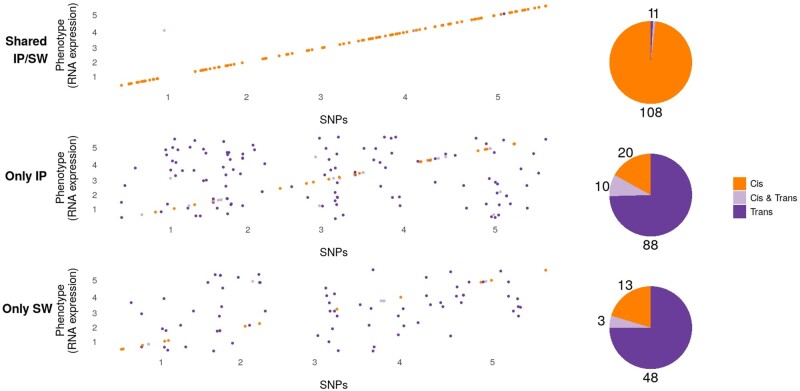
Understanding the genetic architecture of complex traits is a major objective in biology. The standard approach for doing so is genome-wide association studies (GWAS), which aim to identify genetic polymorphisms responsible for variation in traits of interest. In human genetics, consistency across studies is commonly used as an indicator of reliability. However, if traits are involved in adaptation to the local environment, we do not necessarily expect reproducibility. On the contrary, results may depend on where you sample, and sampling across a wide range of environments may decrease the power of GWAS because of increased genetic heterogeneity. In this study, we examine how sampling affects GWAS in the model plant species Arabidopsis thaliana. We show that traits like flowering time are indeed influenced by distinct genetic effects in local populations. Furthermore, using gene expression as a molecular phenotype, we show that some genes are globally affected by shared variants, whereas others are affected by variants specific to subpopulations. Remarkably, the former are essentially all cis-regulated, whereas the latter are predominately affected by trans-acting variants. Our result illustrate that conclusions about genetic architecture can be extremely sensitive to sampling and population structure.

Keywords: GWAS; evolutionary genomics; genetic architecture; regulation of gene expression.


Figures

Fig. 1.
Fig. 1.
GWAS of flowering time across Europe. (A) Origin of the 888 European Arabidopsis thaliana accessions, with eight designated subpopulations in different colors. (B) The distribution of flowering time in the subpopulations. (C) Manhattan plots of GWAS results for the whole European populations and three of the eight subpopulations. Dashed and dash-dotted lines indicate Bonferroni- and permutation-based 5% significance thresholds, respectively. Candidate genes that are in close proximity to significantly associated markers are indicated in red.
Fig. 2.
Fig. 2.
Sharing of subsignificant (P<104) associations. (A) Histogram of the number of associated SNPs in each subpopulation and shared between subpopulations. (B) Histogram of the number of associated genomic regions in each subpopulation and shared between subpopulations.
Fig. 3.
Fig. 3.
Manhattan plots from GWAS on expression levels for three different genes. The columns show the results from genes representing different scenarios. The rows display the GWAS results of the analysis in the two subpopulations (SW and IP, respectively), or in the merged population (ALL). Horizontal dash-dotted lines indicate the significance threshold of P<1010. Vertical dashed lines show the position of the gene whose expression is being used as a molecular phenotype.
Fig. 4.
Fig. 4.
Summary of the difference between shared and nonshared GWAS results for expression data. The top panel shows associations that are shared between the two subpopulations, whereas the bottom panels show associations that are specific to one subpopulation. The plots show the chromosomal location of the genes whose expression is mapped on the x axis, and the chromosomal position of significantly associated SNPs on the y axis. Associations in cis are shown in orange, whereas trans-associations are shown in purple. The pie charts show the number of genes in each category.

References

    1. 1001 Genomes Consortium. 2016. 1,135 genomes reveal the global pattern of polymorphism in Arabidopsis thaliana. Cell 166:481–491. - PMC - PubMed
    1. Ågren J, Oakley CG, Lundemo S, Schemske DW.. 2017. Adaptive divergence in flowering time among natural populations of Arabidopsis thaliana: estimates of selection and QTL mapping. Evolution 71(3):550–564. - PubMed
    1. Atwell S, Huang YS, Vilhjálmsson BJ, Willems G, Horton M, Li Y, Meng D, Platt A, Tarone AM, Hu TT, et al.2010. Genome-wide association study of 107 phenotypes in Arabidopsis thaliana inbred lines. Nature 465(7298):627–631. - PMC - PubMed
    1. Barton N, Hermisson J, Nordborg M.. 2019. Why structure matters. Elife 8:e45380. - PMC - PubMed
    1. Berg JJ, Harpak A, Sinnott-Armstrong N, Joergensen AM, Mostafavi H, Field Y, Boyle EA, Zhang X, Racimo F, Pritchard JK, et al.2019. Reduced signal for polygenic adaptation of height in UK biobank. Elife 8:e39725. - PMC - PubMed

Publication types