. 2022 Sep;251(9):1490-1508.
doi: 10.1002/dvdy.396. Epub 2021 Jul 17.

Regional specific differentiation of integumentary organs: SATB2 is involved in α- and β-keratin gene cluster switching in the chicken

Affiliations

Regional specific differentiation of integumentary organs: SATB2 is involved in α- and β-keratin gene cluster switching in the chicken

Gee-Way Lin et al. Dev Dyn. 2022 Sep.

Abstract

Background: Animals develop skin regional specificities to best adapt to their environments. Birds are excellent models in which to study the epigenetic mechanisms that facilitate these adaptions. Patients suffering from SATB2 mutations exhibit multiple defects including ectodermal dysplasia-like changes. The preferential expression of SATB2, a chromatin regulator, in feather-forming compared to scale-forming regions, suggests it functions in regional specification of chicken skin appendages by acting on either differentiation or morphogenesis.

Results: Retrovirus mediated SATB2 misexpression in developing feathers, beaks, and claws causes epidermal differentiation abnormalities (e.g. knobs, plaques) with few organ morphology alterations. Chicken β-keratins are encoded in 5 sub-clusters (Claw, Feather, Feather-like, Scale, and Keratinocyte) on Chromosome 25 and a large Feather keratin cluster on Chromosome 27. Type I and II α-keratin clusters are located on Chromosomes 27 and 33, respectively. Transcriptome analyses showed these keratins (1) are often tuned up or down collectively as a sub-cluster, and (2) these changes occur in a temporo-spatial specific manner.

Conclusions: These results suggest an organizing role of SATB2 in cluster-level gene co-regulation during skin regional specification.

Keywords: epidermal differentiation; epigenetic mechanism; gene cluster; morphogenesis; regional specificity; α- and β-keratin.


Conflict of interest statement

COMPETING INTERESTS: No competing interests declared.

Figures

Figure 1
Figure 1. Detection of SATB2 during skin appendage development in chicken embryos.
(A) The selected embryonic stages of tissue sampling (feather placode at embryonic day 7 (E7) vs. scale placode at E9 and short feather buds at E9 vs. overlapping scales at E11) in previously published RNA-seq and H3K27ac-ChIP-seq. We also collected new samples (beak and feather at E14 and scale at E16 under keratinization) for RNA-seq in this study. (B) Enriched peaks of H3K27ac-ChIP-seq were detected in feathers (red) rather than scales (green) around the promotor of SATB2 (20 kb upstream). (C-N) Whole-mount ISH of SATB2 revealed their mRNA expression in developing feathers on neck, dorsal and caudal regions (C-H) and developing scale (I-N) at E6 to E11. Arrowheads indicate SATB2 signals within feather placodes at E7, E8, short feather buds at E9, feather filaments at E10, E11 and overlapping scales at E10, E11. (M’, N’) Higher magnification views of (M, N, respectively) show the weak SATB2 signals within overlapping scales (dash line). (O-Q) ISH on paraffin sections of dorsal feather buds from E7 to E9. Arrowheads indicate SATB2 signals in the epidermis at E7 (O) and in both epidermis and dermis of developing feathers at E8 (P) and E9 (Q).
Figure 2
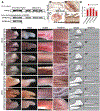
Figure 2. SATB2 perturbation by overexpression of wild-type (RCAS-SATB2-OE) or truncated mutant (RCAS-SATB2-ΔN) version in developing integumentary organs.
(A) Illustration of a nonsense mutation of SATB2 in patients and two SATB2 constructs misexpressed in this study. (B-D) IHC with AMV-3C2 at E14-beak (B), E16-feather (C) and E16-scale (D). (B’) high magnification view from (B). RCAS-SATB2-OE infections were randomly distributed in both epidermis and dermis (arrowheads). (E) The related expression levels of SATB2 between SATB2-overexpressed tissue (RCAS-SATB2-OE) and Ctrl (RCAS-GFP) from RNA-seq results. (F-L) Phenotype of skin appendages (beak, claw, scale and feather) at E13, E14 or E16 under infection with control RCAS-GFP (F, H, J), RCAS-SATB2-OE (G, I, K) or RCAS-SATB2-ΔN (L). Dashed lines label the boundaries between keratinized (white) and unkeratinized regions (skin color) in the upper beak and claw. Arrowheads indicate the heterogeneous texture of beaks and claws or plaques on feathers under RCAS-SATB2-OE. Arrow in (K) indicates the irregular size of scales under RCAS-SATB2-OE. (F’-L’ and F’’-L’’) Illustration of the phenotype and the level of keratinization (white region) in beaks and feathers corresponding to (F-L), respectively. Abbreviation: BR, barb ridge; D, dermis; FS, feather sheath; LB, lower beak; PD, periderm; SB, stratum basal; SI, stratum intermedium; SP, subperiderm; UB, upper beak.
Figure 3
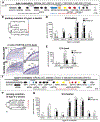
Figure 3. Over-expression of RCAS-SATB2 on the expression of β-keratins in developing and regenerating feathers.
(A) Illustration of the feather stratified epithelium. Red dotted lines indicate a barb ridge (modified from Lucas and Stettenheim 1972). (B-C’) H&E staining, (D-G’) in situ hybridization of Chr27-FK12 and Chr25-FK12 probes on E14-feathers and E16-feathers under SATB2-OE and RCAS-GFP control, respectively. (D’’-G’’) Schematic diagram of ISH results at E14-feathers. (H-M) Phenotypes of SATB2-perturbation on regenerating chicken flight feather follicles. The length of regenerated feathers under SATB2-OE in (K) was shorter than that in control (H). (I’, J’, L’, M’) High magnification views of cross-sections of feathers from (I, J, L, M). (J, M) IHC of AMV-3C2. (N) The related expression of representative β-keratins in each sub-cluster (ktn, Claw, Scale, FL, FK) on Chr25 and a huge cluster (FK) on Chr27 between RCAS-SATB2-OE and RCAS-GFP in E14 and E16-feathers. (O) The gene expression value (CPM, counts per million) of represented β-keratins in (N). Asterisks indicate the p< 0.05 and log2 fold-change> 1.5 or <1.5. Abbreviation: AP, axial plate; BC, barb cortex; BR, barb ridge; BM, barb medulla; BP, barbule plate; DB, downy barbules; FS, feather sheath; Marginal plate; PD, periderm; RM, Ramus.
Figure 4
Figure 4. Over-expression of RCAS-SATB2 on the expression of β-keratins in developing scales.
(A) Illustration of structure and stratified layers of E16 scale (modified from Wu et al., 2015). (B, C) ISH of conserved sequence among scale keratins (SK). (B’, C’) Higher magnification view of (B, C) showing the enriched SK signals in both SP and SI layers. (C’) Under RCAS-SATB2-OE, signals of SK increase in SI. (D, E) ISH of Chr27-FK12. (D’, E’) Higher magnification view of (D, E). The enriched Chr27-FK12 signals were located within the SP in (D’), but within the SI in (E’). Solid arrowheads indicate strong keratin expression within the subperiderm. Empty arrowhead indicates the decreased Chr27-FK12 signal within the subperiderm. (B’’-E’’) Schematic diagram of ISH results in E16 scales. (F, G) The gene expression value (CPM) of representative Scale keratins in (F) and FK on Chr27 in (G) in E16 scales. Abbreviation: IS, inner surface; HG, hinge; OS, outer surface; PD, periderm; SB, stratum basal; SI, stratum intermedium; SP, subperiderm.
Figure 5
Figure 5. Over-expression of RCAS-SATB2 on the expression of β-keratins in developing beaks and claws.
(A) Illustration of the structure and stratified layers of the E14 beak (modified from Wu et al., 2015). (B, C) H&E staining of the E14 beak under SATB2-OE and RCAS-GFP control, respectively. (D, E) ISH of Claw9 keratin probes on the E14 beak. (F, G) ISH of Chr27-FK39 probes on the E14 beak. (B’-G’ and B’’-G’’) Higher magnification view of the upper beak and lower beak from (B-G), respectively. (D’’’-G’’’) Schematic diagram showing ISH results in the E14 beak. The black dotted line indicates the basement membrane. Arrowhead indicates the impaired area. (H, I) Only Ktn and Scale keratin were detected with differential expression between SATB2-overexpressing and Ctrl tissues in the E14 beak. (I) The gene expression value (CPM) of scale keratins in (H). Abbreviation: ET, egg tooth; LB, lower beak; SB, stratum basal; SC, stratum corneum; SI, stratum intermedium; TZ: transition zone; UB, upper beak.
Figure 6.
Figure 6.. Over-expression of RCAS-SATB2 on the expression of α-keratins in different developing integumentary organs.
(A) Genome organization of type I α-keratin genes on Chr27. (A’) A sub-clustered type I α-keratin through paralog evolution analysis is marked in (A) (modified from Ng et al., 2014). The gene names in parentheses are based on the 2014 annotation. (B) Only the sub-clustered type I α-keratin containing KRT42L, KRT10, KRT9L, KRT17L, KRTC42L, KRT42L2 were detected with differential expression between SATB2-overexpressed and Ctrl tissues in E16 feathers. (C, D) Section In situ hybridization of KRT10 gene in beaks infected with SATB2-OE and normal tissues, respectively. (C’, D’) Higher magnification views of (C, D) showing KRT10 signals were highly expressed in the SI in (D’), but lost in the TZ under SATB2-OE in (E’). (E) Only KRT10 and KRT9L were detected with differential expression between SATB2-overexpressing and Ctrl tissue in E14 beaks. (F) Genome organization of type II α-keratin genes on Chr34. (F’) A sub-clustered type II α-keratin through paralog evolution analysis is marked in (F). (G) The related expression levels of type II α-keratin between SATB2-overexpressed tissue and Ctrl in E16 feathers. Dash lines in (A’ and F’) indicates potential sub-clusters of α-keratins.
Figure 7
Figure 7. Over-expression of SATB2 causes MMP and collagen genes switching in E16-feathers and qPCR validation in feathers and beaks.
The related expression levels and gene expression value (CPM) between SATB2-overexpressing and Ctrl tissues in E16 feathers from RNA-seq for (A, A’) MMPs; (B, B’) TGFβ and Smad; (C, C’) Collagen type I, III, VI; (D, D’) qPCR validation of selected genes in different sub-clusters of E16 feathers (D) and E16 beaks (D’).
Figure 8
Figure 8. Summary of dynamic changes of α- and β-keratin gene clusters in developing integumentary organs and the temporo-spatial effects of SATB2 over-expression.
(A) The dramatic changes of keratin gene clusters during the developmental stage at E16 of feather under SATB2-OE. (B) SATB2-OE induces the opposite regulation of Feather keratins (FKs) in E16 feathers vs. E16 scales. (C) Differential expression of keratin genes mediated by SATB2-OE in E14 beaks and feathers are summarized. (D) In feathers overexpressing SATB2-OE, Scale keratins (SKs) were repressed at E14 but activated at E16. Solid color lines indicate an up-regulated trend and dashed color lines indicate a down-regulated trend. Abbreviation: CK, claw keratin; FK, feather keratin; FL, feather-like keratin; KTN, keratinocyte keratin; SK, scale keratin.

Similar articles

Cited by

References

    1. Chuong CM. Molecular Basis of Epithelial Appendage Morphogenesis. Austin, TX: Landes Bioscience; 1998.
    1. Jiang T, Stott N, Widelitz R, Chuong CM. Current methods in the Study of Avian Skin Appendages. In: Chuong CM, ed. Molecular basis of epithelial appendage morphogenesis. Austin, TX: Landes Bioscience; 1998:395–408.
    1. Millar SE. Molecular mechanisms regulating hair follicle development. J Invest Dermatol. 2002;118(2):216–25. https://doi.org10.1046/j.0022-202x.2001.01670.x. - PubMed
    1. Wu P, Hou LH, Plikus M, et al. Evo-Devo of amniote integuments and appendages. International Journal of Developmental Biology. 2004;48(2-3):249–270. https://doi.orgDOI 10.1387/ijdb.15272390. - DOI - PMC - PubMed
    1. Chang WL, Wu H, Chiu YK, et al. The Making of a Flight Feather: Bio-architectural Principles and Adaptation. Cell. 2019;179(6):1409–1423 e17. https://doi.org10.1016/j.cell.2019.11.008. - DOI - PMC - PubMed

Publication types

LinkOut - more resources