Sexual dimorphic impact of adult-onset somatopause on life span and age-induced osteoarthritis
- PMID: 34240807
- PMCID: PMC8373322
- DOI: 10.1111/acel.13427
Sexual dimorphic impact of adult-onset somatopause on life span and age-induced osteoarthritis
Abstract
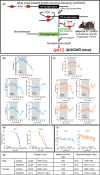
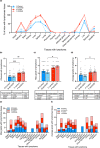
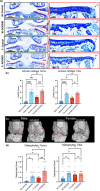
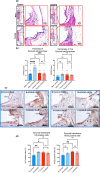
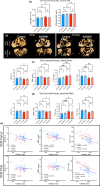
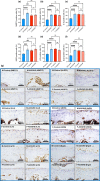
Osteoarthritis (OA), the most prevalent joint disease, is a major cause of disability worldwide. Growth hormone (GH) has been suggested to play significant roles in maintaining articular chondrocyte function and ultimately articular cartilage (AC) homeostasis. In humans, the age-associated decline in GH levels was hypothesized to play a role in the etiology of OA. We studied the impact of adult-onset isolated GH deficiency (AOiGHD) on the life span and skeletal integrity including the AC, in 23- to 30-month-old male and female mice on C57/BL6 genetic background. Reductions in GH during adulthood were associated with extended life span and reductions in body temperature in female mice only. However, end-of-life pathology revealed high levels of lymphomas in both sexes, independent of GH status. Skeletal characterization revealed increases in OA severity in AOiGHD mice, evidenced by AC degradation in both femur and tibia, and significantly increased osteophyte formation in AOiGHD females. AOiGHD males showed significant increases in the thickness of the synovial lining cell layer that was associated with increased markers of inflammation (IL-6, iNOS). Furthermore, male AOiGHD showed significant increases in matrix metalloproteinase-13 (MMP-13), p16, and β-galactosidase immunoreactivity in the AC as compared to controls, indicating increased cell senescence. In conclusion, while the life span of AOiGHD females increased, their health span was compromised by high-grade lymphomas and the development of severe OA. In contrast, AOiGHD males, which did not show extended life span, showed an overall low grade of lymphomas but exhibited significantly decreased health span, evidenced by increased OA severity.
Keywords: articular cartilage; growth hormone; health span; life span; osteoarthritis; osteophyte; subchondral bone.
© 2021 The Authors. Aging Cell published by Anatomical Society and John Wiley & Sons Ltd.
Conflict of interest statement
The authors declare no conflict of interest.
All authors have discussed the results and approved the final version of the manuscript. SY is the guarantor of this work and, as such, had full access to all the data in the study and takes responsibility for the integrity of the data and the accuracy of the data analysis.
Figures
Similar articles
-
Development of primary osteoarthritis during aging in genetically diverse UM-HET3 mice.Arthritis Res Ther. 2024 Jun 8;26(1):118. doi: 10.1186/s13075-024-03349-y. Arthritis Res Ther. 2024. PMID: 38851726 Free PMC article.
-
Long- but not short-term adult-onset, isolated GH deficiency in male mice leads to deterioration of β-cell function, which cannot be accounted for by changes in β-cell mass.Endocrinology. 2014 Mar;155(3):726-35. doi: 10.1210/en.2013-1825. Epub 2013 Dec 16. Endocrinology. 2014. PMID: 24424062 Free PMC article.
-
Deletion of JNK Enhances Senescence in Joint Tissues and Increases the Severity of Age-Related Osteoarthritis in Mice.Arthritis Rheumatol. 2020 Oct;72(10):1679-1688. doi: 10.1002/art.41312. Epub 2020 Aug 26. Arthritis Rheumatol. 2020. PMID: 32418287 Free PMC article.
-
Epigenetic Mechanisms Underlying the Aging of Articular Cartilage and Osteoarthritis.Gerontology. 2019;65(4):387-396. doi: 10.1159/000496688. Epub 2019 Apr 10. Gerontology. 2019. PMID: 30970348 Free PMC article. Review.
-
Is cartilage matrix breakdown an appropriate therapeutic target in osteoarthritis--insights from studies of aggrecan and collagen proteolysis?Curr Drug Targets. 2010 May;11(5):561-75. doi: 10.2174/138945010791011956. Curr Drug Targets. 2010. PMID: 20199393 Review.
Cited by
-
Common and Uncommon Mouse Models of Growth Hormone Deficiency.Endocr Rev. 2024 Nov 22;45(6):818-842. doi: 10.1210/endrev/bnae017. Endocr Rev. 2024. PMID: 38853618 Free PMC article. Review.
-
Growth hormone-receptor disruption in mice reduces osteoarthritis and chondrocyte hypertrophy.Geroscience. 2024 Oct;46(5):4895-4908. doi: 10.1007/s11357-024-01230-z. Epub 2024 Jun 3. Geroscience. 2024. PMID: 38831184 Free PMC article.
-
Disruption of Growth Hormone Receptor in Adipocytes Improves Insulin Sensitivity and Lifespan in Mice.Endocrinology. 2022 Oct 1;163(10):bqac129. doi: 10.1210/endocr/bqac129. Endocrinology. 2022. PMID: 35952979 Free PMC article.
-
IGF1 drives Wnt-induced joint damage and is a potential therapeutic target for osteoarthritis.Nat Commun. 2024 Oct 24;15(1):9170. doi: 10.1038/s41467-024-53604-8. Nat Commun. 2024. PMID: 39448593 Free PMC article.
-
Induction of somatopause in adult mice compromises bone morphology and exacerbates bone loss during aging.Aging Cell. 2021 Dec;20(12):e13505. doi: 10.1111/acel.13505. Epub 2021 Nov 23. Aging Cell. 2021. PMID: 34811875 Free PMC article.
References
-
- Cintron‐Colon, R., Sanchez‐Alavez, M., Nguyen, W., Mori, S., Gonzalez‐Rivera, R., Lien, T., Bartfai, T., Aid, S., Francois, J. C., Holzenberger, M., & Conti, B. (2017). Insulin‐like growth factor 1 receptor regulates hypothermia during calorie restriction. Proceedings of the National Academy of Sciences of the United State of America, 114(36), 9731–9736. 10.1073/pnas.1617876114. - DOI - PMC - PubMed
Publication types
MeSH terms
Grants and funding
LinkOut - more resources
Full Text Sources
Medical
Molecular Biology Databases

