Observational Study
. 2021 Jan-Dec;13(1):1930871.
doi: 10.1080/19490976.2021.1930871.

Inter-kingdom relationships in Crohn's disease explored using a multi-omics approach

Affiliations
Observational Study

Inter-kingdom relationships in Crohn's disease explored using a multi-omics approach

Alessandra Frau et al. Gut Microbes. 2021 Jan-Dec.

Abstract

The etiology of Crohn's disease (CD) is multifactorial. Bacterial and fungal microbiota are involved in the onset and/or progression of the disease. A bacterial dysbiosis in CD patients is accepted; however, less is known about the mycobiome and the relationships between the two communities. We investigated the interkingdom relationships, their metabolic consequences, and the changes in the fungal community during relapse and remission in CD.Two cohorts were evaluated: a British cohort (n = 63) comprising CD and ulcerative colitis patients, and controls. The fungal and bacterial communities of biopsy and fecal samples were analyzed, with the fecal volatiles; datasets were also integrated; and a Dutch cohort (n = 41) comprising CD patients and healthy controls was analyzed for stability of the gut mycobiome.A dysbiosis of the bacterial community was observed in biopsies and stool. Results suggest Bacteroides is likely key in CD and may modulate Candida colonization. A dysbiosis of the fungal community was observed only in the Dutch cohort; Malassezia and Candida were increased in patients taking immunosuppressants. Longitudinal analysis showed an increase in Cyberlindnera in relapse. Saccharomyces was dominant in all fecal samples, but not in biopsies, some of which did not yield fungal reads; amino acid degradation was the main metabolic change associated with CD and both bacteria and fungi might be implicated.We have shown that Bacteroides and yeasts may play a role in CD; understanding their role and relationship in the disease would shed new light on the development and treatment of CD.

Keywords: Crohn’s disease; metabolome; microbiome; mycobiome; volatile organic compound.


Figures

Figure 1.
Figure 1.
Alpha and Beta diversity results of the bacterial gut microbiome (British cohort). A1 to A4: Alpha diversity of the bacterial microbiome from the four specimen types: terminal ileum, transverse colon, sigmoid colon and stool. Samples were grouped according to diagnosis: Crohn’s disease (CD), ulcerative colitis (UC) and Controls. Three indices were considered: Fisher alpha, richness and Shannon index. Pair-wise ANOVA was calculated between the groups (CD, UC and Controls) and if significant, stars are shown on top (* p < .05, ** p < .01 and *** p < .001). B1 to B4: Nonmetric distance scaling (NMDS) showing clustering of samples. To produce these charts, samples (n = 176) from patients for which terminal ileum (TI), transverse colon (TC), sigmoid colon (SC) and stool were available. In B3 only samples from CD patients (n = 72) were considered. The charts were produced using Bray–Curtis (Operational taxonomy units (OTUs) level). The ellipses represent 95% confidence interval of standard error for a given group. The table in B2 summarizes permutational multivariate analysis of variance (PERMANOVA) results for all the distances, Bray–Curtis, unweighted UniFrac (UniFrac) and weighted (W. UniFrac). R2 refers to the percentage of variability among samples’ microbiome that can be explained by that factor/metadata
Figure 2.
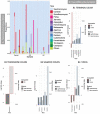
Figure 2.
A Taxa differential analysis results and phylogenetic tree of the bacterial gut microbiome (British cohort). A Taxa differential analysis comparing CD and control samples. Results are presented according to sample type: A1: Terminal Ileum (TI); A2: Transverse colon (TC); A3: sigmoid colon (SC); A4: stool. The bar charts show Log2 fold change in abundance between groups (y axis on the left and dark gray bar) and the mean abundance across all the samples (y axis on the right and light gray bar). Taxa increased in CD patients have bars with a red border, meanwhile taxa increased in controls have bars with a blue border. A subset of the most important and abundant OTUs selected using Random Forest are shown; these are taxa that allowed to achieve a 70–80% of accuracy in discriminating between groups are shown (details are in Supplemental material 1). A complete list of taxa that had significant different abundance, and further details, including adjusted p values, is in Supplemental material 4. B Phylogenetic tree of bacterial 16S rRNA OTUs. Samples (n = 176) were from TI, TC, SC and stool (British cohort) with the Bacteroides branch magnified. The tree was visualized with EvolView, which was also used to add the heatmap. The * indicates OTUs that were increased in the groups analyzed or selected in the subsets (BV-STEP analysis) that best correlated with the whole OTU table
Figure 3.
Figure 3.
Fungal microbiome results (British cohort). Samples were from stool (n = 63) and biopsies (n = 81): terminal ileum, transverse colon and sigmoid colon. A Alpha diversity (richness) of samples from the mucosa (A1) and stool (A2). Samples were grouped according to diagnosis: Crohn’s disease (CD), ulcerative colitis (UC) and Controls. Pair-wise ANOVA was calculated between the groups (CD, UC and Controls) but was not significant. B Beta diversity analysis of the fungal microbiome from the biopsy samples. B1 to B3: Nonmetric distance scaling (NMDS) showing clustering of samples. B1 compares samples according to diagnosis. In B2 only samples from CD patients were considered, meanwhile inflammatory bowel disease (IBD) active vs Control samples are compared in B3. A dashed line links samples from the same patient. The charts were produced using unweighted UniFrac (Operational taxonomy units (OTUs) level). The ellipses represent 95% confidence interval of standard error for a given group. The table in B4 summarizes permutational multivariate analysis of variance (PERMANOVA) results for distances for which significant results were obtained. R2 refers to the percentage of variability among samples’ microbiome that can be explained by that factor/metadata. Only significant comparisons are presented (* p < .05, ** p < .01 and *** p < .001)
Figure 4.
Figure 4.
Fungal microbiome results (British cohort). Samples were from stool (n = 63) and biopsies (n = 81): terminal ileum, transverse colon and sigmoid colon. A Taxonomy summary for stool at genus level. B Taxa differential analysis (CD vs Controls) at genus level. Results are presented according to sample type: B1: Terminal Ileum samples; B2: Transverse colon samples; B3: sigmoid colon samples; B4: stool. The bar charts show Log2 fold change in abundance between groups (y axis on the left and dark gray bar) and the mean abundance across all the samples (y axis on the right and light gray bar). Taxa increased in CD patients have bars with a red border, meanwhile taxa increased in controls have bars with a blue border. Detail of these results, including adjusted p values, is in Supplemental material 5
Figure 5.
Figure 5.
Results of the fungal microbiome analysis of the Dutch cohort comparing baseline samples (time point 1). Samples were grouped according to diagnosis: Crohn’s disease (CD, n = 26) and healthy controls (HC, n = 15). A Alpha diversity results (Operational taxonomy units (OTUs) level), three indices were considered: richness, Fisher alpha and Shannon. B Beta diversity results (OTUs level), clustering was made with Principal Coordinate Analysis (PCoA) using unweighted UniFrac distance. B1 samples grouped according to diagnosis. B2 yes = individuals given immunosuppressants (n = 11), no = individuals not taking the medication (n = 29). B3 yes = individuals given biologics (n = 12), no = individuals not taking the medication (n = 28). Permutational multivariate analysis of variance (PERMANOVA) results (R2 and p value) are reported in the bottom of each chart. C Taxonomy summary at genus level. D Taxa differential analysis, bar charts showing the OTUs that were significantly different between the two groups (HC and CD) and CD patients on Immunosuppressant (yes) vs CD patients that were not given the medication (no). The bar charts show Log2 fold change in abundance between groups (y axis on the left and dark gray bar) and the mean abundance across all the samples (y axis on the right and light gray bar). Detail of these results, including adjusted p values, is in Supplemental material 6
Figure 6.
Figure 6.
Results of the longitudinal analysis of the Dutch cohort; HC: T1 vs T2. RA: from remission to active, RR: stayed in remission. A Delta alpha diversity, average of changes in alpha diversity for each sample in each group. B Beta diversity (Principal Coordinate Analysis) describes the differences among samples/groups considering the species observed and their phylogeny (unweighted UniFrac distance). The link between points indicates that the two samples are from the same subject. The ellipses represent 95% confidence interval of standard error for a given group. PERMANOVA results (R2 and p value) are reported in the bottom of the PCoa chart. C Beta diversity distance describes the stability of the community during time within the same subject. A higher value indicates that there is less stability during time. Significant results are presented with an * (* p < .05, ** p < .01 and *** p < .001). D Beta-dispersion box plot comparing variance of samples from the group centroid, RA vs RR. E Taxa differential analysis, showing OTUs that were significantly different between RA and RR at time point 1 (E1) and RA and RR at time point 2 (E2). The bar charts show Log2 fold change in abundance between groups (y axis on the left and dark gray bar) and the mean abundance across all the samples (y axis on the right and light gray bar). Detail of these results, including adjusted p values, is in Supplemental material 6
Figure 7.
Figure 7.
Integration of metabolomics (volatile organic compounds, VOCs) and metagenomics (bacterial and fungi) data (Crohn’s disease (CD) vs Controls). 16S and 18S rRNA datasets were from transverse colon biopsy samples, and VOCs from stool samples. Samples groups were CD (n = 9) vs Controls (n = 7). A three omics sample plots are shown separately. B Pearson’s correlation of the three data set for component 1. C variables contributing to component 1

References

    1. Segal JP, Mullish BH, Quraishi MN, Acharjee A, Williams HRT, Iqbal T, Hart AL, Marchesi JR.. The application of omics techniques to understand the role of the gut microbiota in inflammatory bowel disease. Therap Adv Gastroenterol. 2019;12:1–21. doi:10.1177/1756284818822250. - DOI - PMC - PubMed
    1. Ye BD, McGovern DPB. Genetic variation in IBD: progress, clues to pathogenesis and possible clinical utility. Expert Rev Clin Immunol. 2016;12:1091–1107. doi:10.1080/1744666X.2016.1184972. - DOI - PMC - PubMed
    1. Barreiro-de Acosta M, Alvarez Castro A, Souto R, Iglesias M, Lorenzo A, Dominguez-Muñoz JE. Emigration to western industrialized countries: a risk factor for developing inflammatory bowel disease. J Crohn’s Colitis. 2011;5:566–569. doi:10.1016/j.crohns.2011.05.009. - DOI - PubMed
    1. David LA, Maurice CF, Carmody RN, Gootenberg DB, Button JE, Wolfe BE, Ling AV, Devlin AS, Varma Y, Fischbach MA, et al. Diet rapidly and reproducibly alters the human gut microbiome. Nature. 2014;505:559–563. doi:10.1038/nature12820. - DOI - PMC - PubMed
    1. Ahmed I, Greenwood R, Costello B, Ratcliffe N, Probert CS. Investigation of faecal volatile organic metabolites as novel diagnostic biomarkers in inflammatory bowel disease. Aliment Pharmacol Ther. 2016;43:596–611. doi:10.1111/apt.13522. - DOI - PubMed

Publication types