

Trends in Patient Volume by Hospital Type and the Association of These Trends With Time to Cancer Treatment Initiation
- PMID: 34241630
- PMCID: PMC8271360
- DOI: 10.1001/jamanetworkopen.2021.15675
Trends in Patient Volume by Hospital Type and the Association of These Trends With Time to Cancer Treatment Initiation
Abstract
Importance: Increasing demand for cancer care may be outpacing the capacity of hospitals to provide timely treatment, particularly at referral centers such as National Cancer Institute (NCI)-designated and academic centers. Whether the rate of patient volume growth has strained hospital capacity to provide timely treatment is unknown.
Objective: To evaluate trends in patient volume by hospital type and the association between a hospital's annual patient volume growth and time to treatment initiation (TTI) for patients with cancer.
Design, setting, and participants: This retrospective, hospital-level, cross-sectional study used longitudinal data from the National Cancer Database from January 1, 2007, to December 31, 2016. Adult patients older than 40 years who had received a diagnosis of 1 of the 10 most common incident cancers and initiated their treatment at a Commission on Cancer-accredited hospital were included. Data were analyzed between December 19, 2019, and March 27, 2020.
Exposures: The mean annual rate of patient volume growth at a hospital.
Main outcomes and measures: The main outcome was TTI, defined as the number of days between diagnosis and the first cancer treatment. The association between a hospital's mean annual rate of patient volume growth and TTI was assessed using a linear mixed-effects model containing a patient volume × time interaction. The mean annual change in TTI over the study period by hospital type was estimated by including a hospital type × time interaction term.
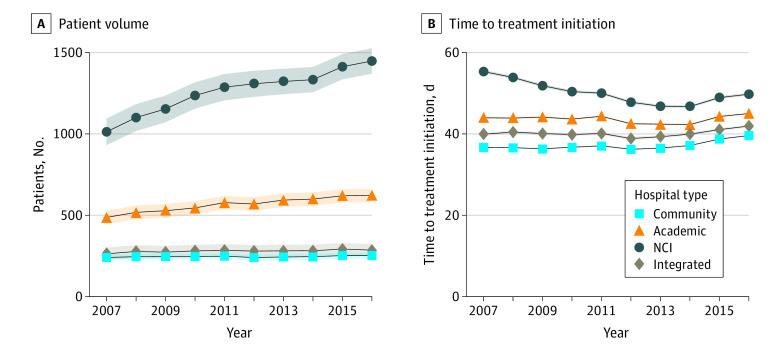
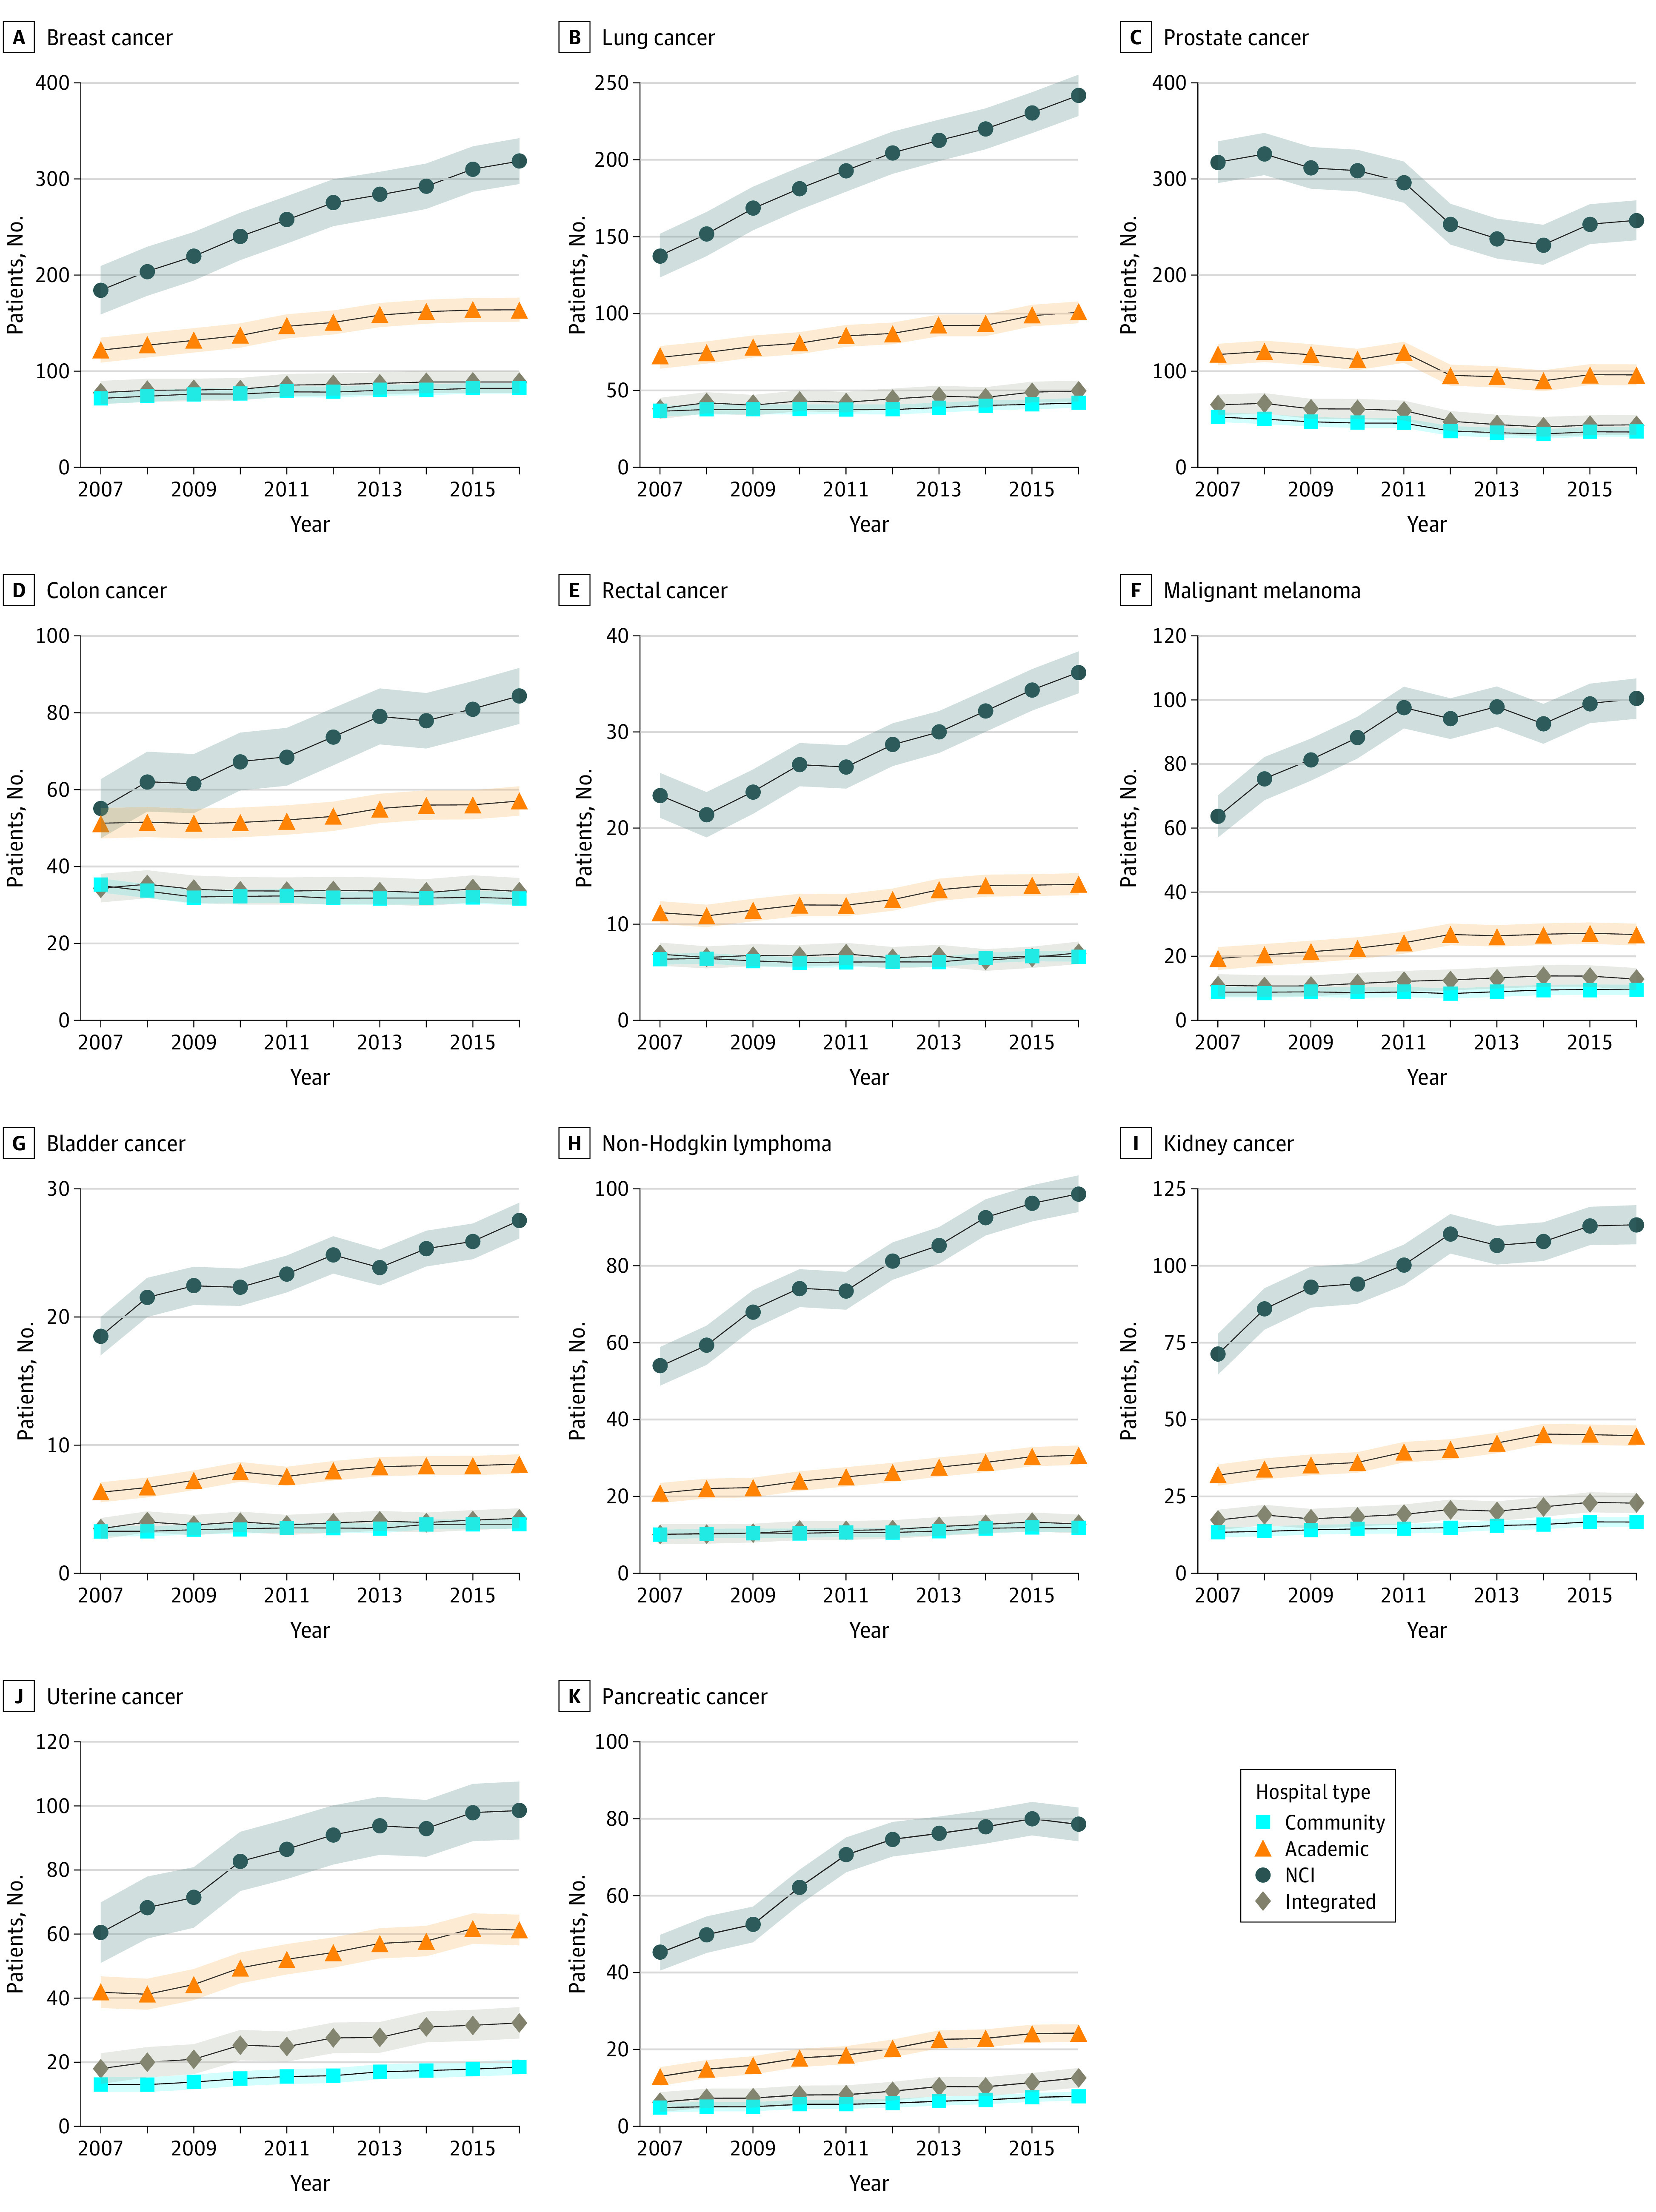
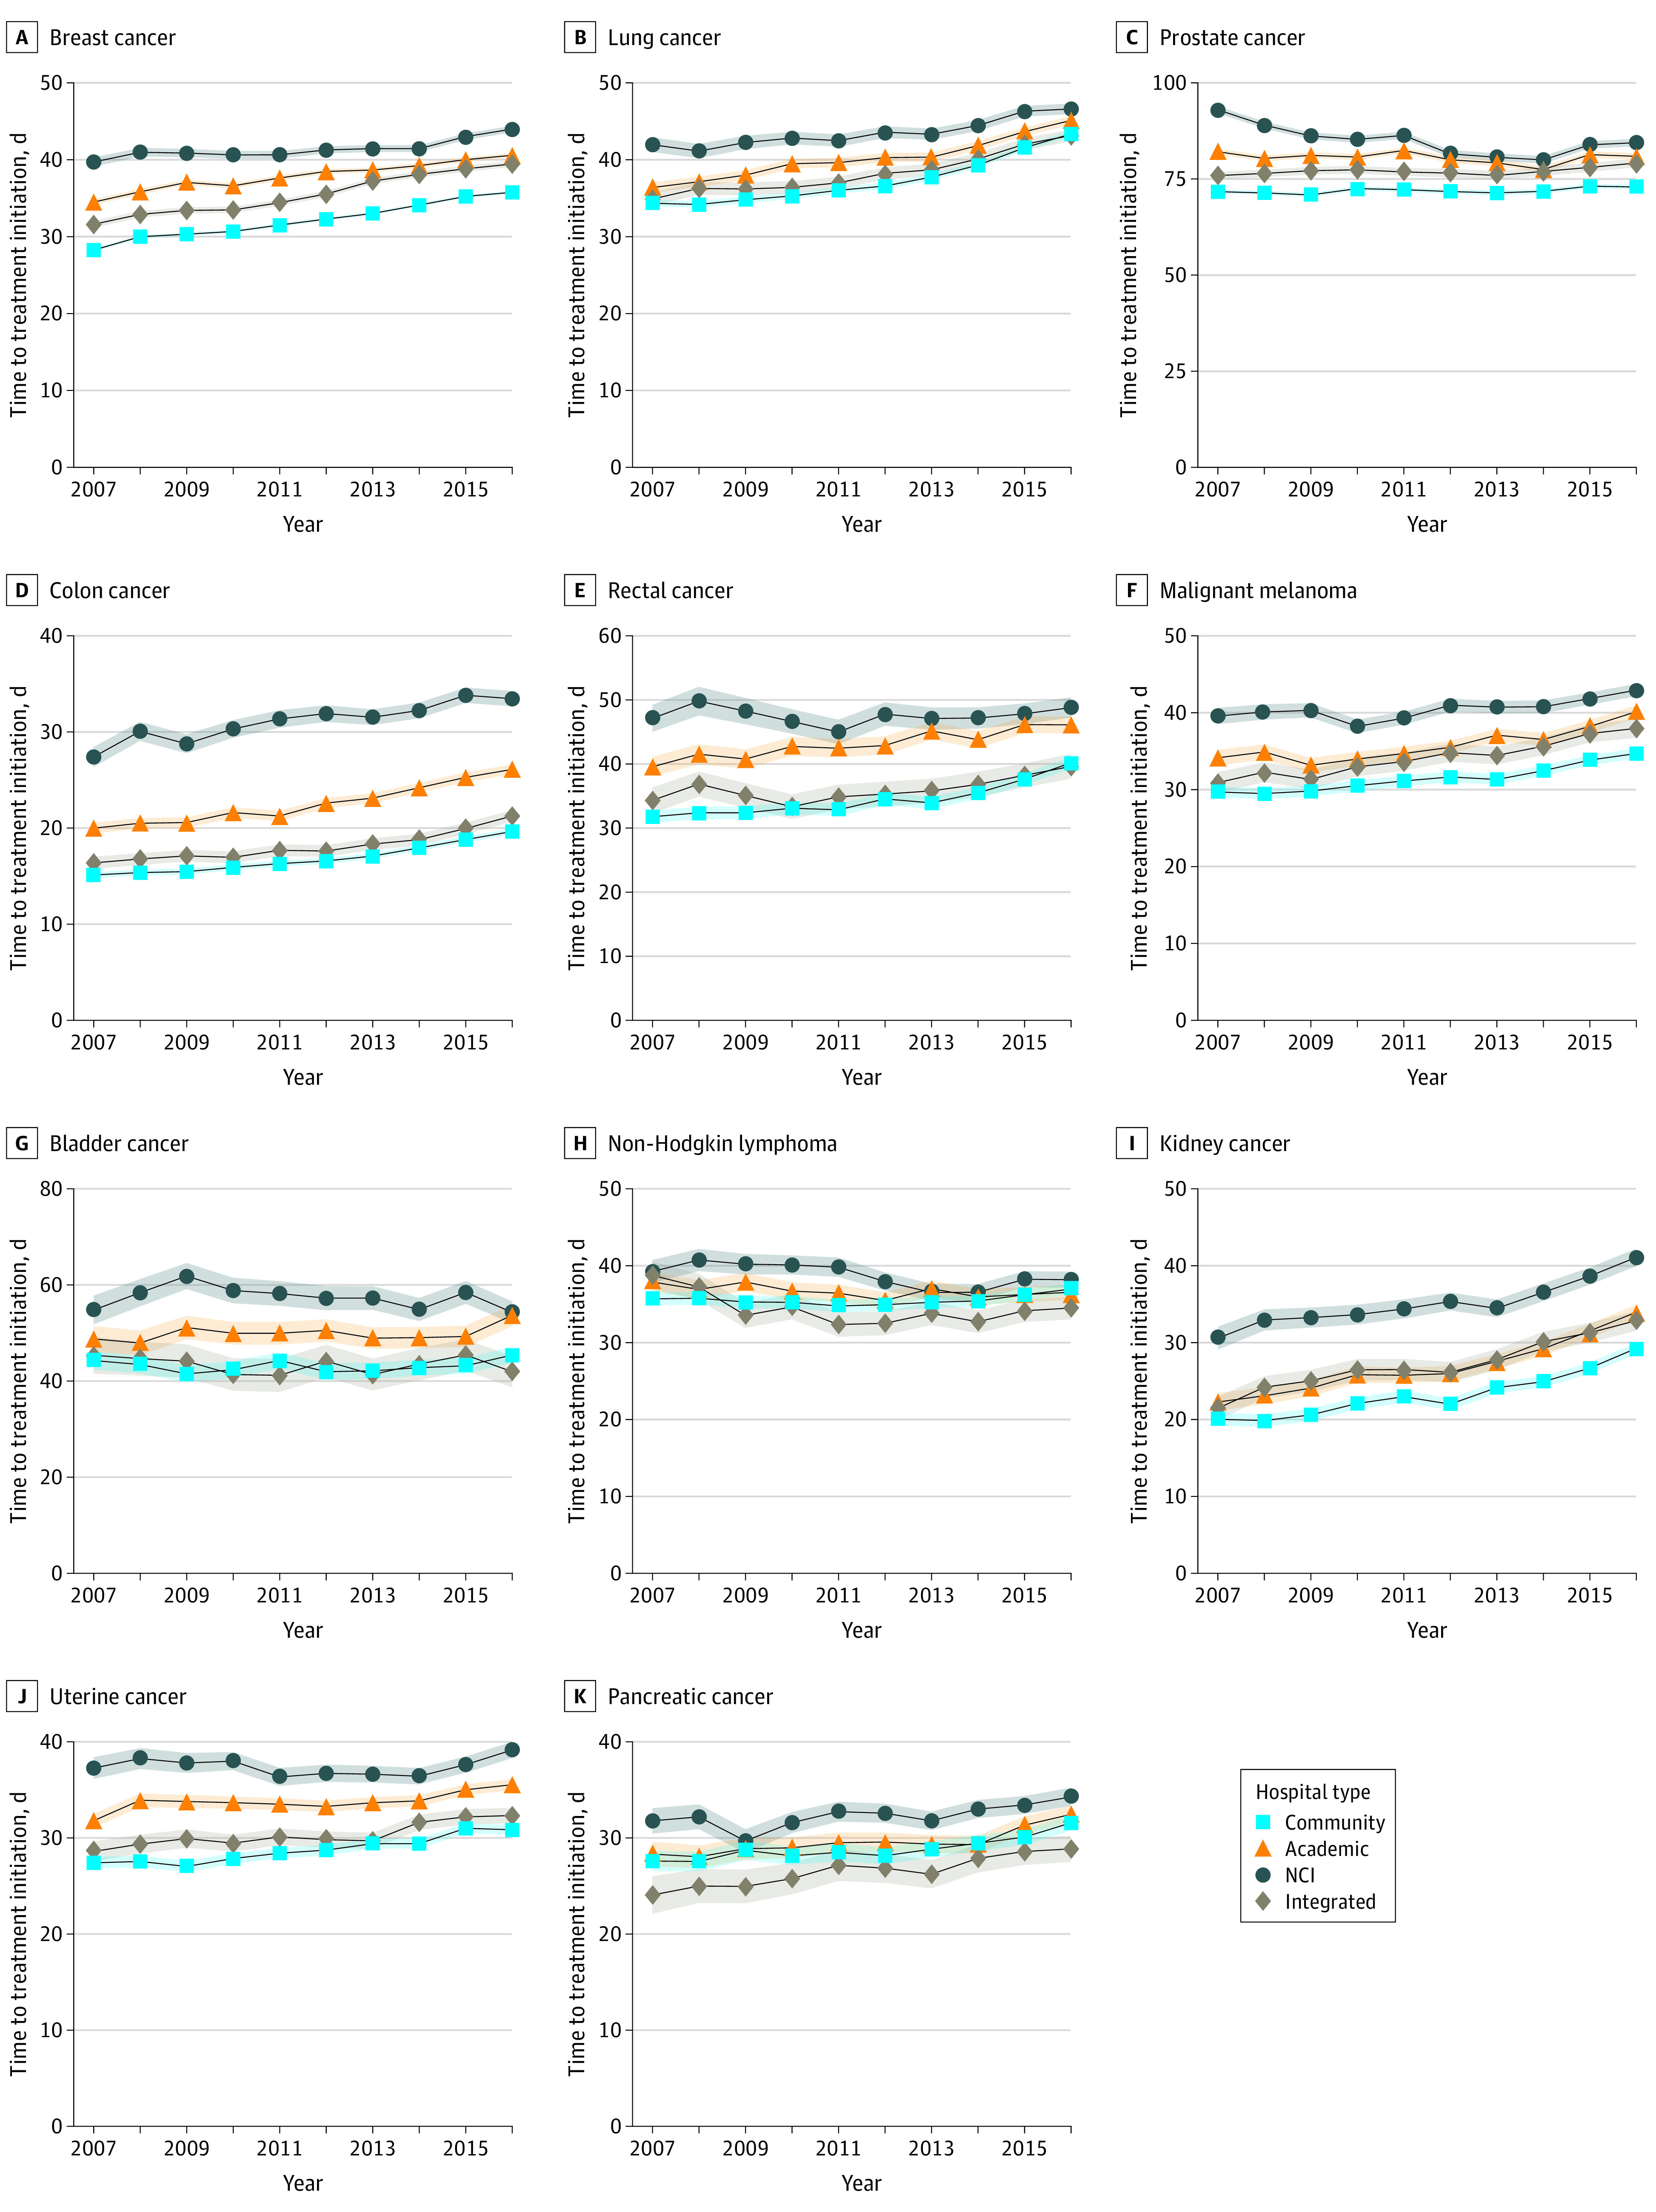
Results: The study sample included 4 218 577 patients (mean [SD] age, 65.0 [11.4] years; 56.6% women) treated at 1351 hospitals. From 2007 to 2016, patient volume increased 40% at NCI centers, 25% at academic centers, and 8% at community hospitals. In 2007, the mean TTI was longer at NCI and academic centers than at community hospitals (NCI: 50 days [95% CI, 48-52 days]; academic: 43 days [95% CI, 42-44 days]; community: 37 days [95% CI, 36-37 days]); however, the mean annual increase in TTI was greater at community hospitals (0.56 days; 95% CI, 0.49-0.62 days) than at NCI centers (-0.73 days; 95% CI, -0.95 to -0.51 days) and academic centers (0.14 days; 95% CI, 0.03-0.26 days). An annual volume growth rate of 100 patients, a level observed at less than 1% of hospitals, was associated with a mean increase in TTI of 0.24 days (95% CI, 0.18-0.29 days).
Conclusions and relevance: In this cross-sectional study, from 2007 to 2016, across the studied cancer types, patients increasingly initiated their cancer treatment at NCI and academic centers. Although increases in patient volume at these centers outpaced that at community hospitals, faster growth was not associated with clinically meaningful treatment delays.
Conflict of interest statement
Figures
Comment in
-
Can the Health Care System Manage Increased Workloads From Expanded Access to Cancer Treatment?JAMA Netw Open. 2021 Jul 1;4(7):e2115763. doi: 10.1001/jamanetworkopen.2021.15763. JAMA Netw Open. 2021. PMID: 34241633 No abstract available.
References
Publication types
MeSH terms
Grants and funding
LinkOut - more resources
Full Text Sources
Medical
