. 2021 Jul 9;16(7):e0254007.
doi: 10.1371/journal.pone.0254007. eCollection 2021.

Text classification to streamline online wildlife trade analyses

Affiliations

Text classification to streamline online wildlife trade analyses

Oliver C Stringham et al. PLoS One. .

Abstract

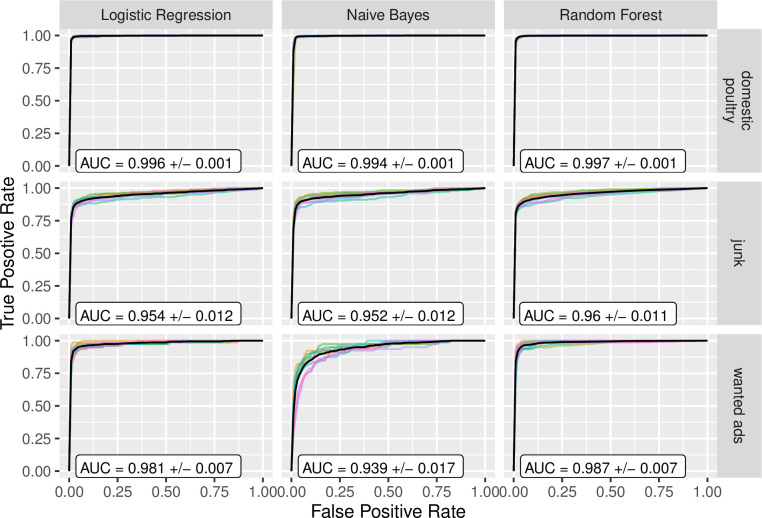
Automated monitoring of websites that trade wildlife is increasingly necessary to inform conservation and biosecurity efforts. However, e-commerce and wildlife trading websites can contain a vast number of advertisements, an unknown proportion of which may be irrelevant to researchers and practitioners. Given that many wildlife-trade advertisements have an unstructured text format, automated identification of relevant listings has not traditionally been possible, nor attempted. Other scientific disciplines have solved similar problems using machine learning and natural language processing models, such as text classifiers. Here, we test the ability of a suite of text classifiers to extract relevant advertisements from wildlife trade occurring on the Internet. We collected data from an Australian classifieds website where people can post advertisements of their pet birds (n = 16.5k advertisements). We found that text classifiers can predict, with a high degree of accuracy, which listings are relevant (ROC AUC ≥ 0.98, F1 score ≥ 0.77). Furthermore, in an attempt to answer the question 'how much data is required to have an adequately performing model?', we conducted a sensitivity analysis by simulating decreases in sample sizes to measure the subsequent change in model performance. From our sensitivity analysis, we found that text classifiers required a minimum sample size of 33% (c. 5.5k listings) to accurately identify relevant listings (for our dataset), providing a reference point for future applications of this sort. Our results suggest that text classification is a viable tool that can be applied to the online trade of wildlife to reduce time dedicated to data cleaning. However, the success of text classifiers will vary depending on the advertisements and websites, and will therefore be context dependent. Further work to integrate other machine learning tools, such as image classification, may provide better predictive abilities in the context of streamlining data processing for wildlife trade related online data.


Conflict of interest statement

The authors have declared that no competing interests exist.

Figures

Fig 1
Fig 1. Model evaluation metrics for text classifiers.
Evaluation metrics (rows) are derived from 10 cross-validation folds using different text classifiers evaluated for three different labels (columns). See S1 Appendix for more information and calculation of the evaluation metrics and S2 Appendix for exact metric values.
Fig 2
Fig 2. Receiver operating characteristic curves and the area under the curve (ROC AUC).
Three different text classifiers (columns) were tested across three different labels (rows). For each panel, each line represents one cross-validation fold and the solid black line represents the average across all cross-validation folds. Average AUC (area under curve) values are reported with standard deviation.
Fig 3
Fig 3. Precision recall curves and the area under the curve (PR AUC).
Three different text classifiers (columns) were tested across three different labels (rows). For each panel, each line represents one cross-validation fold and the solid black line represents the average across all cross-validation folds. Average AUC (area under curve) values are reported with standard deviation.
Fig 4
Fig 4. Word clouds of top features of text classifiers.
Top words (i.e., features or grams) shown for each label (rows) and classifier (columns). The size of the word corresponds to importance, where larger words indicate higher importance. Note that words are stemmed (e.g., condition is stemmed to condit).
Fig 5
Fig 5. The effects of reducing sample size on text-classifier model performance.
Top row: The F1 score evaluated at decreasing sample size (training set) values. Ribbons represent the 95% quantile range from 100 iterations of 10-fold cross validation logistic regression text classification, repeated for each specified label (‘domestic poultry’, ‘junk’, and ‘wanted’). Bottom row: The proportion of the maximum F1 score, evaluated at each sample size, for each label. Only the median value was considered. The red horizontal line represents 0.99 of the maximum F1 score.

References

    1. Smith KF, Behrens M, Schloegel LM, Marano N, Burgiel S, Daszak P. Reducing the Risks of the Wildlife Trade. Science. 2009;324: 594–595. doi: 10.1126/science.1174460 - DOI - PubMed
    1. Scheffers BR, Oliveira BF, Lamb I, Edwards DP. Global wildlife trade across the tree of life. Science. 2019;366: 71–76. doi: 10.1126/science.aav5327 - DOI - PubMed
    1. Jarić I, Correia RA, Brook BW, Buettel JC, Courchamp F, Di Minin E, et al.. iEcology: Harnessing Large Online Resources to Generate Ecological Insights. Trends Ecol Evol. 2020;35: 630–639. doi: 10.1016/j.tree.2020.03.003 - DOI - PubMed
    1. Siriwat P, Nijman V. Wildlife trade shifts from brick-and-mortar markets to virtual marketplaces: A case study of birds of prey trade in Thailand. J Asia-Pac Biodivers. 2020. doi: 10.1016/j.japb.2020.03.012 - DOI - PMC - PubMed
    1. Sung Y-H, Fong JJ. Assessing consumer trends and illegal activity by monitoring the online wildlife trade. Biol Conserv. 2018;227: 219–225. doi: 10.1016/j.biocon.2018.09.025 - DOI

Publication types