. 2021 Jul 13;36(2):109391.
doi: 10.1016/j.celrep.2021.109391. Epub 2021 Jun 26.

Antibody landscape against SARS-CoV-2 reveals significant differences between non-structural/accessory and structural proteins

Affiliations

Antibody landscape against SARS-CoV-2 reveals significant differences between non-structural/accessory and structural proteins

Yang Li et al. Cell Rep. .

Abstract

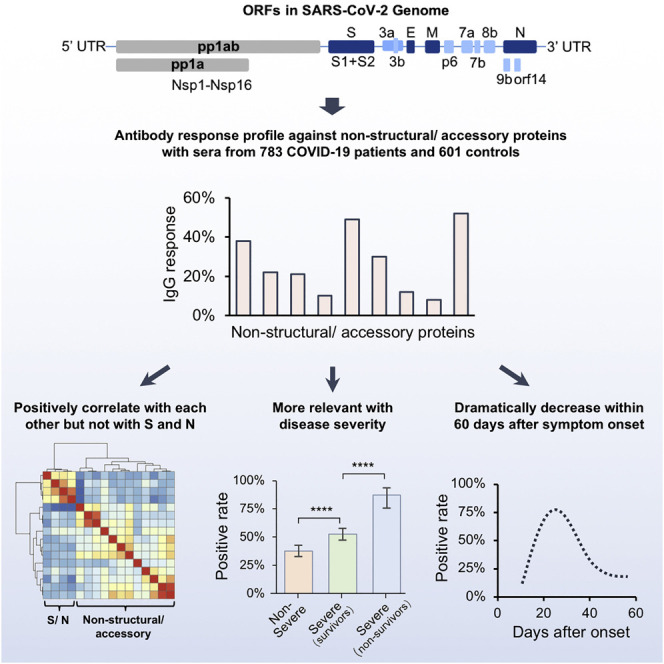
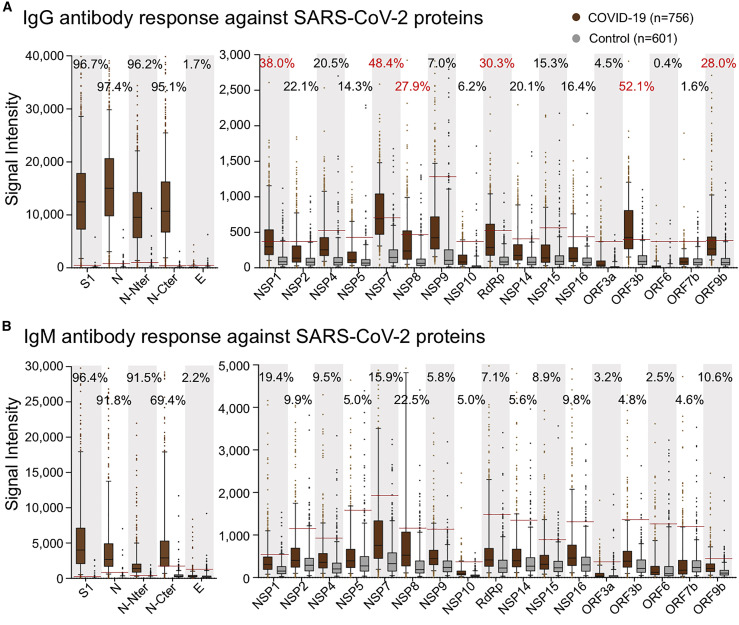
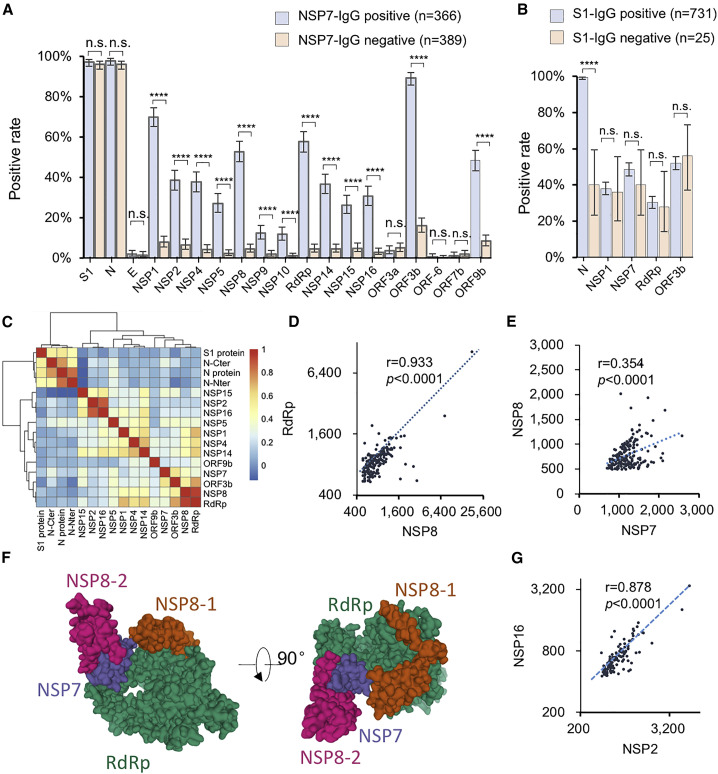
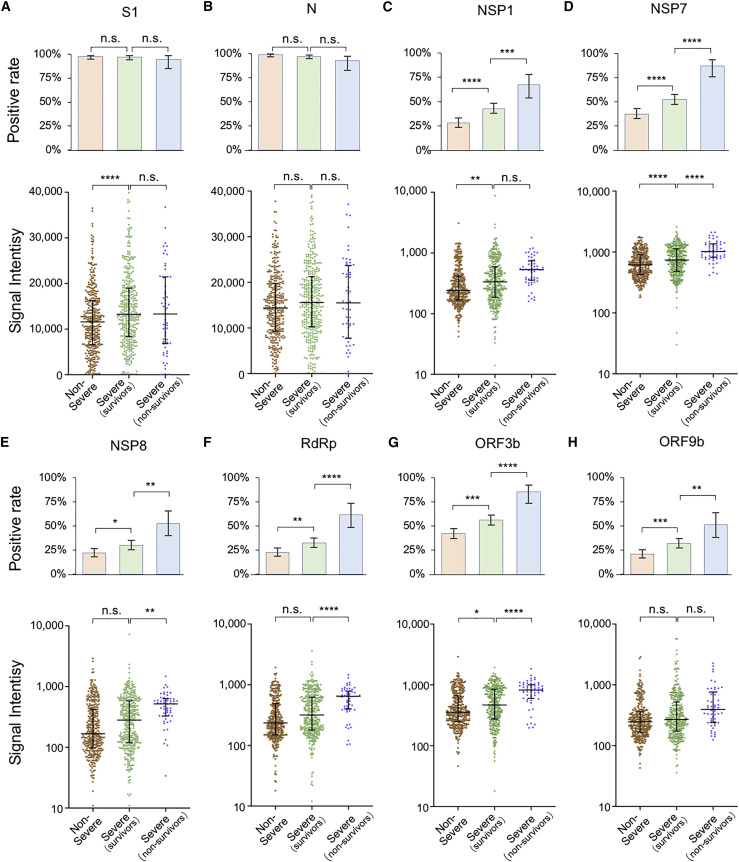
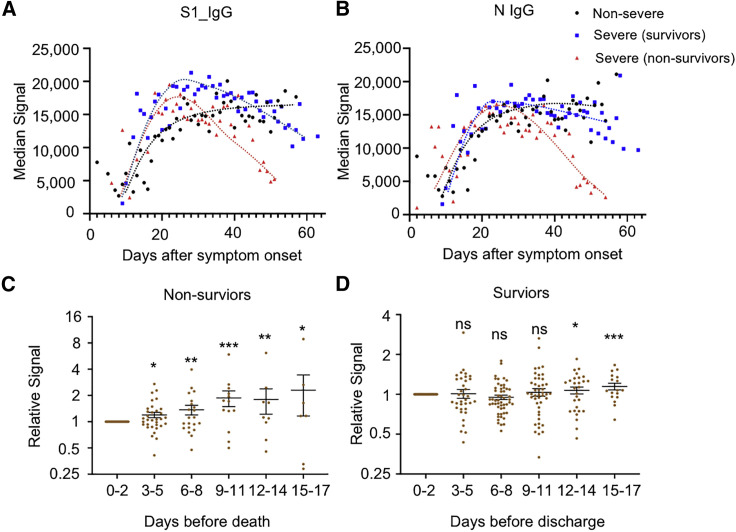
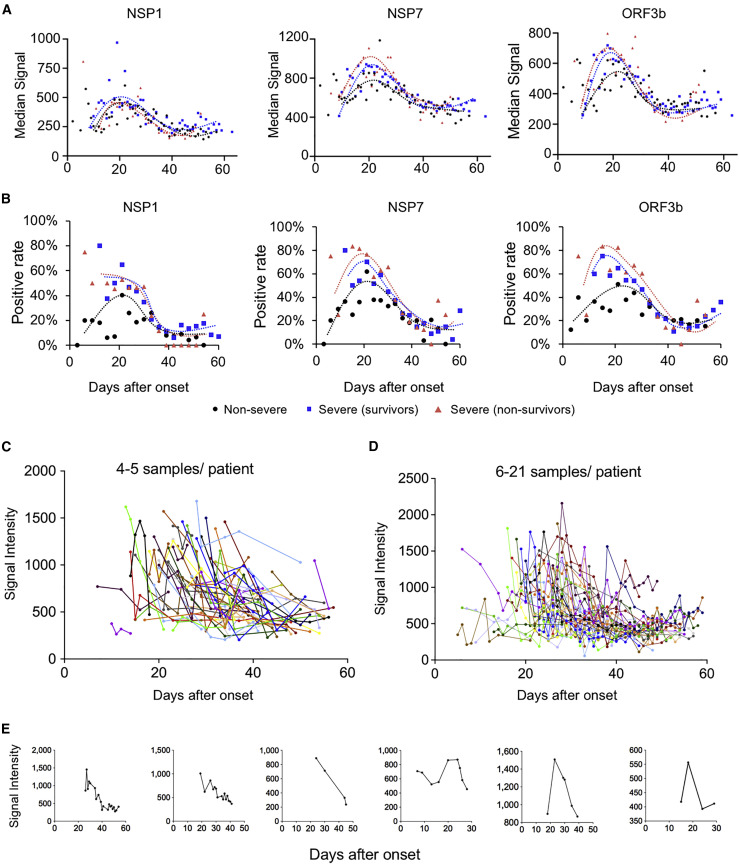
The immunogenicity of the SARS-CoV-2 proteome is largely unknown, especially for non-structural proteins and accessory proteins. In this study, we collect 2,360 COVID-19 sera and 601 control sera. We analyze these sera on a protein microarray with 20 proteins of SARS-CoV-2, building an antibody response landscape for immunoglobulin (Ig)G and IgM. Non-structural proteins and accessory proteins NSP1, NSP7, NSP8, RdRp, ORF3b, and ORF9b elicit prevalent IgG responses. The IgG patterns and dynamics of non-structural/accessory proteins are different from those of the S and N proteins. The IgG responses against these six proteins are associated with disease severity and clinical outcome, and they decline sharply about 20 days after symptom onset. In non-survivors, a sharp decrease of IgG antibodies against S1 and N proteins before death is observed. The global antibody responses to non-structural/accessory proteins revealed here may facilitate a deeper understanding of SARS-CoV-2 immunology.

Keywords: COVID-19; SARS-CoV-2; humoral immunity; immune response; non-structural/accessory proteins; proteome microarray.


Conflict of interest statement

Declaration of interests The authors declare no competing interests.

Figures

None
Graphical abstract
Figure 1
Figure 1
Antibody response landscape against SARS-CoV-2 proteins (A and B) IgG (A) and IgM (B) responses against each SARS-CoV-2 protein are depicted as boxplots according to the signal intensity of each sample on the proteome microarray. The data are presented as median with quintiles and the hinges (n = 756). Cutoff values (the red line) for each protein were set as mean + 2 × SD of the control group (n = 601). The positive rates of the patient group were labeled for each protein; positive rates >25% are labeled as red.
Figure 2
Figure 2
Antibodies against structural proteins and other proteins are in different patterns (A) Antibody-positive rates for the SARS-CoV-2 proteins in two patient groups divided according to NSP7 IgG signal, either positive or negative. (B) Antibody-positive rates for selected proteins in two patient groups; the patient groups were divided according to the S1 IgG signal, either positive or negative. (C) The Pearson correlation coefficients of the IgG responses among the proteins were calculated and clustered. (D and E) Correlations of the IgG responses against RdRp and NSP8 (D) and NSP8 and NSP7 (E). (F) Location and accessibility of NSP7, NSP8, and RdRp in the SARS-CoV-2 RNA polymerase complex (PDB: 7BV1). (G) Correlations of the IgG responses against NSP2 and NSP16. For (A) and (B), the error bar is given as the 95% confidential interval. p values were calculated by a two-sided χ2 test. p < 0.05, ∗∗p < 0.01, ∗∗∗p < 0.001, ∗∗∗∗p < 0.0001; n.s., not significant.
Figure 3
Figure 3
IgG responses are associated with disease severity (A–H) IgG-positive rate and signal intensity distribution among three patient groups, i.e., non-severe, severe (survivors), and severe (non-survivors) patients for S1 (A), N protein (B), NSP1 (C), NSP7 (D), NSP8 (E), RdRp (F), ORF3b (G), and ORF9b (H). For positive rate analyses, the error bar is given as the 95% confidential interval. The p values were calculated by a two-sided χ2 test. p < 0.05, ∗∗p < 0.01, ∗∗∗p < 0.001, ∗∗∗∗p < 0.0001; n.s., not significant. For signal intensity analysis, the middle line is the median value; the upper and lower hinges are the values of the 75% and 25% percentile. The p value was calculated by a two-sided t test.
Figure 4
Figure 4
S1 and N IgG decrease several days before death in non-survivors (A and B) The trends of median signal intensities of IgG at different time points for S1 (A) and N (B), among three sample groups, i.e., non-severe, severe (survivors), and severe (non-survivors). Samples were grouped per day, and the time points with a sample number less than four were excluded due to lack of statistical significance. (C and D) Relative S1 IgG signal levels were calculated for each patient by dividing the signal intensity of the samples collected at other time points versus samples collected at 0–2 days before the death of non-survivors (C, n = 35) or the discharge of survivors (D, n = 108). The samples were grouped per 3 days. For each patient, the signals were averaged when there was more than one sample during each 3-day period. The p values were calculated by a two-sided t test between the indicated group and the first group (0–2 days). p < 0.05, ∗∗p < 0.01, ∗∗∗p < 0.001; n.s., not significant.
Figure 5
Figure 5
Antibody responses against non-structural proteins and accessory proteins decrease rapidly after 20 days of symptom onset (A) Trends of median signal intensities of IgG at different time points for NSP1, NSP7, and ORF3b among three samples groups, i.e., non-severe, severe (survivors), and severe (non-survivors). Samples were grouped per day, and the points with sample number less than four were excluded. (B) Trends of positive rate of IgG at different time points for NSP1, NSP7, and ORF3b among three samples groups, i.e., non-severe, severe (survivors), and severe (non-survivors). Samples were grouped per 3 days. (C–E) NSP7-IgG signal dynamic changes for the patients with four to five samples (C) or more samples (D) or for some representative individuals (E). Each line represents one person.

Similar articles

Cited by

References

    1. Azkur A.K., Akdis M., Azkur D., Sokolowska M., van de Veen W., Brüggen M.C., O’Mahony L., Gao Y., Nadeau K., Akdis C.A. Immune response to SARS-CoV-2 and mechanisms of immunopathological changes in COVID-19. Allergy. 2020;75:1564–1581. - PMC - PubMed
    1. Cyster J.G., Allen C.D.C. B cell responses: cell interaction dynamics and decisions. Cell. 2019;177:524–540. - PMC - PubMed
    1. Dong E., Du H., Gardner L. An interactive web-based dashboard to track COVID-19 in real time. Lancet Infect. Dis. 2020;20:533–534. - PMC - PubMed
    1. Finkel Y., Mizrahi O., Nachshon A., Weingarten-Gabbay S., Morgenstern D., Yahalom-Ronen Y., Tamir H., Achdout H., Stein D., Israeli O. The coding capacity of SARS-CoV-2. Nature. 2021;589:125–130. - PubMed
    1. Gao Y., Yan L., Huang Y., Liu F., Zhao Y., Cao L., Wang T., Sun Q., Ming Z., Zhang L. Structure of the RNA-dependent RNA polymerase from COVID-19 virus. Science. 2020;368:779–782. - PMC - PubMed

Publication types