Review
. 2021 Jul 14;29(7):1093-1110.
doi: 10.1016/j.chom.2021.05.012. Epub 2021 Jun 3.

HIV-1 and SARS-CoV-2: Patterns in the evolution of two pandemic pathogens

Collaborators, Affiliations
Review

HIV-1 and SARS-CoV-2: Patterns in the evolution of two pandemic pathogens

Will Fischer et al. Cell Host Microbe. .

Abstract

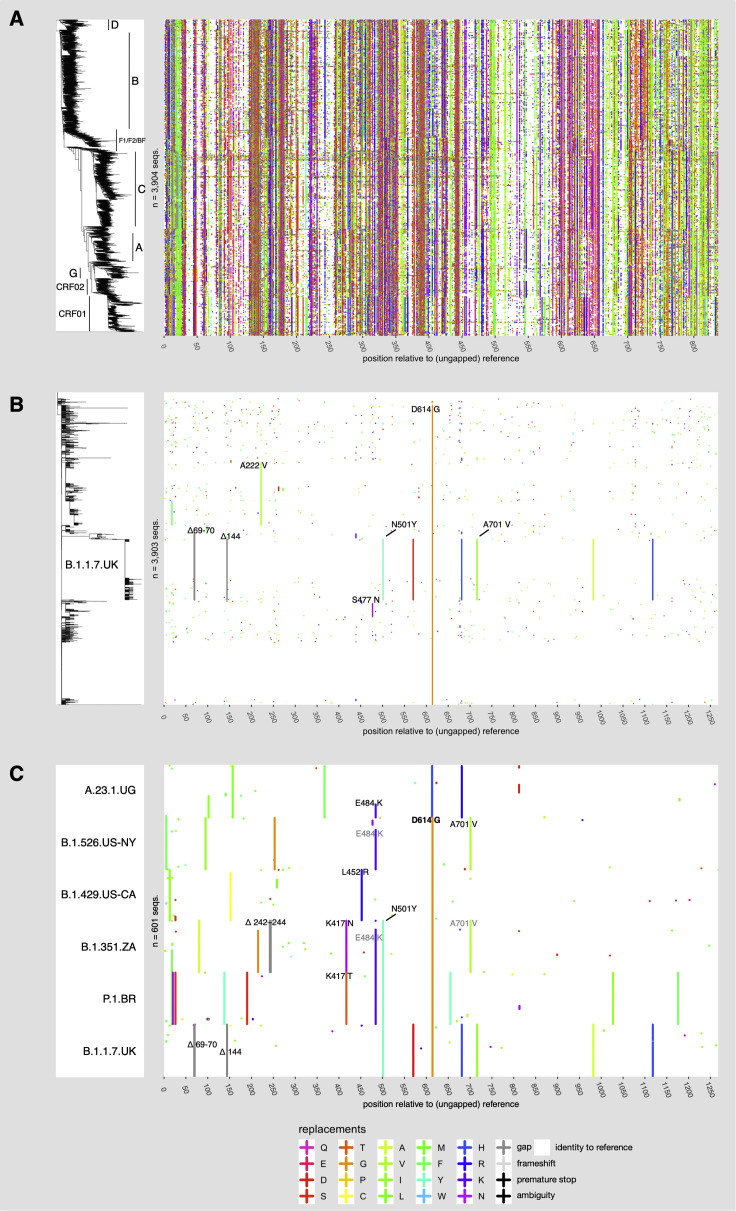
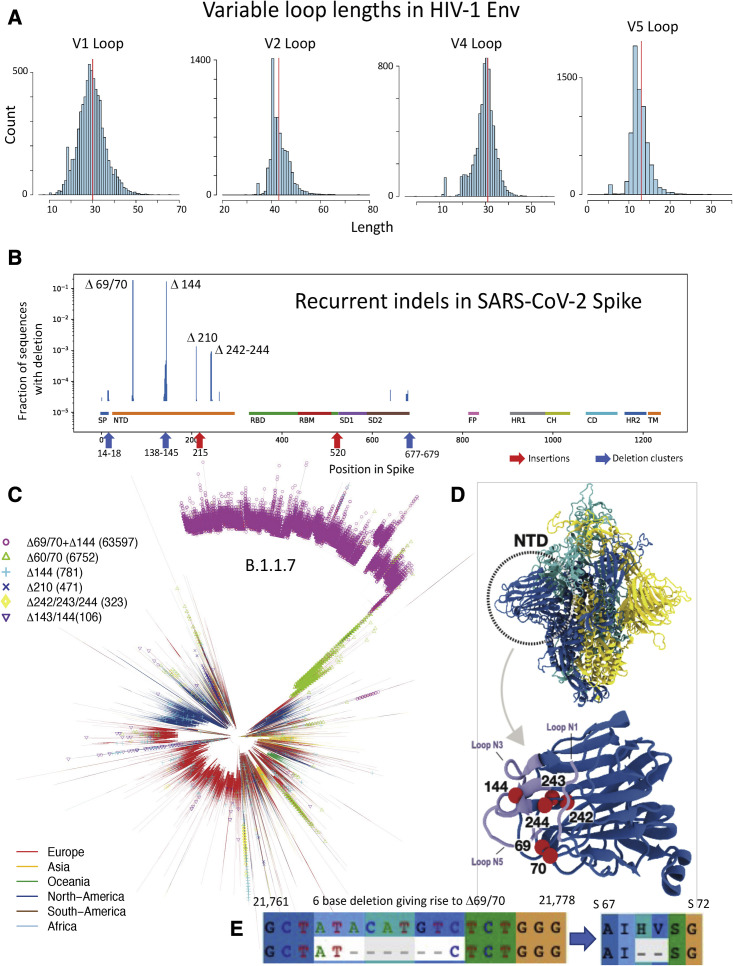
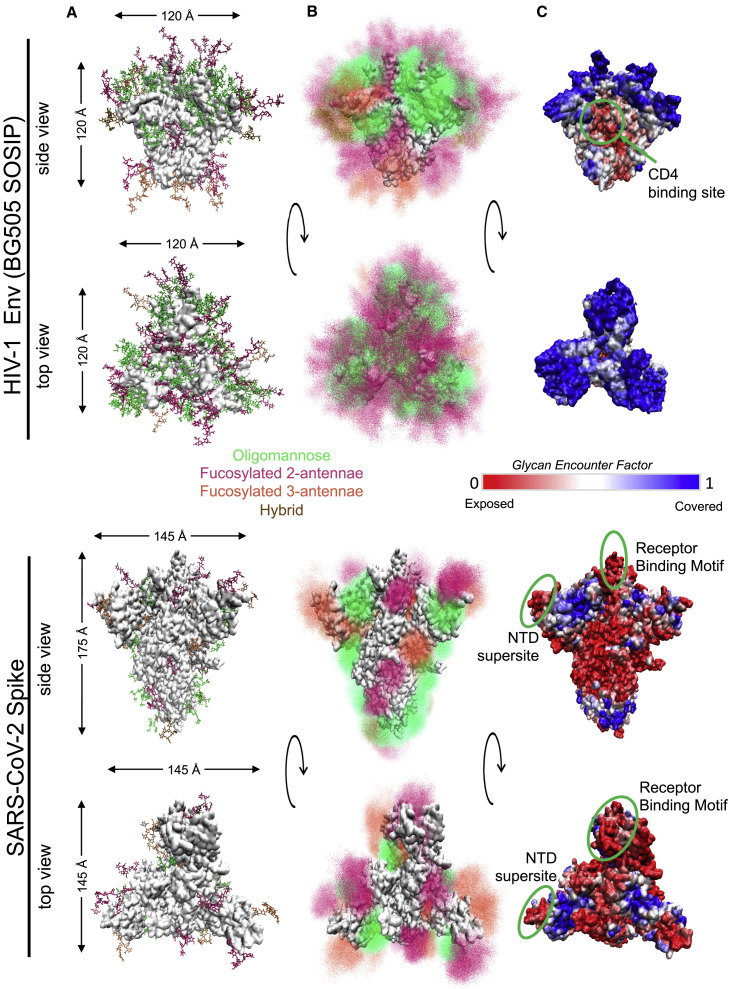
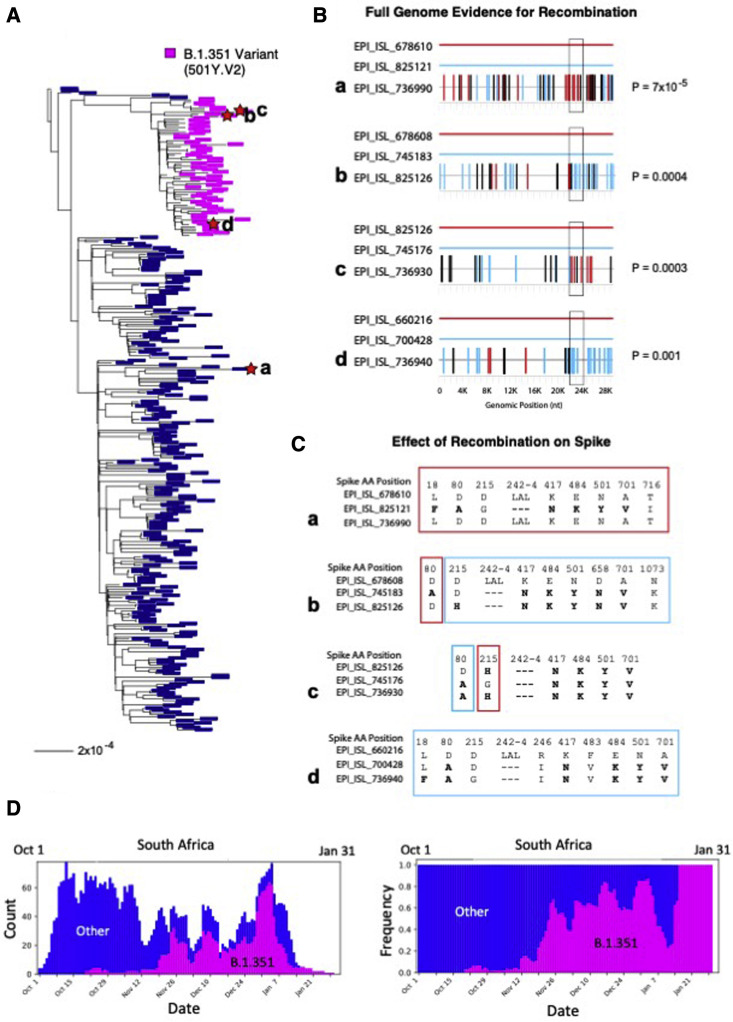
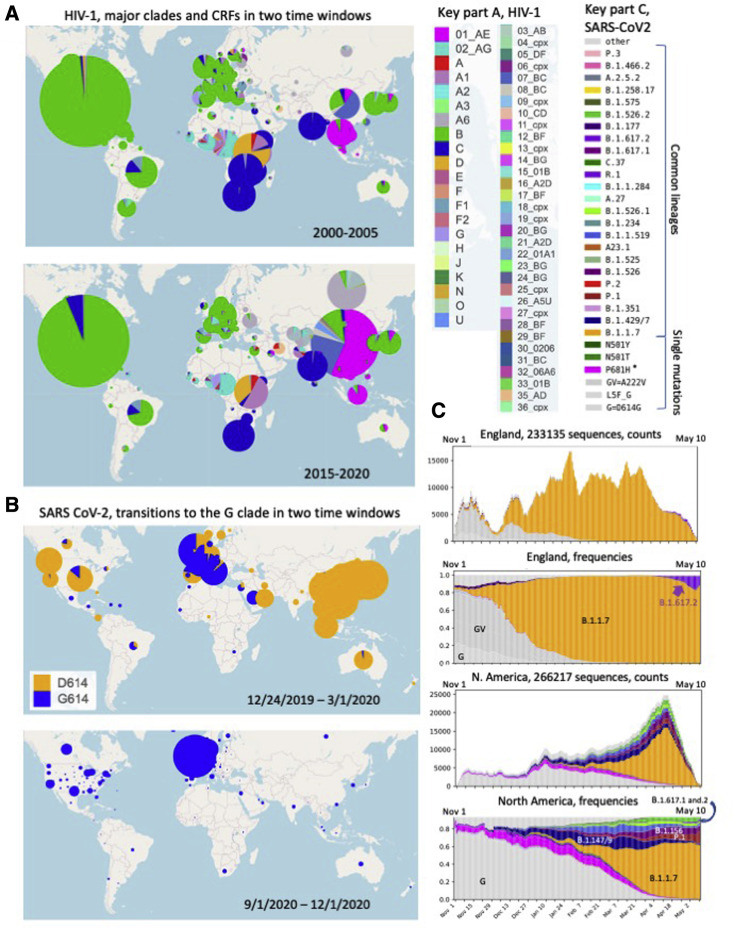
Humanity is currently facing the challenge of two devastating pandemics caused by two very different RNA viruses: HIV-1, which has been with us for decades, and SARS-CoV-2, which has swept the world in the course of a single year. The same evolutionary strategies that drive HIV-1 evolution are at play in SARS-CoV-2. Single nucleotide mutations, multi-base insertions and deletions, recombination, and variation in surface glycans all generate the variability that, guided by natural selection, enables both HIV-1's extraordinary diversity and SARS-CoV-2's slower pace of mutation accumulation. Even though SARS-CoV-2 diversity is more limited, recently emergent SARS-CoV-2 variants carry Spike mutations that have important phenotypic consequences in terms of both antibody resistance and enhanced infectivity. We review and compare how these mutational patterns manifest in these two distinct viruses to provide the variability that fuels their evolution by natural selection.

Keywords: HIV-1; SARS-CoV-2; evolution; glycosylation; immune escape; insertions and deletions; recombination.


Conflict of interest statement

Declaration of interests B.K., W.F., J.T., T.B., and S.G. have provisional patents and patents relating to vaccine design to address viral diversity as applied to HIV-1 and/or SARS-CoV-2.

Figures

Figure 1
Figure 1
Variability of HIV-1 and SARS-CoV-2 docking/fusion proteins Right panel: Variant-visualized amino-acid sequence alignments of HIV-1 Env (A) and SARS-CoV-2 Spike (B and C). The colored panels are a matrix in which each row represents a single sequence, and the columns are positions in a sequence alignment, where colored marks (“+”) denote positions that vary compared to a reference sequence and reference-identical positions are white. A consensus sequence based on the most common base in each position serves as the reference for HIV-1 Env, and the outbreak strain (NC_045512) is the reference sequence for the SARS-CoV-2 Spike. Amino acid colors are based on Taylor (1997). Sequences are ordered top to bottom according to the phylogenetic tree in the left panel. Each phylogenetic tree is derived from a whole-genome nucleotide alignment: an approximation to the maximum-likelihood tree, generated with RAxML-NG (Kozlov et al., 2019) for HIV-1 Env (A) and a parsimony tree generated with TNT (Goloboff and Catalano, 2016) for SARS-CoV-2 Spike (B). As a consequence, continuous vertical stripes indicate lineage-specific mutations that are shared by related sequences (see text). Variant amino acids for the 100 most recent sequences (as of 2020-03-07) of 6 SARS-CoV-2 lineages with multiple Spike mutations, including 5 VOC/VOIs, are shown in (C). Mutations of particular interest that are discussed in the text are labeled in (B) and (C). The SARS-CoV-2 sequence data in this figure used data from the GISAID 2021-02-25 release date, “near-complete” alignment as described in Korber et al., (2020b); alignment statistics at https://cov.lanl.gov/.
Figure 2
Figure 2
Distributions of Env loop lengths in HIV-1 and indel lengths and positions in SARS-CoV-2 (A) The distribution of hypervariable loop lengths (for loops V1, V2, V4, and V5) from the global Env sequence alignment from the HIV-1 database (1 sequence per individual). Hypervariable region lengths are calculated via the HIV-1 Los Alamos Database (https://cov.lanl.gov/) “Variable Region Characteristics” web interface; net charge and number of potential N-linked glycosylation sites can also be calculated using this tool. (B) Frequencies of Spike indels from the GISAID 1-March-2021 release. A log scale is used, as most indels are quite rare except Δ69/70 and Δ144, which are common because they are present in the highly sampled B.1.1.7 lineage. Both, however, are also frequently sampled in other contexts: Δ69/70 was found an additional 10,168 times and Δ144 an additional 1,513 times. Focused regions of rare but recurring indels are highlighted here, and details are provided in Figures S1 and S2. The different regions in Spike are highlighted and include: the signal peptide (SP), the N-terminal domain (NTD), the receptor binding domain (RBD) and motif (RBM), subdomain 1 and 2 (SD1 and SD2), the fusion peptide (FP), heptad repeat 1 and 2 (HR1 and HR2), the central helix (CH), and the connecting domain (CD) and the transmembrane region (TM). (C) A parsimony tree based on the cov.lanl.gov 17-March-2021 full-genome alignment (inferred with TNT 1.5; Goloboff and Catalano, 2016), showing the recurrence of the most common indel patterns in multiple lineages in the phylogeny. Branches are colored by the geographic region of the viral sample to illustrate that these mutations are geographically as well as phylogenetically dispersed. (D) Structural representation of the SARS-CoV-2 Spike trimer, with three protomers shown in light blue, yellow, and cyan. Dashed circle indicates the NTD domain of one protomer. In the (lower) close-up view of NTD, the positions of the most common deletions—69/70, 144, and 242–244—are depicted as red beads. Residues shown in light blue are loops N1 (14-26), N3 (141-156), and N5 (246-260) that define the supersite for NTD-binding neutralizing antibodies (Cerutti et al., 2021). Since deletion sites are near or in the supersite, those deletions can alter the shape, hydrophobicity, and/or surface charge distribution of the supersite. These factors may perturb the binding of antibodies to NTD. The Spike structure shown here was modeled by Mansbach et al. (2021) based on the cryo-EM reconstruction from Walls et al. (2020) (PDB ID: 6VXX). Modeling was required because numerous regions were not resolved in the 6VXX structure, including loops N1, N3, and N5. Molecular visualization was prepared using VMD (Humphrey et al., 1996). (E) The position of the 6-nucleotide, 3-codon deletion at SARS-CoV-2 genome positions 21,766–21,771 that causes most instances of the Spike Δ69/70 2-amino-acid deletion. Note that the third position of the original isoleucine codon “ATA” (I68) is replaced by the “C” that was originally the third base of the “GTC” codon encoding V70. The 6-base, out-of-frame nucleotide deletion translates to a 2-amino-acid in-frame deletion.
Figure 3
Figure 3
Structural comparison of HIV-1 Env and SARS-CoV-2 Spike glycoproteins (A) Single conformation of Env (top) and Spike in 1-RBD-up state (bottom) from side and top view of trimers. Glycans are shown as stick representations and are colored by class (oligomannose, fucosylated 2-antennae, fucosylated 3-antennae and hybrid; see key given). Protein surface is shown in white. Protein sizes are to scale, with the maximum dimensions of the underlying protein represented by arrows. (B) Ensemble picture of the dynamic glycan shield, including 500 different conformations of each glycan represented as point densities based on fraction of occupancy. Glycans are colored as in part (A). (C) Glycan Encounter Factor represented as a color map on the surface of the Env (top) and Spike (bottom) proteins. Blue indicates high glycan shielding and red indicates regions of relatively high shield vulnerability. The CD4 binding site of Env and the receptor binding motif and NTD supersite of the Spike protein are marked by green circles.
Figure 4
Figure 4
Phylogenetic tree and recombinant triplets from South Africa (A) Phylogenetic tree of 298 SARS-CoV-2 sequences sampled in South Africa from 10/01/2020 to 01/31/2021. Sequences bearing the set of Spike mutations L18F, D80A, D215G, Δ242-244, K417N, E848K, N501Y, D614G, and A701V, characteristic of the most common form of Spike in the B.1.351 lineage, are labeled in magenta; all other regional variants are labeled in blue. Lowercase letters a though d mark the 4 recombinants shown in the right panels, and red stars indicate the recombinant leaves on the tree. (B) Each graph represents a recombinant triplet. The full genome of each parental strain is shown as a solid line, one in red and one in light blue, and the recombinant is shown below with mutations marked in either light blue or red, according to the parental strain they match, or black if they match neither parent. The Spike gene is demarcated with a black box. Recombination p values, calculated via the Runs Test statistic (obtained using the tool RAPR; Song et al., 2018), are shown to the left of each graph. The top graph (recombinant a) shows the strongest recombination signal detected in the full alignment (p = 7 × 10−5); however, while the parental strain in light blue is a B.1.351 variant, the recombinant is not. The other three recombinants (b through d) are all B.1.351 variants. (C) Each graph shows the Spike positions and corresponding amino acid at which the triplets shown in (B) differ. Color-coded boxes are either blue or red depending on which parental strain the recombinant matches at those position(s). Mutations typical of the B.1.351 variant are highlighted in bold. Note that, given sampling limitations, the sequences identified by RAPR are not expected to be the precise parents and child giving rise to the recombinant; rather, each member of the triplet represents a lineage to which the true parents and child belong. (D) The time period used to identify examples of likely recombination between co-circulating strains was selected to be 10/1/2020 through 1/31/21 because during this period B.1.351 came to dominate the South African epidemic and the B.1.351 variant was co-circulating with other natural variants, providing an opportunity for detectable natural recombination to arise. Weekly average counts of sampling of B.1.351 (magenta) relative to other variants (dark blue) during this study period are shown on the left; the same data is plotted as sampling frequencies on the right. B.1.351 was initially rare, but came to dominate the South African epidemic during this 3-month time frame.
Figure 5
Figure 5
A comparison of transition patterns in major clades (A) Major HIV-1 clades and CRF sampling frequencies in two 6-year windows: 2000–2005 and 2015–2020. The circle area reflects the relative number of sequences available from a given region within each map. (B) Frequency of sampling of the SARS-CoV-2 G clade (carrying D614G) and its descendants (shown in blue) versus the frequency of sampling of the ancestral form of the virus that carried D614 (shown in orange) in two time-windows, roughly the first 10 weeks of the pandemic (through March 1, 2020), and the last 3 months of 2020. (C) The top two graphs show the frequency of sampling of different variant forms in the United Kingdom between November 1, 2020 and May 10, 2021. In the fall, the G clade (light gray), and the GV clade (the G clade with an additional A222V mutation (darker gray) were co-circulating, with a gradual relative increase in the GV clade relative to G clade over the summer and fall. B.1.1.7 (orange) was first sampled in September, and rapidly increased in prevalence in the UK, comparable to the global transitions we found when the G clade became globally dominant (Korber et al., 2020b). In the spring of 2021, B.1.627.2, initially sampled in India, had begun to rise significantly in frequency in the UK. In this evolutionary pattern, one form gave way successively to another: G to GV to B.1.1.7. Currently B.1.617.2 has begun to be increasing sampled; over the next few months we will learn if B.1.617.2 continues in this upward trajectory in the UK and elsewhere. The same data are plotted two ways: weekly average tallies of each form, to give a sense of sampling, and weekly average frequencies. Below, the same data is plotted for North America. The G clade is dominant in the fall. G clade forms which carried additional mutations near the furin cleavage site (magenta and purple) became increasingly frequently sampled, but then gave way to variants with more complex forms of Spike, which often still carried a positive charge near the furin cleavage site. When the B.1.1.7 variant began to be sampled in early December, there are already distinct forms with an established presence and relative fitness advantages co-circulating, and VOI/VOCs first sampled from California, Brazil, and New York all had a significant presence. Still, B.1.1.7 has been increasingly sampled throughout North America, although P.1 and B.1.526 are also continuing to maintain or increase in frequency in some regions states in the USA. As of early May, 2021, B.1.617.2 is still rare but present and increasing in frequency in North America.

Similar articles

Cited by

References

    1. Arendrup M., Nielsen C., Hansen J.E., Pedersen C., Mathiesen L., Nielsen J.O. Autologous HIV-1 neutralizing antibodies: emergence of neutralization-resistant escape virus and subsequent development of escape virus neutralizing antibodies. J. Acquir. Immune Defic. Syndr. (1988) 1992;5:303–307. - PubMed
    1. Avanzato V.A., Matson M.J., Seifert S.N., Pryce R., Williamson B.N., Anzick S.L., Barbian K., Judson S.D., Fischer E.R., Martens C., et al. Case study: Prolonged infectious SARS-CoV-2 shedding from an asymptomatic immunocompromised individual with cancer. Cell. 2020;183:1901–1912.e9. - PMC - PubMed
    1. Baang J.H., Smith C., Mirabelli C., Valesano A.L., Manthei D.M., Bachman M.A., Wobus C.E., Adams M., Washer L., Martin E.T., Lauring A.S. Prolonged severe acute respiratory syndrome coronavirus 2 replication in an immunocompromised patient. J. Infect. Dis. 2021;223:23–27. - PMC - PubMed
    1. Bar K.J., Tsao C.Y., Iyer S.S., Decker J.M., Yang Y., Bonsignori M., Chen X., Hwang K.K., Montefiori D.C., Liao H.X., et al. Early low-titer neutralizing antibodies impede HIV-1 replication and select for virus escape. PLoS Pathog. 2012;8:e1002721. - PMC - PubMed
    1. Baric R.S., Fu K., Schaad M.C., Stohlman S.A. Establishing a genetic recombination map for murine coronavirus strain A59 complementation groups. Virology. 1990;177:646–656. - PMC - PubMed

Publication types