. 2021 Jul 26;56(14):2089-2102.e11.
doi: 10.1016/j.devcel.2021.06.013. Epub 2021 Jul 8.

A p53-dependent translational program directs tissue-selective phenotypes in a model of ribosomopathies

Affiliations

A p53-dependent translational program directs tissue-selective phenotypes in a model of ribosomopathies

Gerald C Tiu et al. Dev Cell. .

Abstract

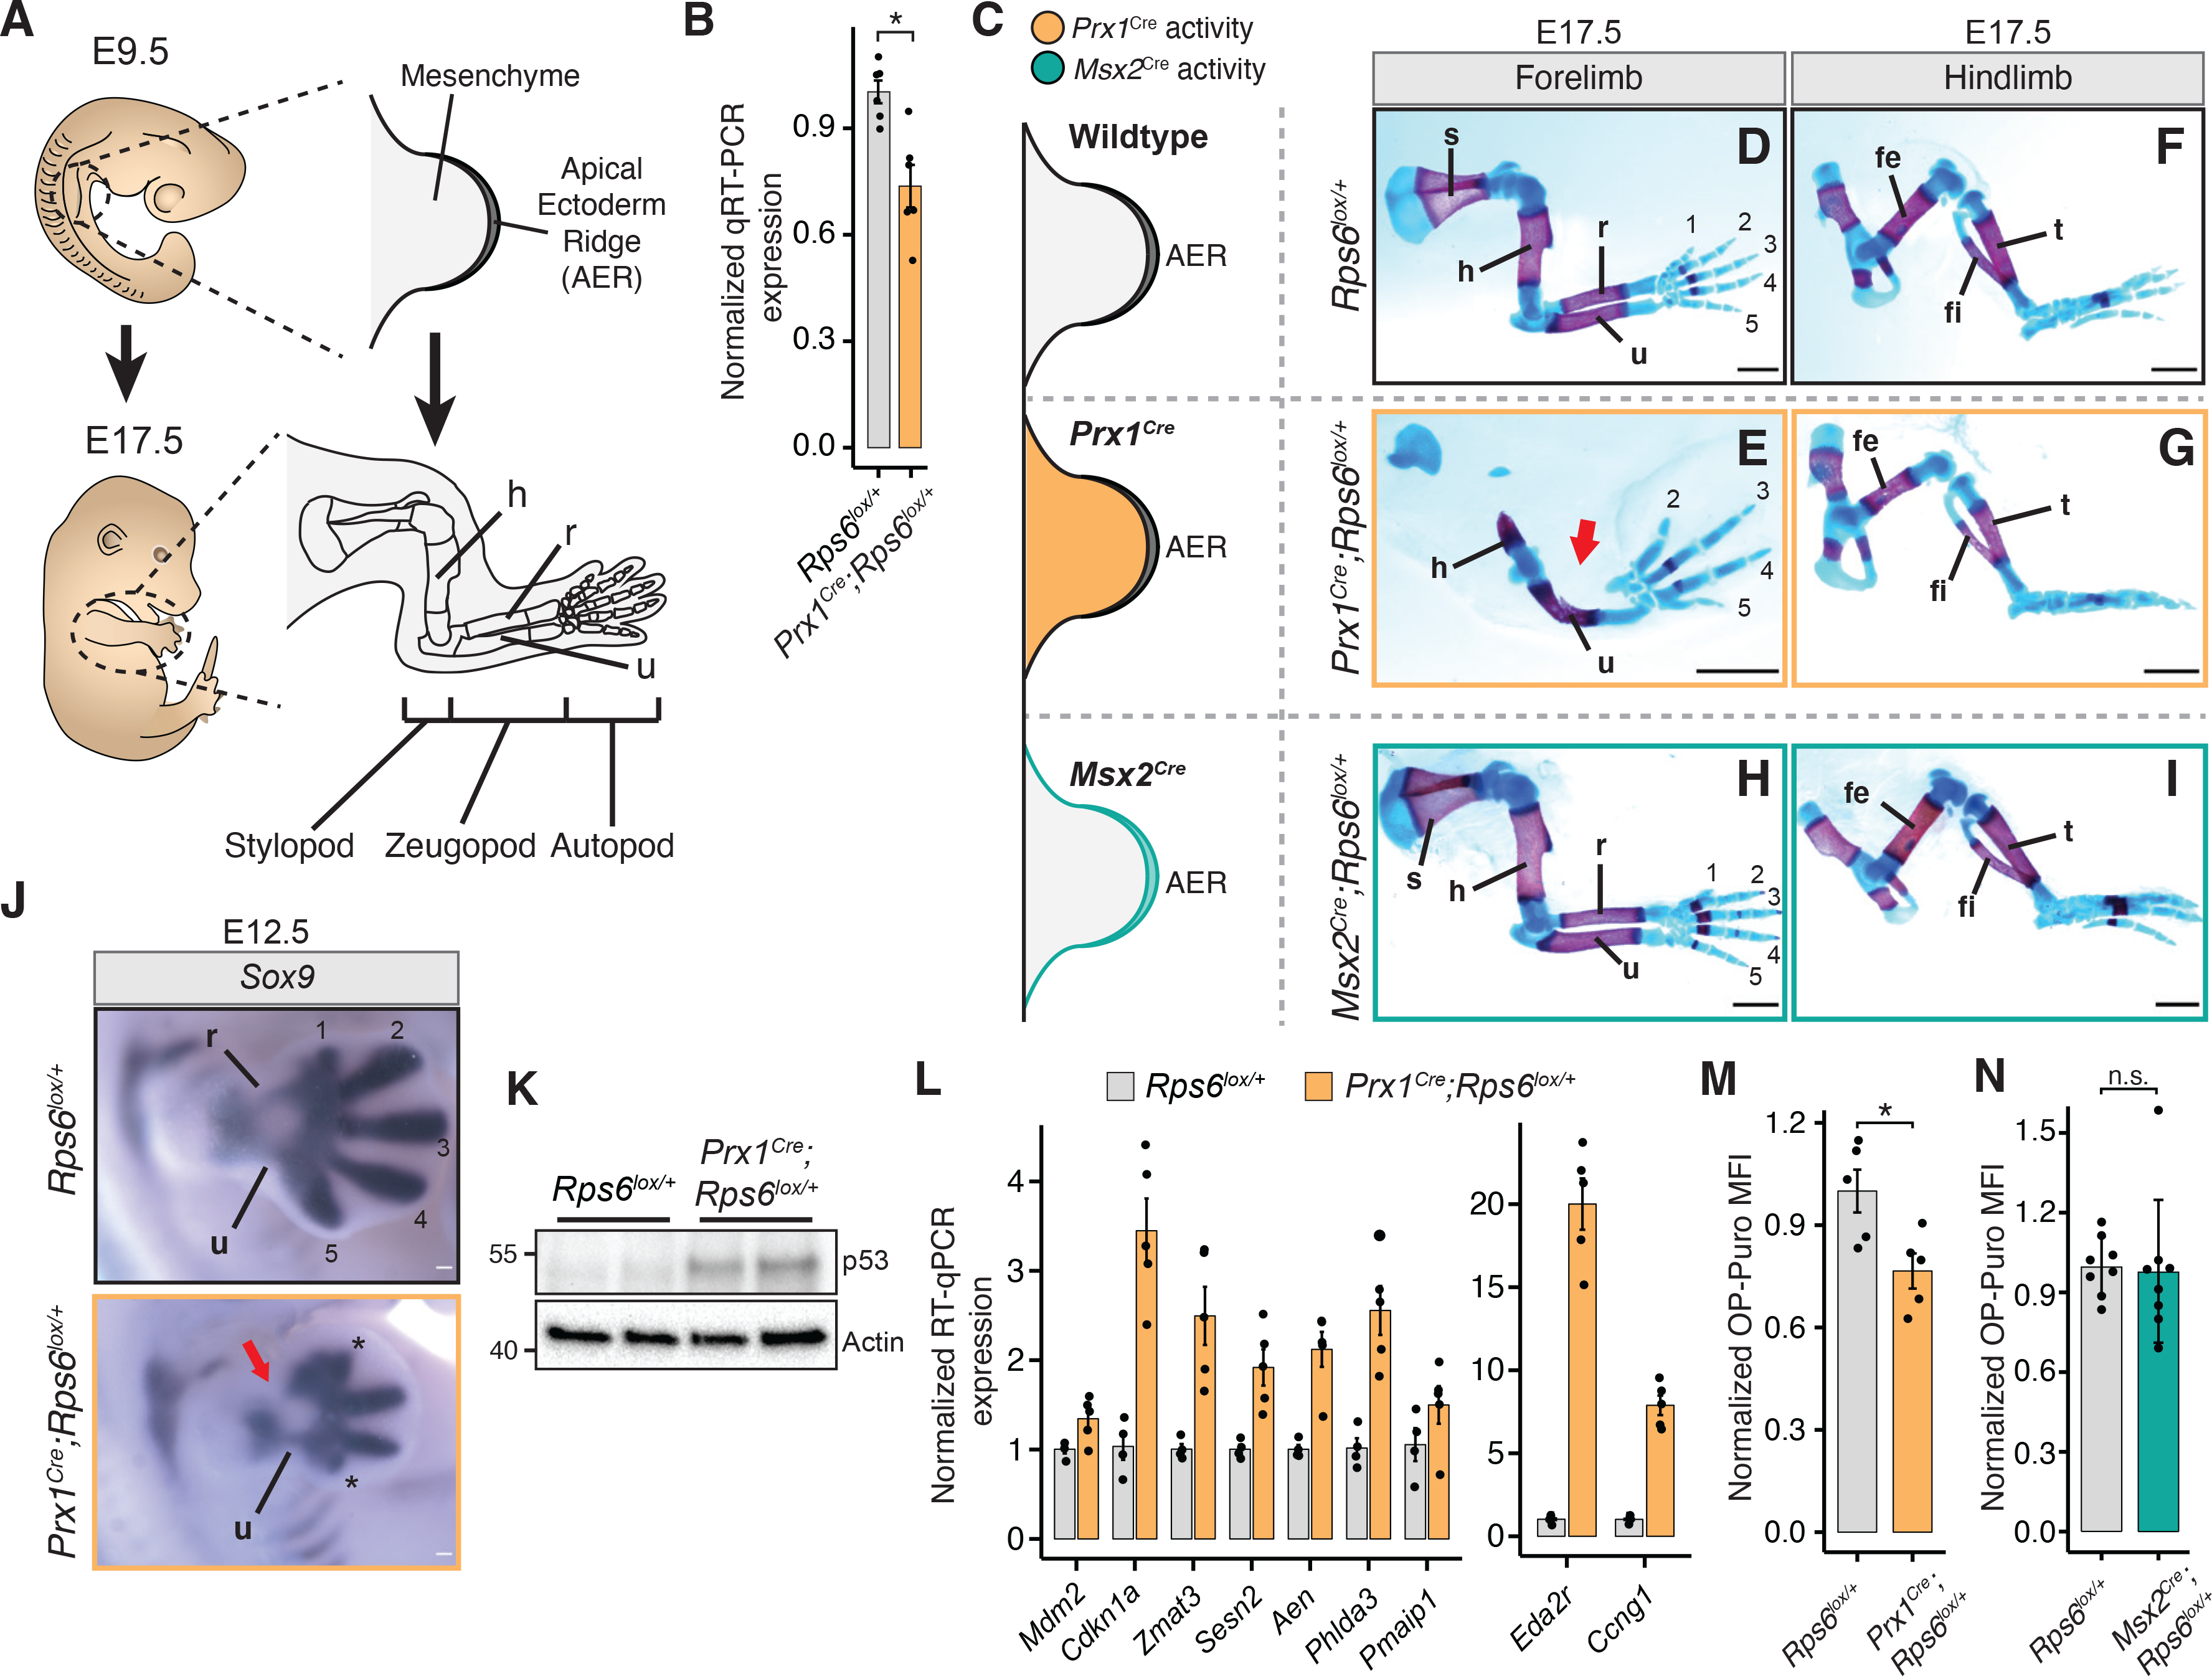
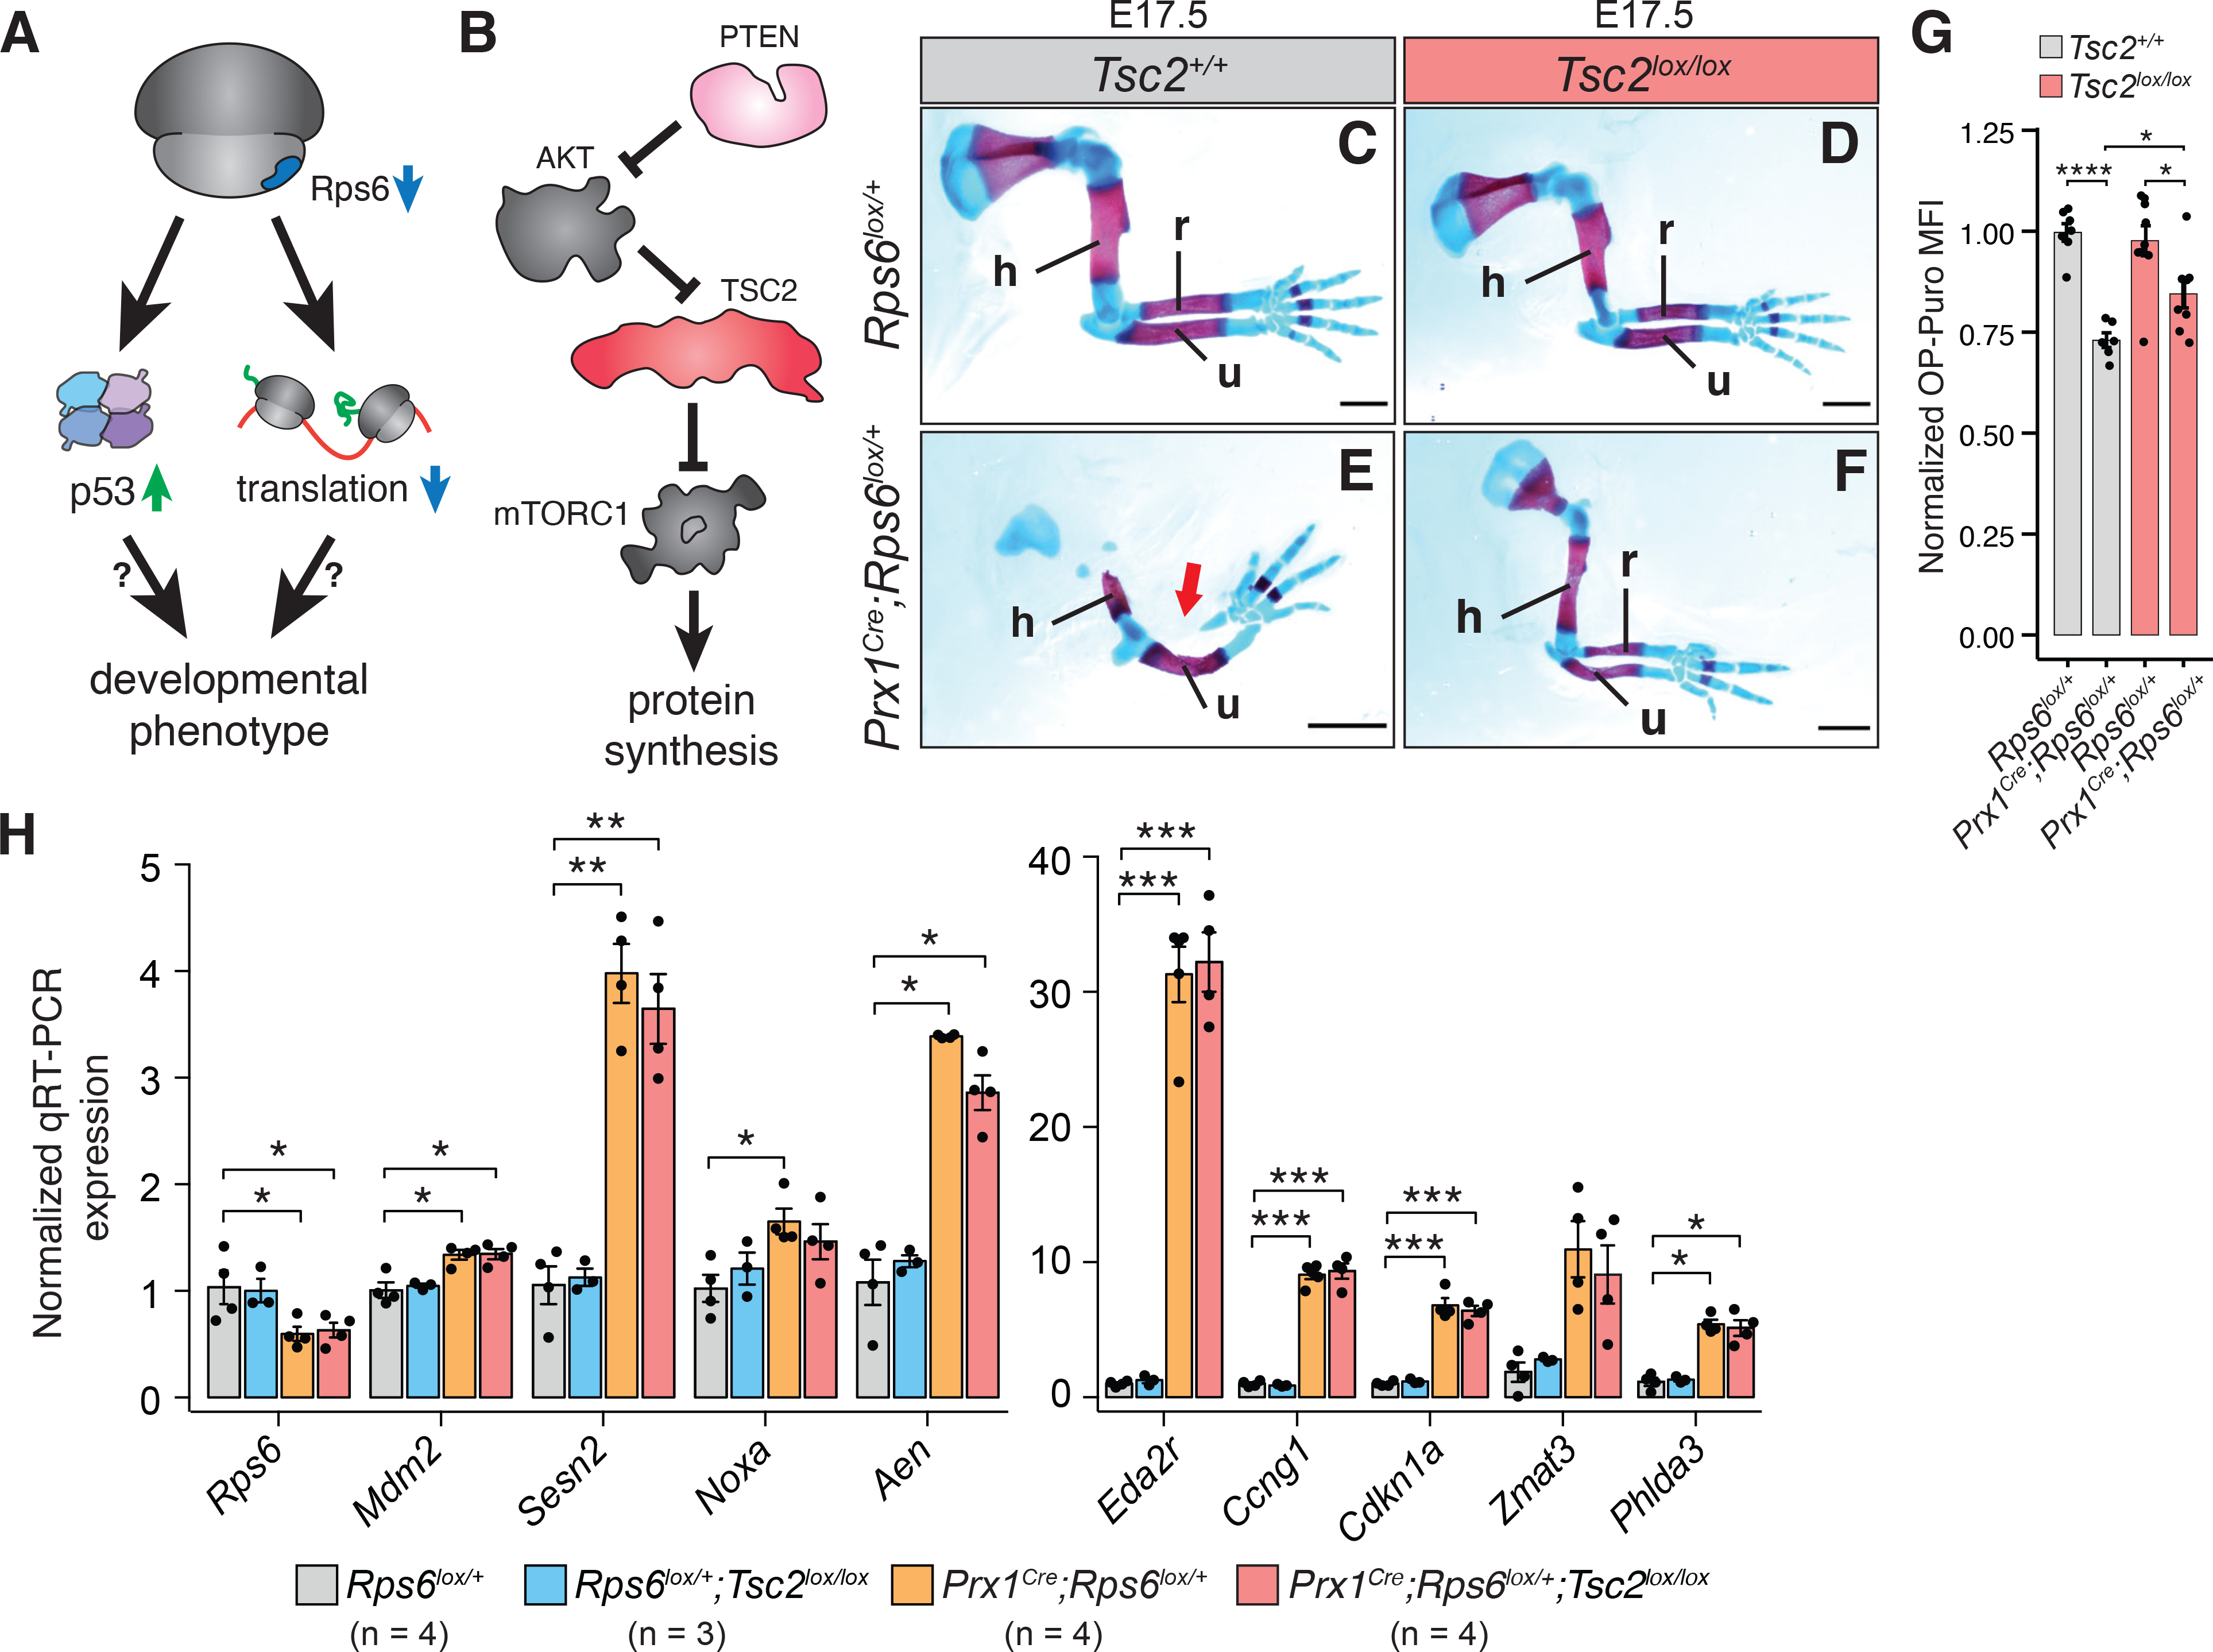
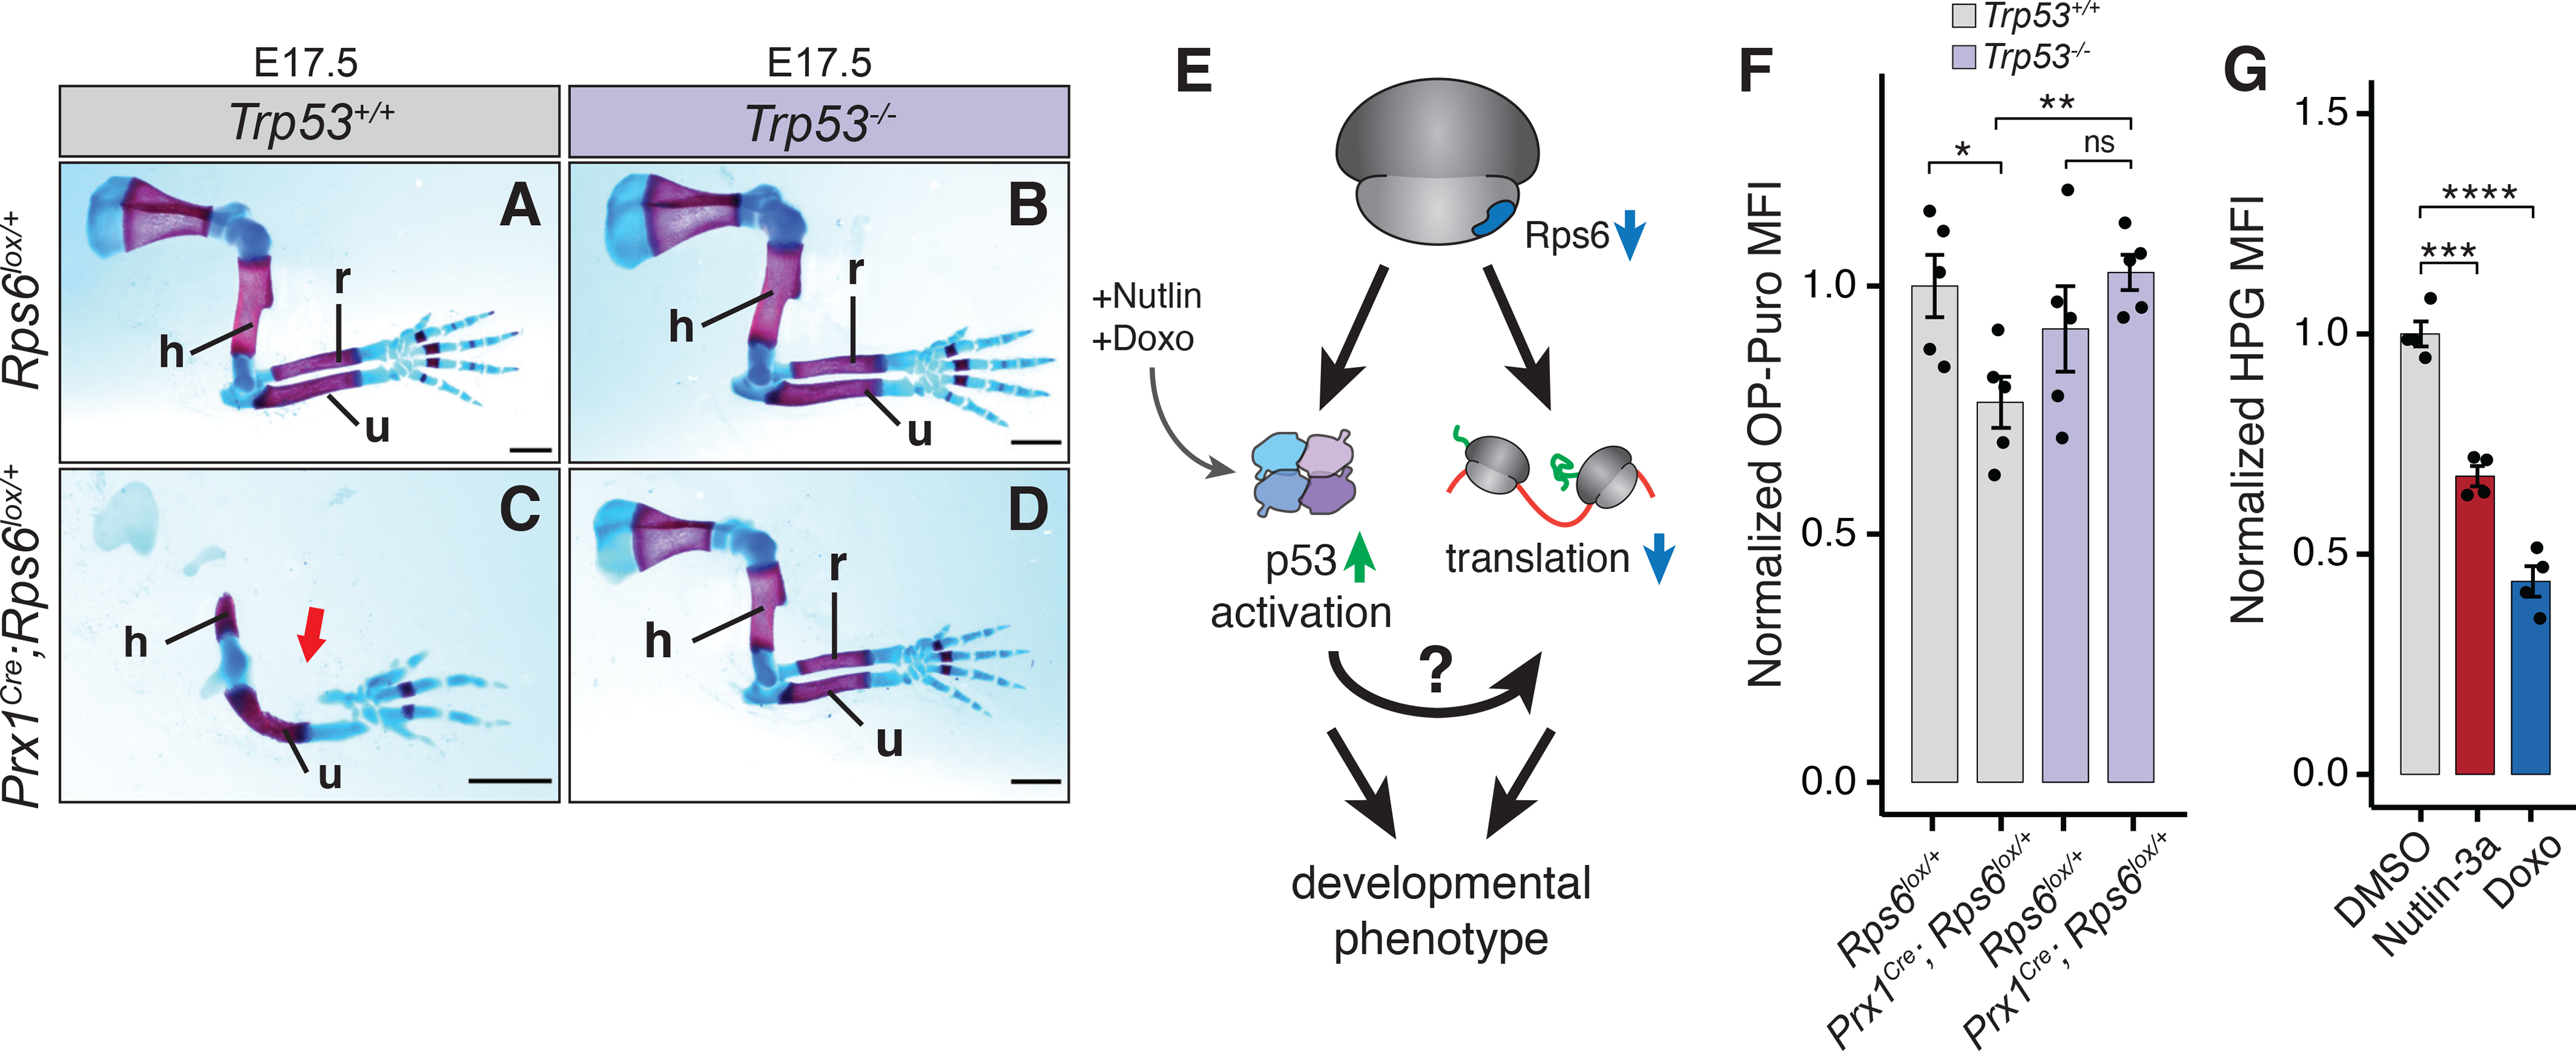
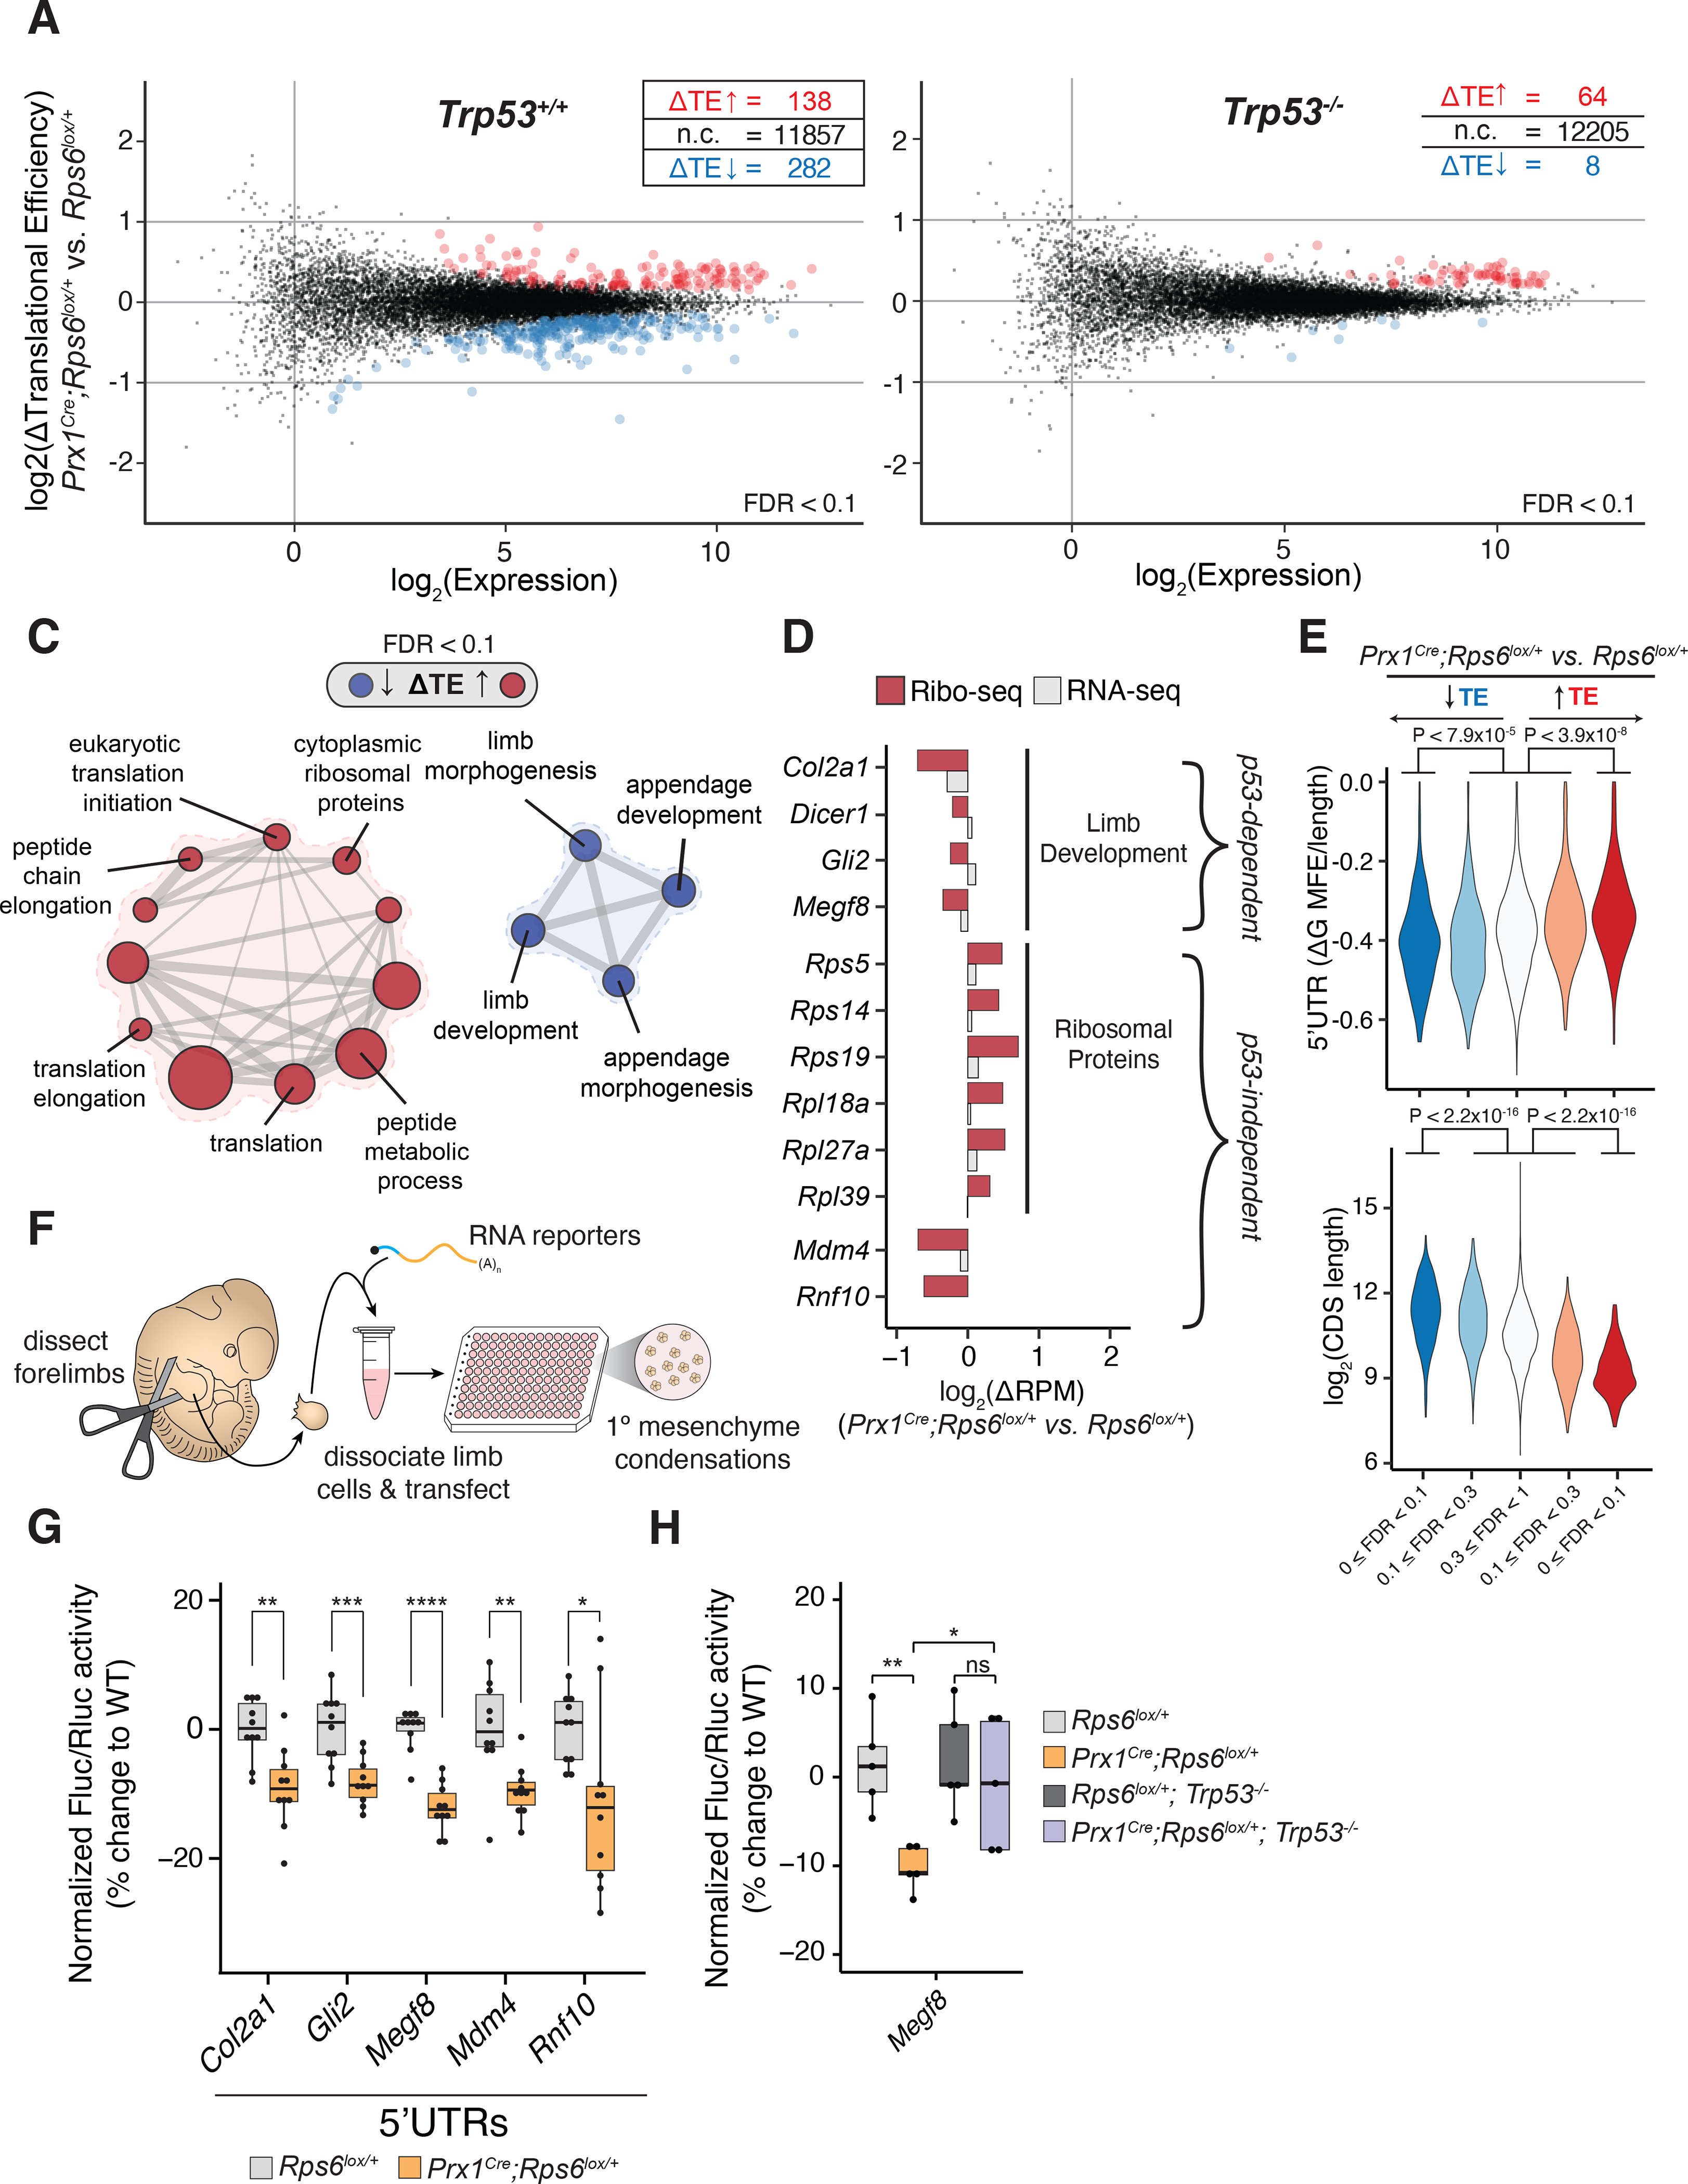
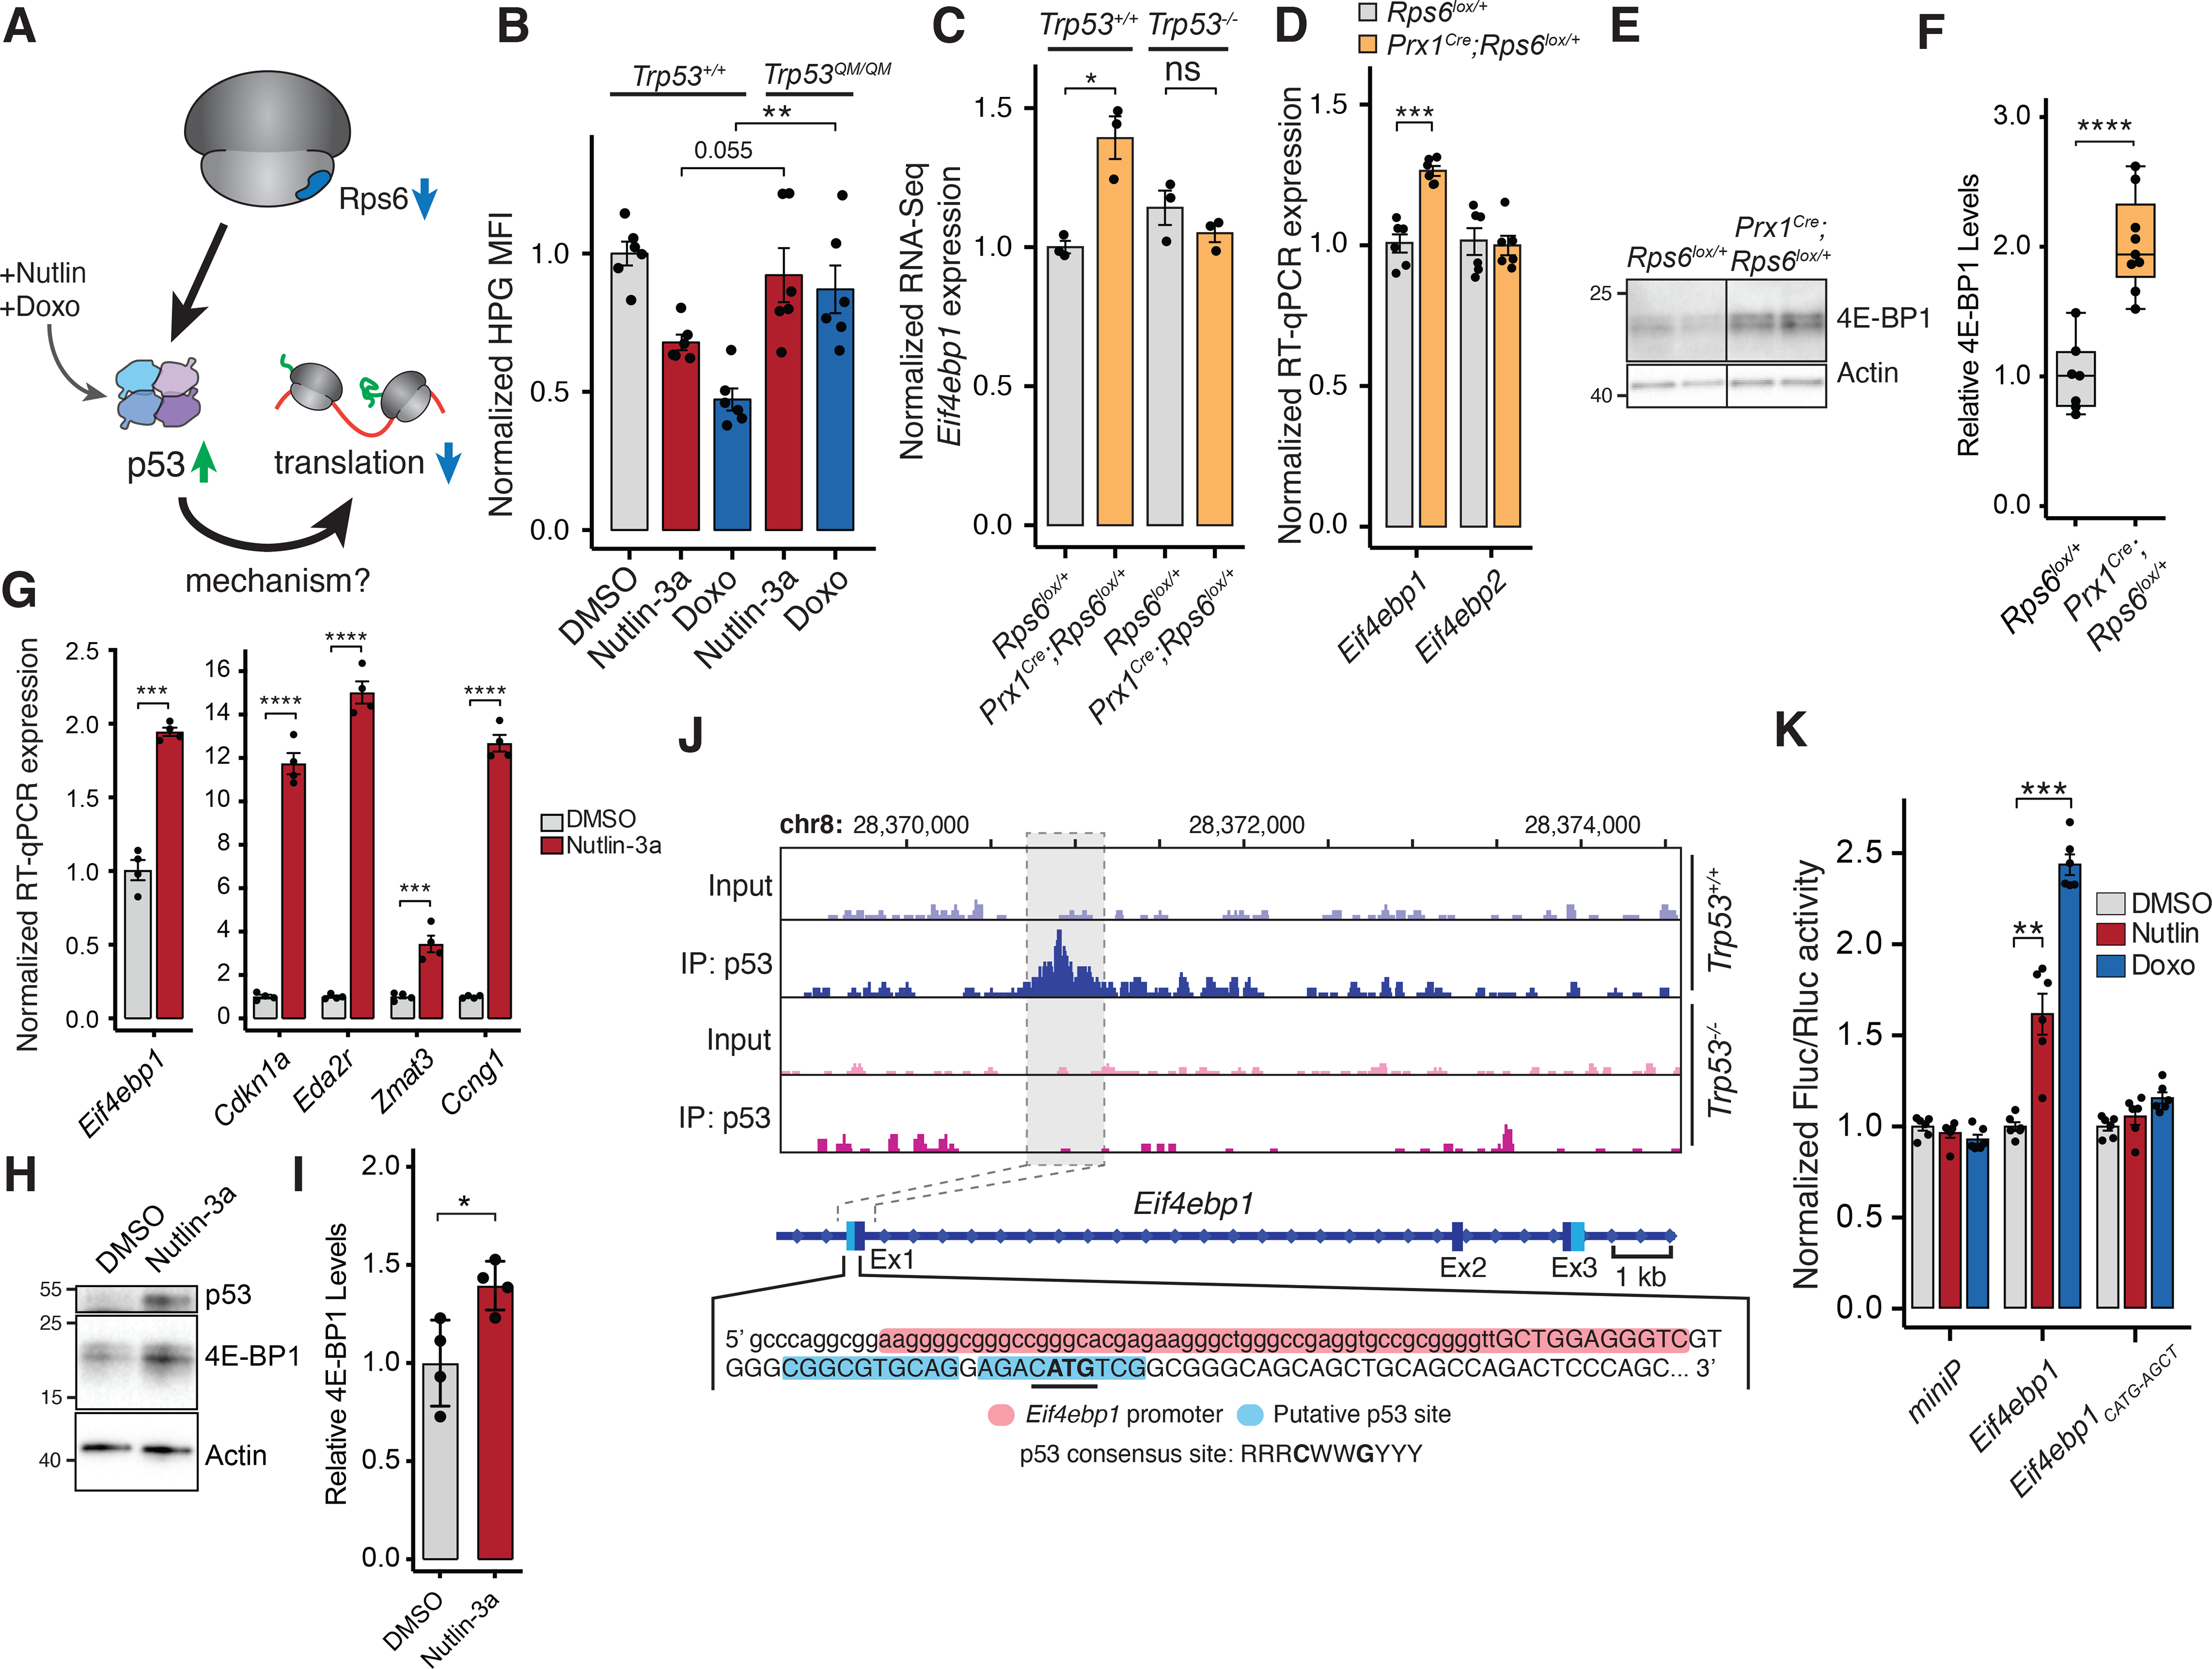
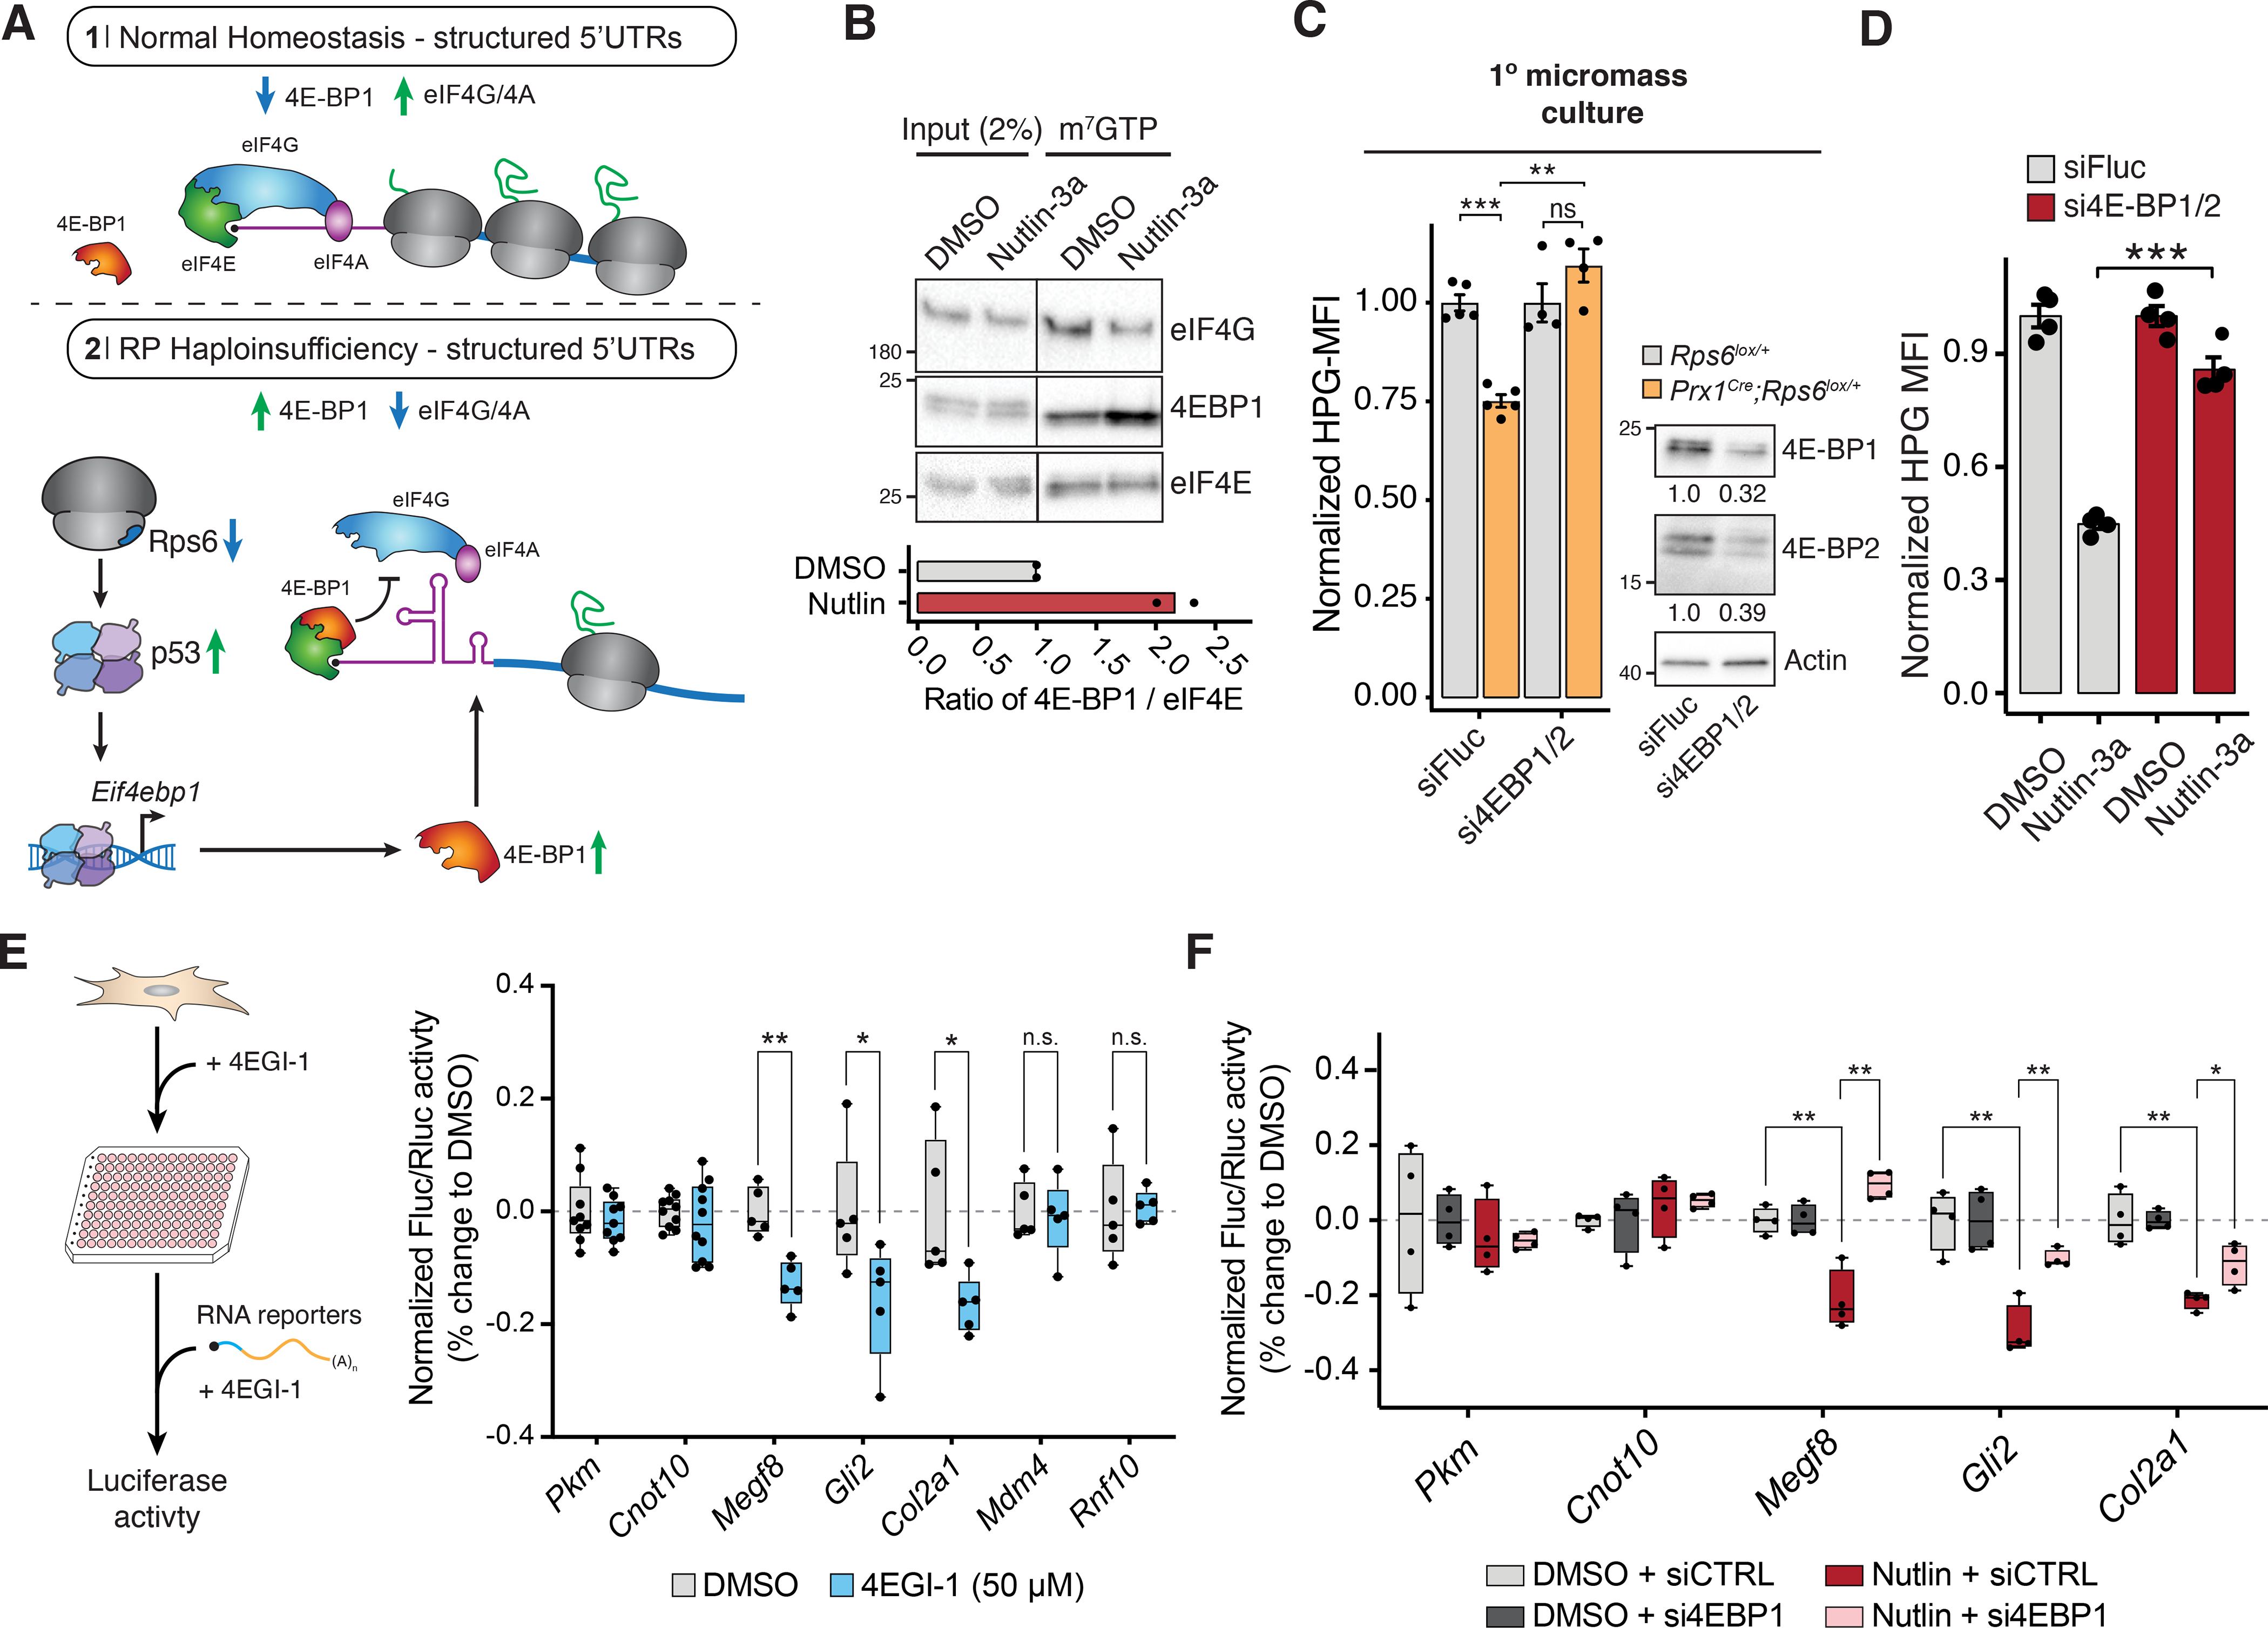
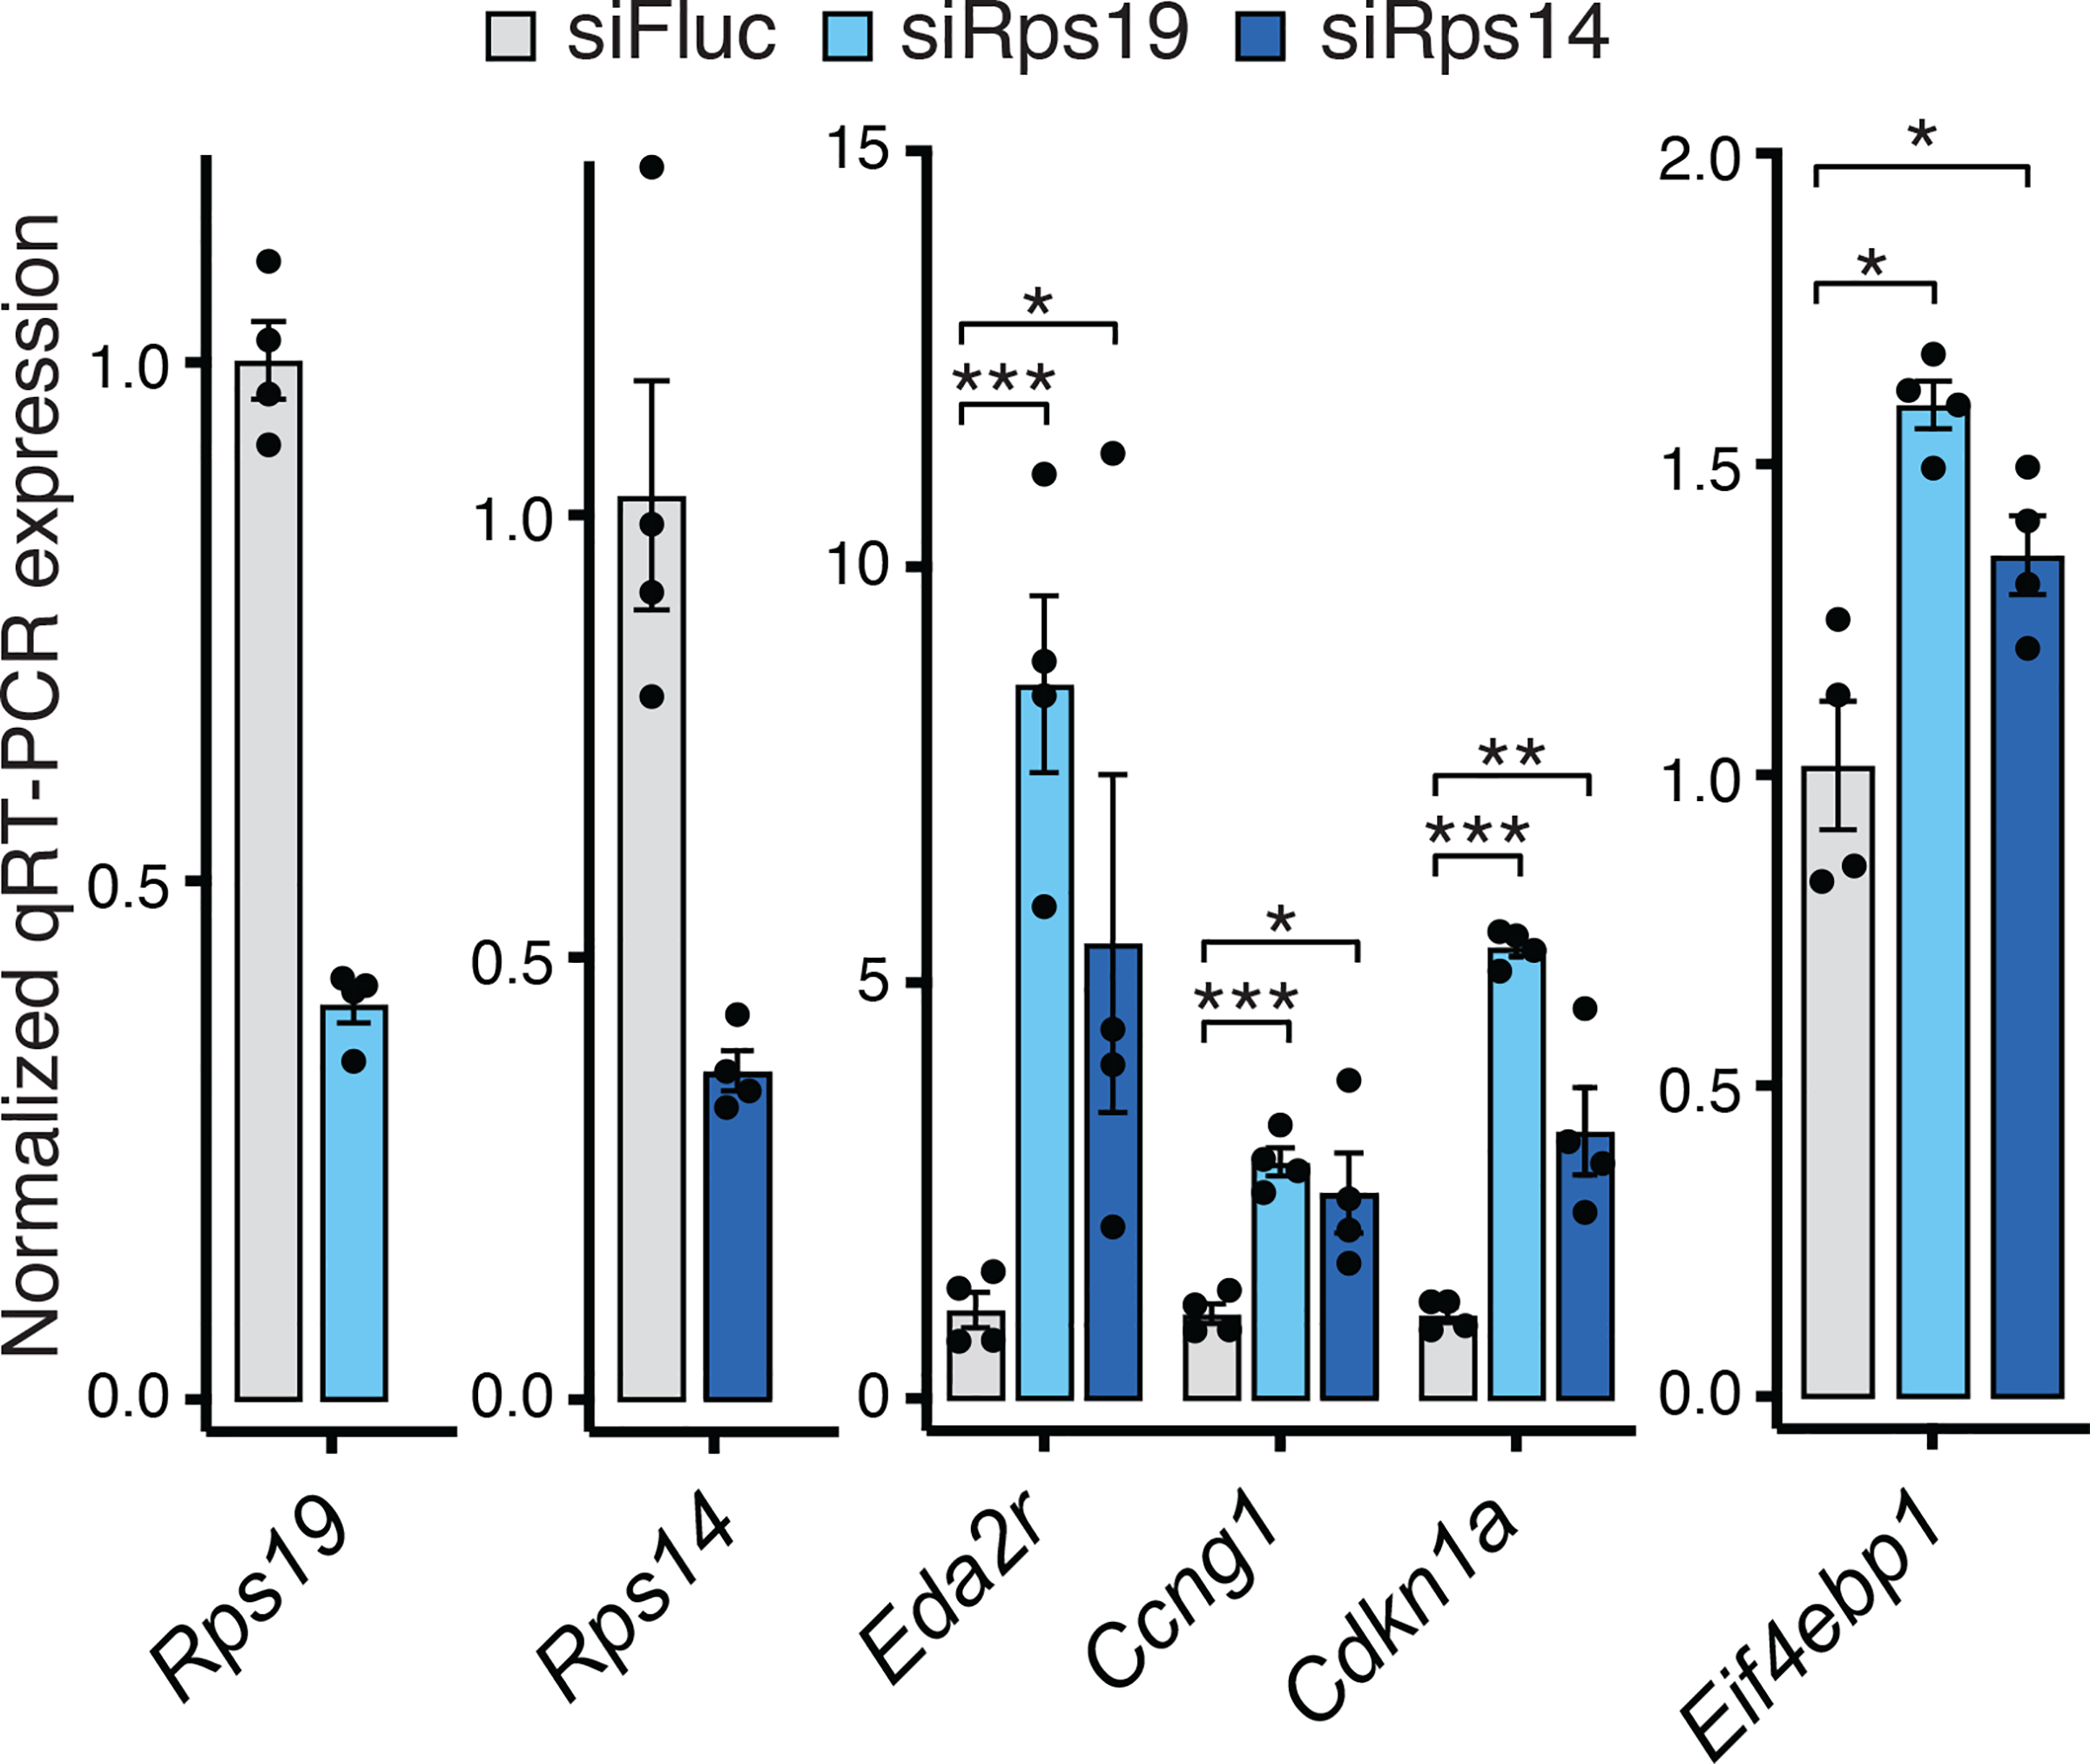
In ribosomopathies, perturbed expression of ribosome components leads to tissue-specific phenotypes. What accounts for such tissue-selective manifestations as a result of mutations in the ribosome, a ubiquitous cellular machine, has remained a mystery. Combining mouse genetics and in vivo ribosome profiling, we observe limb-patterning phenotypes in ribosomal protein (RP) haploinsufficient embryos, and we uncover selective translational changes of transcripts that controlling limb development. Surprisingly, both loss of p53, which is activated by RP haploinsufficiency, and augmented protein synthesis rescue these phenotypes. These findings are explained by the finding that p53 functions as a master regulator of protein synthesis, at least in part, through transcriptional activation of 4E-BP1. 4E-BP1, a key translational regulator, in turn, facilitates selective changes in the translatome downstream of p53, and this thereby explains how RP haploinsufficiency may elicit specificity to gene expression. These results provide an integrative model to help understand how in vivo tissue-specific phenotypes emerge in ribosomopathies.

Keywords: 4E-BP1; limb development; nucleolar stress; p53; ribosomal protein haploinsufficiency; ribosome profiling; ribosomopathy; translational control.


Conflict of interest statement

Declaration of interests D.R. is a shareholder of eFFECTOR Therapeutics and a member of its scientific advisory board.

Figures

Figure 1.
Figure 1.. Rps6 haploinsufficiency in the developing limb bud mesenchyme leads to selective patterning defects marked by p53 activation and reduced global protein synthesis.
(A) Overview of forelimb development. AER, apical ectodermal ridge; h, humerus; r, radius; u, ulna. (B) RT-qPCR of Rps6 mRNA from whole E10.5 forelimbs. (C) Cre recombinase activity distribution in limb bud mesenchyme (Prx1Cre; orange), or in the overlying AER (Msx2Cre; green). (D-I), E17.5 forelimbs and hindlimbs from WT (top row), Prx1Cre;Rps6lox/+ (middle row), and Msx2Cre;Rps6lox/+ (bottom row). Bone, red; Cartilage, blue. Numbers indicate digits. Arrow indicates absence of radius. Scale bars, 1 mm. (J) Sox9 in situ hybridization of E12.5 forelimbs. Numbers indicate mesenchymal digit condensations. *Impaired digit development. Arrow indicates absence of radius. Scale bars, 0.1 mm. (K) Representative p53 Western blot in whole E10.5 forelimbs. n = 2 embryos each. (L) RT-qPCR of p53 target genes in whole E10.5 forelimbs. n = 4 embryos (Rps6lox/+), n = 5 embryos (Prx1Cre;Rps6lox/+). (M) OPP MFI of cells dissociated from whole E10.5 Prx1Cre;Rps6lox/+ forelimbs normalized to WT. n = 5 embryos; MFI = median fluorescence intensity. (N) OPP MFI of E11.5 Msx2Cre;Rps6lox/+ ectodermal cells normalized to WT. n = 8 embryos.
Figure 2.
Figure 2.. mTORC1 activation with corresponding augmented protein synthesis rescues Rps6 haploinsufficiency phenotypes.
(A) Overview of potential pathways leading to developmental phenotypes upon Rps6 haploinsufficiency, specifically p53 activation and translation dysregulation. (B) Schematic of mTORC1 regulation and downstream effects. (C-F) Representative E17.5 forelimbs of WT (Rps6lox/+) and Prx1Cre;Rps6lox/+ embryos in Tsc2 WT (Tsc2+/+) or Tsc2 conditional loss (Tsc2lox/lox) backgrounds. Arrow indicates absence of radius. Scale bars, 1 mm. (G) OPP MFI of cells dissociated from whole E10.5 forelimbs normalized to WT. n = 7 embryos, (Rps6lox/+;Tsc2+/+); n = 6 embryos, (Prx1Cre;Rps6lox/+;Tsc2+/+); n = 9 embryos, (Rps6lox/+;Tsc2lox/lox); n = 8 embryos, (Prx1Cre;Rps6lox/+;Tsc2lox/lox). (H) RT-qPCR of p53 target genes from whole E10.5 forelimbs. n = 4 (Rps6lox/+, Prx1Cre;Rps6lox/+, Prx1Cre;Rps6lox/+;Tsc2lox/lox), n = 3 (Rps6lox/+;Tsc2lox/lox).
Figure 3.
Figure 3.. p53 loss rescues Rps6 haploinsufficiency phenotypes, and p53 activation mediates translational changes upon Rps6 reduction.
(A-D) E17.5 forelimbs of WT and Prx1Cre;Rps6lox/+ embryos in Trp53 WT (Trp53+/+) and Trp53 null (Trp53−/−) backgrounds. Arrow indicates absence of radius. Scale bars, 1 mm. (E) Potential pathways for p53-dependent translational control upon Rps6 haploinsufficiency. (F) OPP MFI of cells dissociated from whole E10.5 forelimbs normalized to WT (Rps6lox/+). n = 5 embryos. (G) HPG MFI of mouse embryonic fibroblasts treated with Nutlin-3a or Doxo normalized to DMSO treated control. 8 h treatment, n = 4.
Figure 4.
Figure 4.. Ribosome profiling reveals p53-dependent and -independent translation changes upon Rps6 haploinsufficiency.
(A-B) MA plot of change in translational efficiency (ΔTE) in whole E10.5 Prx1Cre;Rps6lox/+ vs. Rps6lox/+ forelimbs in Trp53+/+ (A) and Trp53−/− (B) backgrounds. red, ΔTE > 0; blue, ΔTE < 0; n = 3; FDR < 0.1. (C) Gene set enrichment analysis for transcripts changing in TE in E10.5 Prx1Cre;Rps6lox/+ vs. Rps6lox/+ forelimbs. node size, gene set size; edge size, gene set overlap; FDR < 0.1. (D) Relative change in ribosome footprints (red) and mRNA expression (gray) for select high-confidence transcripts (see Methods). (E) Violin plots quantifying ΔTE relative to computationally predicted 5’UTR structuredness normalized to UTR length (ΔG MFE / 5’UTR length; see Methods) and relative to CDS length. Transcripts are stratified by direction of ΔTE (blue, down; red, up) and FDR; Mann-Whitney U test. (F) Workflow of the primary limb micromass assay. (G) Fluc/Rluc activity from RNA reporter transfection in whole E11.5 forelimb micromass cultures normalized to the geometric mean of control Pkm and Cnot10 5’UTR activities and WT (Rps6lox/+). Pkm and Cnot10 were chosen as controls given that they did not change in TE upon Rps6 haploinsufficiency (Table S3). (H) Fluc/Rluc activity of Megf8 5’UTR RNA reporter transfected into whole E11.5 forelimb micromass cultures normalized to control Pkm 5’UTR activity and mean of WT (Rps6lox/+) or Trp53-null (Rps6lox/+;Trp53−/−) background.
Figure 5.
Figure 5.. p53 activation leads to transcriptional upregulation of Eif4ebp1.
(A) Potential model of p53-dependent translational control upon Rps6 haploinsufficiency. (B) HPG MFI of MEFs expressing WT or transactivation dead p53 (Trp53QM) treated with Nutlin-3a or Doxo normalized to mean of DMSO control expressing WT p53. 8 h treatment, n = 6. (C) Eif4ebp1 expression from RNA-Seq of whole E10.5 forelimbs normalized to WT (Rps6lox/+;Trp53+/+), n = 3. (D) Expression of Eif4ebp1 and Eif4ebp2 mRNA from whole E10.5 forelimbs. (E-F) Representative 4E-BP1 Western blot (E) and quantification (F) from Figure S7B of E10.5 Rps6lox/+ and Prx1Cre;Rps6lox/+ forelimb mesenchyme cells after ectoderm removal with values normalized to Actin and Rps6lox/+. n = 7, Rps6lox/+; n = 9, Prx1Cre;Rps6lox/+. (G) Expression of Eif4ebp1 and p53 target genes by RT-qPCR from NIH3T3 cells treated with DMSO or Nutlin-3a for 8 h. (H-I) Western blot of 4E-BP1 from NIH3T3 cells treated with Nutlin-3a for 8 h. Shown is a representative blot (H) with quantification (I) from 4 independent replicates. (J) p53 ChIP-Seq gene track of Eif4ebp1 locus (Kenzelmann Broz et al., 2013) from Doxo-treated Trp53+/+ and Trp53−/− MEFs. Capital letters = transcription state site; red highlight = Eif4ebp1 promoter; blue highlight = putative p53-binding region; bold = Eif4ebp1 start codon; underline = p53 core binding sequence. (K) Fluc/Rluc activity normalized to DMSO control of each construct. Plasmid containing a minimal promoter, the Eif4ebp1 region, or mutated Eif4ebp1 region (Figure S7F) were transfected into NIH3T3 cells and treated with DMSO, Nutlin-3a, or Doxo for 8 h; n = 6.
Figure 6.
Figure 6.. p53 controls translation in part through 4E-BP1
(A) mRNAs with highly structured 5’UTRs are particularly sensitive to eIF4E/4E-BP1-mediated regulation (Pelletier and Sonenberg, 1985; Pelletier et al., 2015). In normal homeostasis (1), eIF4E recruits eIF4G/4A, which helps unwind structured 5’UTRs and promote translation. Upon RP haploinsufficiency (2), p53-mediated 4E-BP1 induction may lead to selective translational repression of structured mRNAs by blocking eIF4E-eIF4G/4A binding. (B) Cap-binding assay of NIH3T3 cells treated with Nutlin-3a for 8 h. Bottom: ratio of 4E-BP1 to eIF4E in cap-binding assays; n = 2. (C) Left: HPG MFI upon 4E-BP1/2 siRNA treatment in primary Rps6lox/+ and Prx1Cre;Rps6lox/+ limb micromass cultures from whole E10.5 forelimbs. Values normalized to respective wildtype of each siRNA condition; n = 4. Right: Western blot of 4E-BP1 and 4E-BP2 levels in primary Rps6lox/+ limb micromass cultures after siRNA treatment for 16 h. Numbers indicate quantification of proteins normalized to siFluc. (D) HPG MFI upon 4E-BP1/2 siRNA treatment in NIH3T3 cells normalized to mean of respective DMSO control for each knockdown condition; n = 4. (E) Left: Schematic of 4EGI-1 treatment and luciferase RNA reporter assay in C3H/10T1/2 mesenchymal cells. Right: Fluc/Rluc activity of RNA reporters transfected into C3H/10T1/2 cells after 4 h 4EGI-1 treatment. Activity was normalized to the geometric mean of Pkm and Cnot10 5’UTR reporters and mean of DMSO control. (F) Fluc/Rluc activity from transfection of RNA reporters in NIH3T3 cells treated with either DMSO or Nutlin-3a for 8 h after siRNA knockdown for 16 h with control or 4E-BP1 siRNA. Activity was normalized to the geometric mean of control Pkm and Cnot10 5’UTR activities and mean of respective DMSO control of each knockdown condition.
Figure 7.
Figure 7.. Depletion of RPs commonly mutated in ribosomopathies induces Eif4ebp1 expression.
RT-qPCR of p53 target genes (Eda2r, Ccng1, Cdkn1a) and Eif4ebp1 in primary forelimb micromass cultures after Rps19 and Rps14 siRNA knockdown. n = 4.

Similar articles

Cited by

References

    1. Barlow JL, Drynan LF, Hewett DR, Holmes LR, Lorenzo-Abalde S, Lane AL, Jolin HE, Pannell R, Middleton AJ, Wong SH, et al. (2010). A p53-dependent mechanism underlies macrocytic anemia in a mouse model of human 5q- syndrome. Nat. Med 16, 59–66. - PMC - PubMed
    1. Barna M, and Niswander L (2007). Visualization of cartilage formation: insight into cellular properties of skeletal progenitors and chondrodysplasia syndromes. Dev. Cell 12, 931–941. - PubMed
    1. Bi C, Zhang X, Lu T, Zhang X, Wang X, Meng B, Zhang H, Wang P, Vose JM, Chan WC, et al. (2017). Inhibition of 4EBP phosphorylation mediates the cytotoxic effect of mechanistic target of rapamycin kinase inhibitors in aggressive B-cell lymphomas. Haematologica 102, 755–764. - PMC - PubMed
    1. Bowen ME, McClendon J, Long HK, Sorayya A, Van Nostrand JL, Wysocka J, and Attardi LD (2019). The Spatiotemporal Pattern and Intensity of p53 Activation Dictates Phenotypic Diversity in p53-Driven Developmental Syndromes. Dev. Cell 50, 212–228.e6. - PMC - PubMed
    1. Brady CA, Jiang D, Mello SS, Johnson TM, Jarvis LA, Kozak MM, Kenzelmann Broz D, Basak S, Park EJ, McLaughlin ME, et al. (2011). Distinct p53 transcriptional programs dictate acute DNA-damage responses and tumor suppression. Cell 145, 571–583. - PMC - PubMed

Publication types

MeSH terms