. 2021 Aug 10;16(8):1938-1952.
doi: 10.1016/j.stemcr.2021.06.006. Epub 2021 Jul 8.

Generation of caudal-type serotonin neurons and hindbrain-fate organoids from hPSCs

Affiliations

Generation of caudal-type serotonin neurons and hindbrain-fate organoids from hPSCs

Parvin Valiulahi et al. Stem Cell Reports. .

Abstract

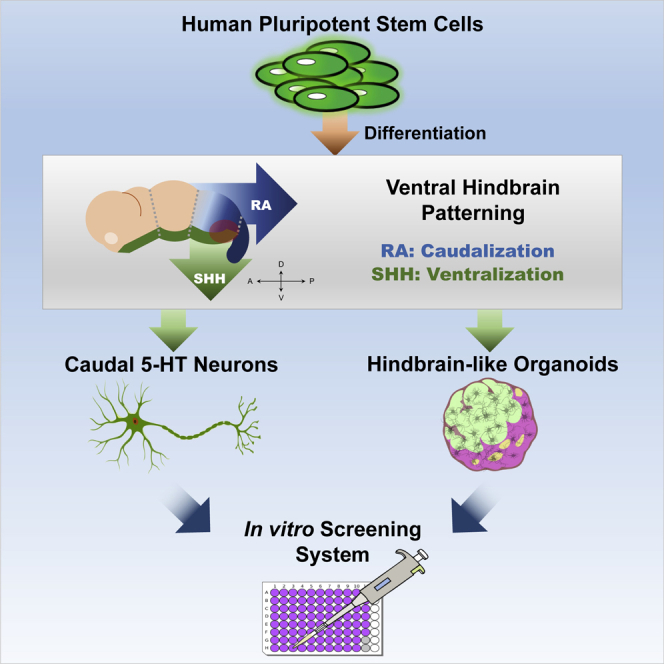
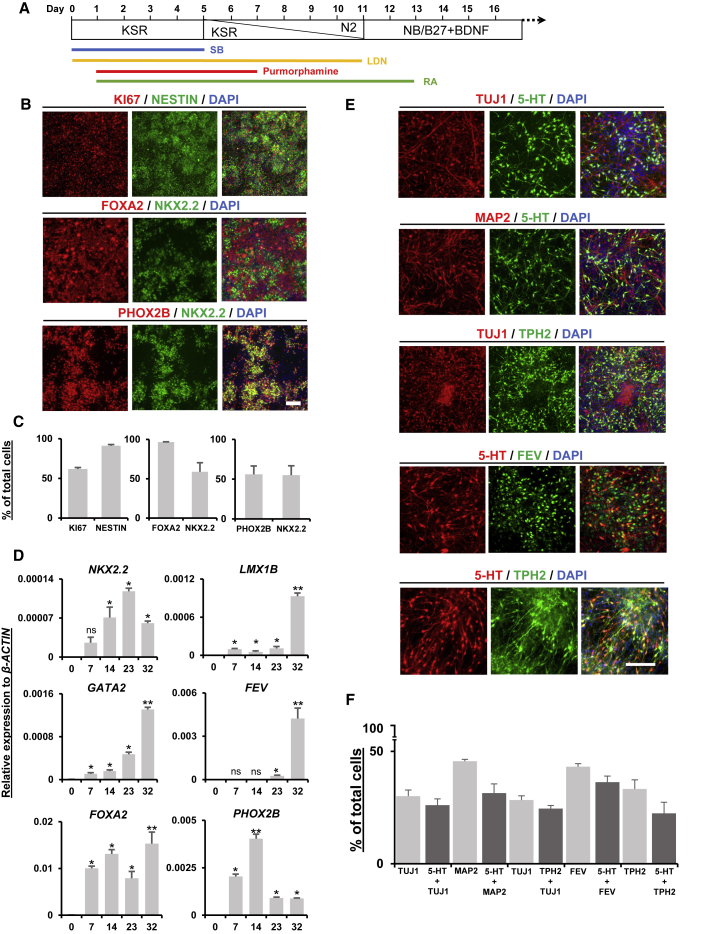
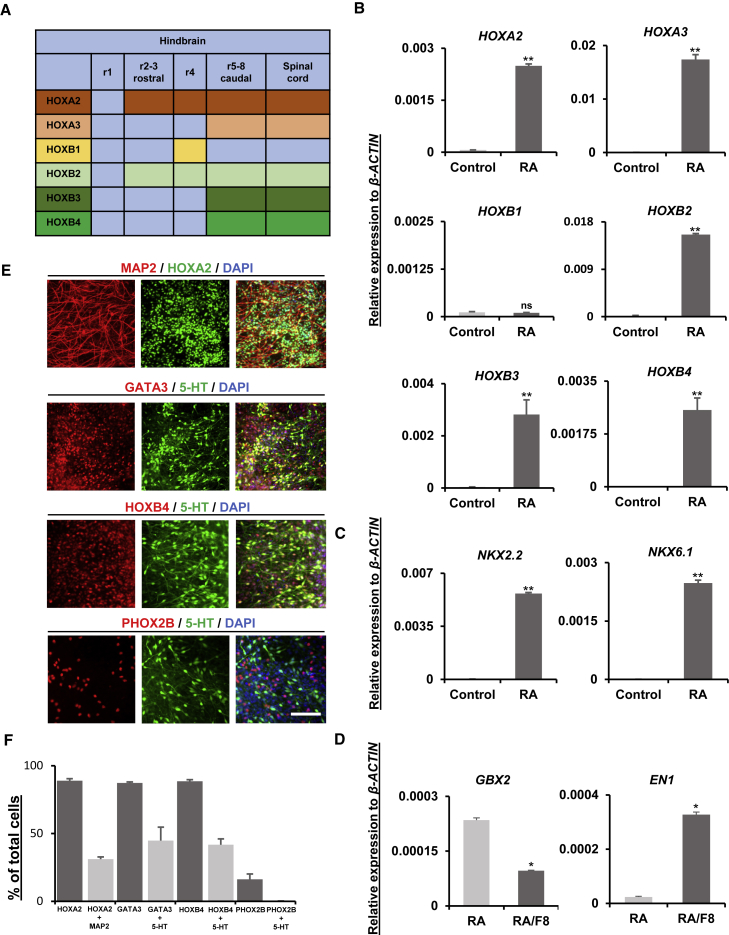
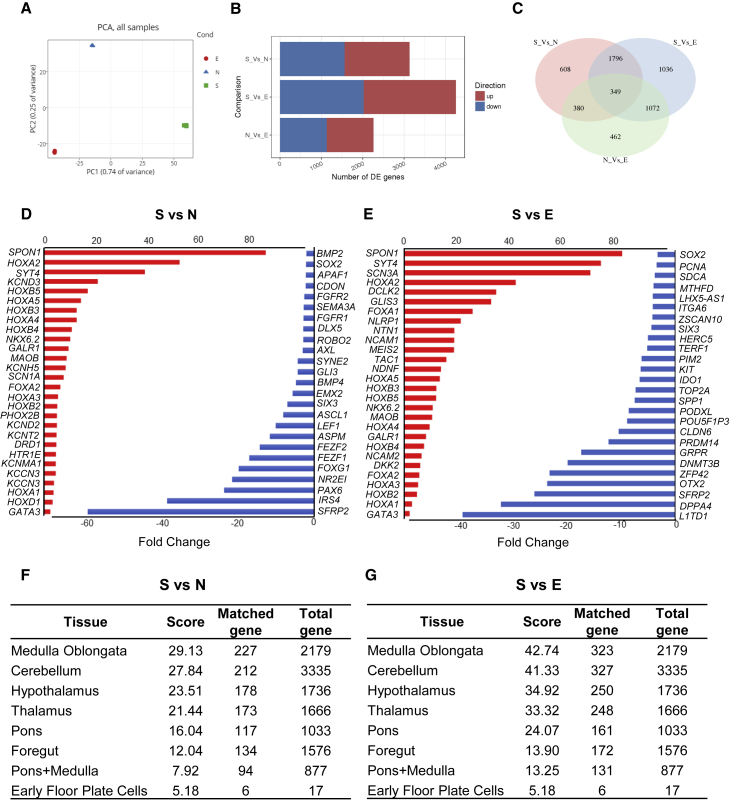
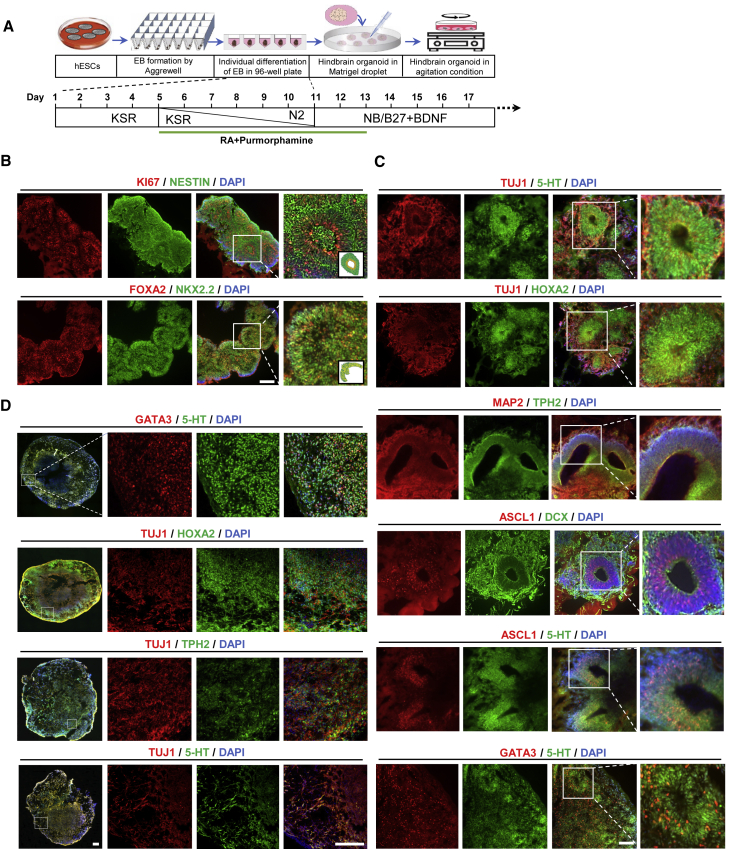
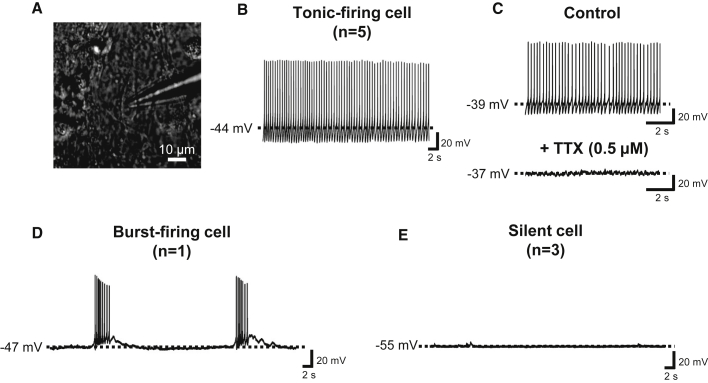
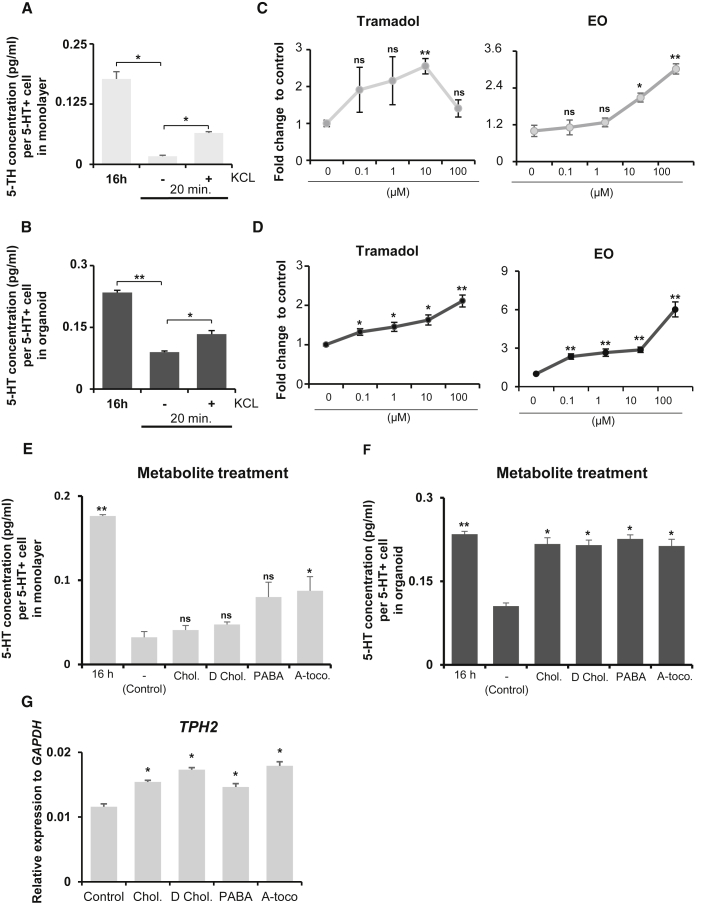
Serotonin (5-HT) neurons, the major components of the raphe nuclei, arise from ventral hindbrain progenitors. Based on anatomical location and axonal projection, 5-HT neurons are coarsely divided into rostral and caudal groups. Here, we propose a novel strategy to generate hindbrain 5-HT neurons from human pluripotent stem cells (hPSCs), which involves the formation of ventral-type neural progenitor cells and stimulation of the hindbrain 5-HT neural development. A caudalizing agent, retinoid acid, was used to direct the cells into the hindbrain cell fate. Approximately 30%-40% of hPSCs successfully developed into 5-HT-expressing neurons using our protocol, with the majority acquiring a caudal rhombomere identity (r5-8). We further modified our monolayer differentiation system to generate 5-HT neuron-enriched hindbrain-like organoids. We also suggest downstream applications of our 5-HT monolayer and organoid cultures to study neuronal response to gut microbiota. Our methodology could become a powerful tool for future studies related to 5-HT neurotransmission.

Keywords: hindbrain; human pluripotent stem cells; neuronal development; organoids; serotonin neurons.


Figures

None
Graphical abstract
Figure 1
Figure 1
Protocol for the differentiation of 5-HT neurons from hPSCs (A) Schematic representation of 5-HT neuron differentiation from hPSCs. KSR, knockout serum replacement medium. (B) Representative images of immunocytochemical analysis of proliferating NPC (KI67 and NESTIN), ventral (NKX2.2 and FOXA2), and visceral motor neuron (PHOX2B) markers on differentiation day 11. (C) Quantification of immunostaining images in (B) as the percentage of positive cells with the indicated antibodies among the DAPI-stained cells per microscopic field. (D) Time-dependent expression of GATA2, FEV, LMX1B, NKX2.2, FOXA2, and PHOX2B measured by qPCR. The y axis indicates the relative expression of mRNA normalized to β-ACTIN expression. Significantly different from day 0 at p < 0.05 and ∗∗p < 0.0001; ns, not significant; n = 4 independent experiments. (E) Immunocytochemistry analysis of 5-HT, TPH2, TUJ1, FEV, and MAP2 on differentiation day 30. (F) The percentage of single-positive or double-positive cells in (E) with the indicated antibodies among the DAPI-stained cells per microscopic field. All data are presented as the mean ± SEM (C, D, and F). Scale bar, 200 μm. See also Figure S1.
Figure 2
Figure 2
Regional characterization of 5-HT neurons (A) Illustrative table of the regional markers along the rostrocaudal hindbrain axis. (B) Relative mRNA expression of rhombomere-specific genes (HOXA2, HOXA3, HOXB1, HOXB2, HOXB3, and HOXB4), measured by qPCR on differentiation day 30 in neurons treated with LSB and purmorphamine, with or without 2 μM RA treatment. (C and D) Validation of the ventral (NKX2.2 and NKX6.1) (C) and rostrocaudal hindbrain (GBX2 and EN1) (D) marker expression on differentiation day 30 with real-time PCR. The y axis indicates the relative expression of mRNA normalized to β-ACTIN expression. Significantly different from control values at p < 0.05 and ∗∗p < 0.0001; ns, not significant; n = 3 independent experiments. (E) Immunocytochemical analysis of the regional hindbrain markers (HOXA2, GATA3, HOXB4, and PHOX2B) with MAP2 and 5-HT. (F) Percentage of single-positive or double-positive cells in (E) with the indicated antibodies among the DAPI-stained cells per microscopic field. All data are presented as the mean ± SEM (B–D and F). Scale bar, 200 μm. F8, FGF8.
Figure 3
Figure 3
Transcriptome analysis of 5-HT neurons (A) Principle-component analysis plot of nine independent samples for 5-HT neurons (S, three samples), non-patterned neurons (N, three samples), and undifferentiated hESCs (E, three samples). (B) Bar plot summarizes the comparison of the numbers of significant differentially expressed genes between N and E with S. (C) Venn diagram presents the overlap between the significantly differentially expressed genes. (D and E) Selected lists of differentially expressed genes comparing S versus N (D) or S versus E (E). Red bars depict the genes upregulated in S (positive fold change), and blue bars indicate genes downregulated in S (negative fold change). All genes that are shown had an adjusted p < 0.05. (F and G) GeneAnalytics Tissues & Cells analysis comparing upregulated gene lists of S versus N (F) or S versus E (G) with a database of genes expressed in specific human tissues and organs. DE, differentially expressed; PCA, principal-component analysis. See also Figures S2 and S3.
Figure 4
Figure 4
Generation of three-dimensional hindbrain-like 5-HT-organoids (A) Schematic representation of the hindbrain-like 5-HT-organoid generation process. (B) Representative images of immunocytochemical analysis of proliferating NPC markers (KI67 and NESTIN) and floor-plate markers (NKX2.2 and FOXA2) on differentiation day 17 (three left columns). (Insets) Schematic of the structural characteristics in organoids, as shown in the enlarged image (right). (C and D) Immunocytochemistry analysis of 5-HT, HOXA2, TPH2, TUJ1, ASCL1, DCX, GATA3, and MAP2 on differentiation day 30 (C) and of 5-HT, HOXA2, TPH2, TUJ1, and GATA3 on differentiation day 60 (D). Scale bars, 200 μm. See also Figure S4.
Figure 5
Figure 5
Electrophysiological analysis of 5-HT monolayer cultures (A) Bright-field illumination of a cell targeted with a glass micropipette electrode for whole-cell patch-clamp recordings. (B) Current-clamp recording trace of a tonic-firing cell (n = 5). (C) Current-clamp recording traces of a tonic-firing cell before (top) and after (bottom) TTX application. (D) Current-clamp recording trace of a burst-firing cell (n = 1). (E) Current-clamp recording trace of a silent cell (n = 3). Dashed lines indicate baseline or resting membrane potential. n, the number of recorded cells.
Figure 6
Figure 6
Applications of 5-HT monolayer and organoid cultures (A and B) 5-HT released from 5-HT neuron monolayer (A; day 65) and organoid (B; day 85) cultures after overnight (16 h) and 20 min incubation with or without 56 mM KCl treatment. (C and D) Fold change in 5-HT release in monolayer (C) and organoid (D) cultures after an hour treatment with tramadol or EO at various concentrations. (E and F) 5-HT released from the monolayer (E; day 65) and organoid (F; day 85) cultures after overnight (16 h) or 1 h incubation with or without treatment with the following metabolites: cholate (78 μM), deoxycholate (25 μM), p-aminobenzoate (1 μM), or α-tocopherol (8 μM). The y axis indicates the 5-HT concentration per individual 5-HT neuron in 24 well dish (A and E) or in organoid (B and F). (G) Relative expression of TPH2 in the 5-HT neuron monolayer culture (day 65) after 1 h incubation with or without metabolite treatments. The y axis indicates the relative expression of mRNA normalized to GAPDH expression. Significantly different from cultures after an hour incubation without KCl treatment (A and B) and corresponding control (C–G) values at p < 0.05 and ∗∗p < 0.0001; ns, not significant. n = 3 independent experiments. All data are presented as the mean ± SEM. A-toco, α-tocopherol; Chol, cholate; D Chol, deoxycholate; PABA, p-aminobenzoate.

References

    1. Allen Institute for Brain Science . internet resource; 2010. Allen Human Brain Atlas.
    1. Alonso A., Merchán P., Sandoval J.E., Sánchez-Arrones L., Garcia-Cazorla A., Artuch R., Ferrán J.L., Martínez-De-La-Torre M., Puelles L. Development of the serotonergic cells in murine raphe nuclei and their relations with rhombomeric domains. Brain Struct. Funct. 2013;218:1229–1277. - PMC - PubMed
    1. Bhaduri A., Andrews M.G., Mancia Leon W., Jung D., Shin D., Allen D., Jung D., Schmunk G., Haeussler M., Salma J. Cell stress in cortical organoids impairs molecular subtype specification. Nature. 2020;578:142–148. - PMC - PubMed
    1. Briscoe J., Ericson J. The specification of neuronal identity by graded sonic hedgehog signalling. Semin. Cell Dev. Biol. 1999;10:353–362. - PubMed
    1. Brodski C., Weisenhorn D.M.V., Signore M., Sillaber I., Oesterheld M., Broccoli V., Acampora D., Simeone A., Wurst W. Location and size of dopaminergic and serotonergic cell populations are controlled by the position of the midbrain-hindbrain organizer. J. Neurosci. 2003;23:4199–4207. - PMC - PubMed

Publication types

MeSH terms