Review
. 2021 Nov;37(11):995-1011.
doi: 10.1016/j.tig.2021.06.004. Epub 2021 Jul 6.

Genetic prediction of complex traits with polygenic scores: a statistical review

Affiliations
Review

Genetic prediction of complex traits with polygenic scores: a statistical review

Ying Ma et al. Trends Genet. 2021 Nov.

Abstract

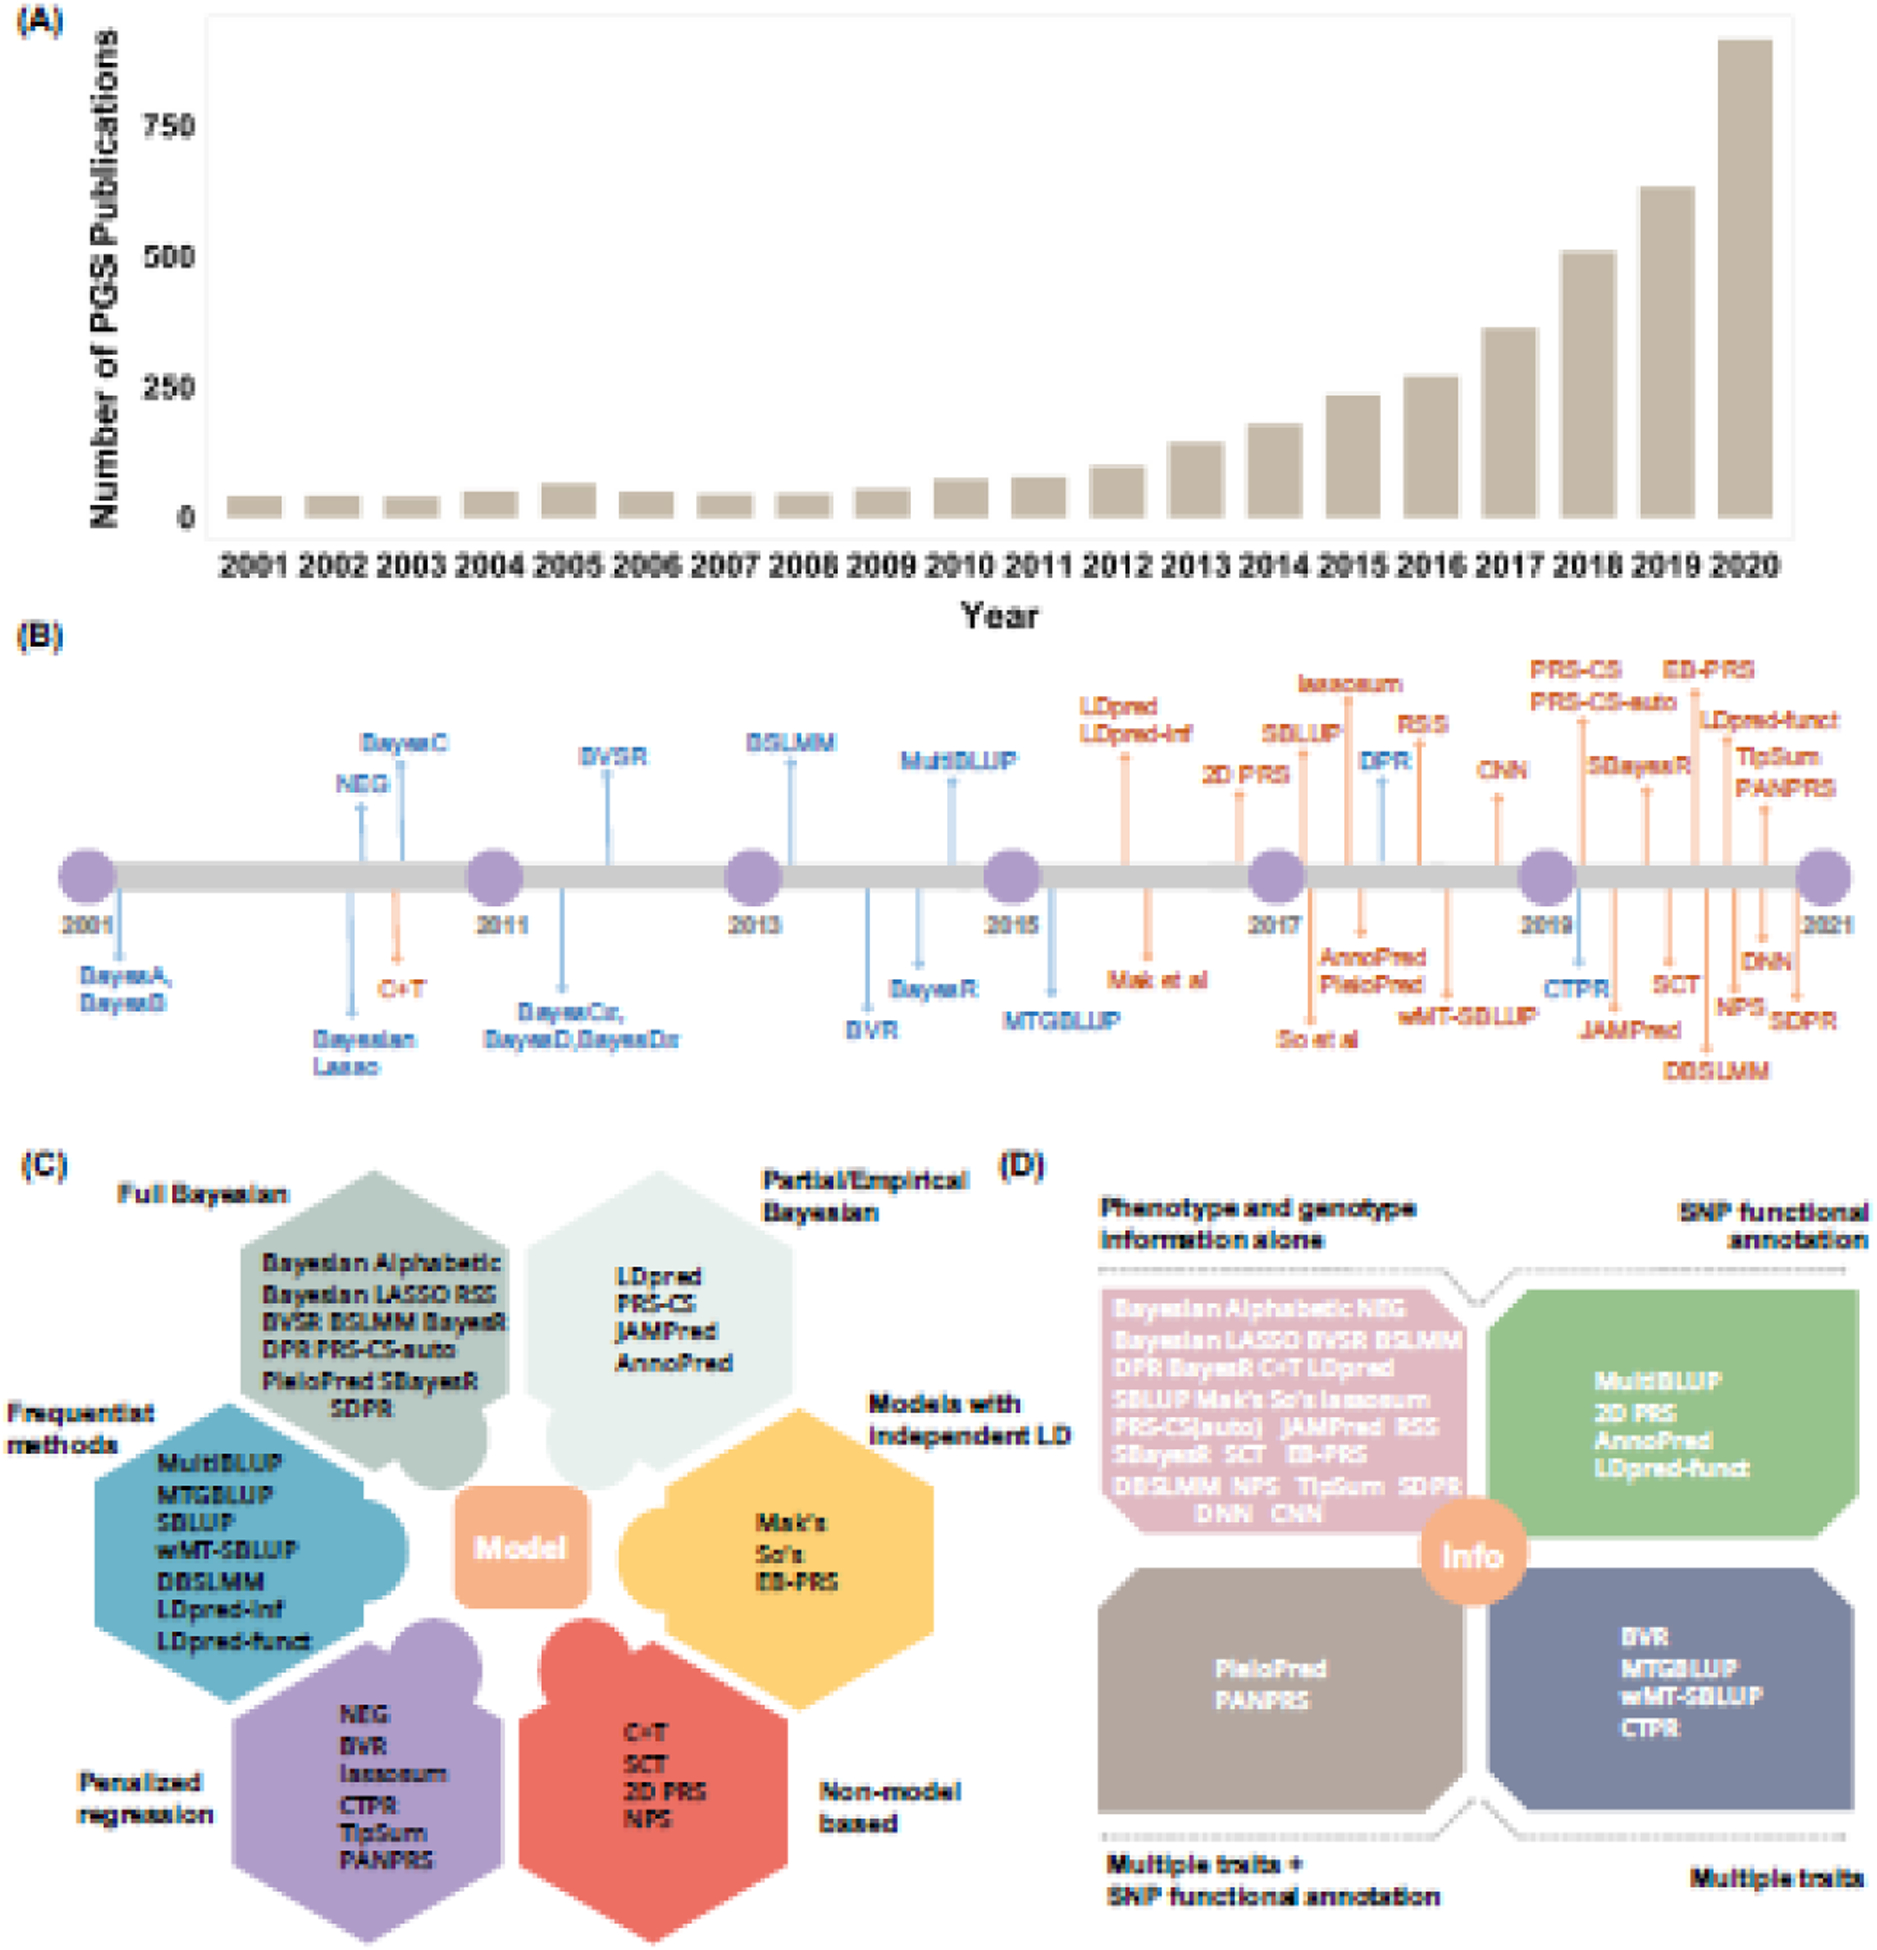
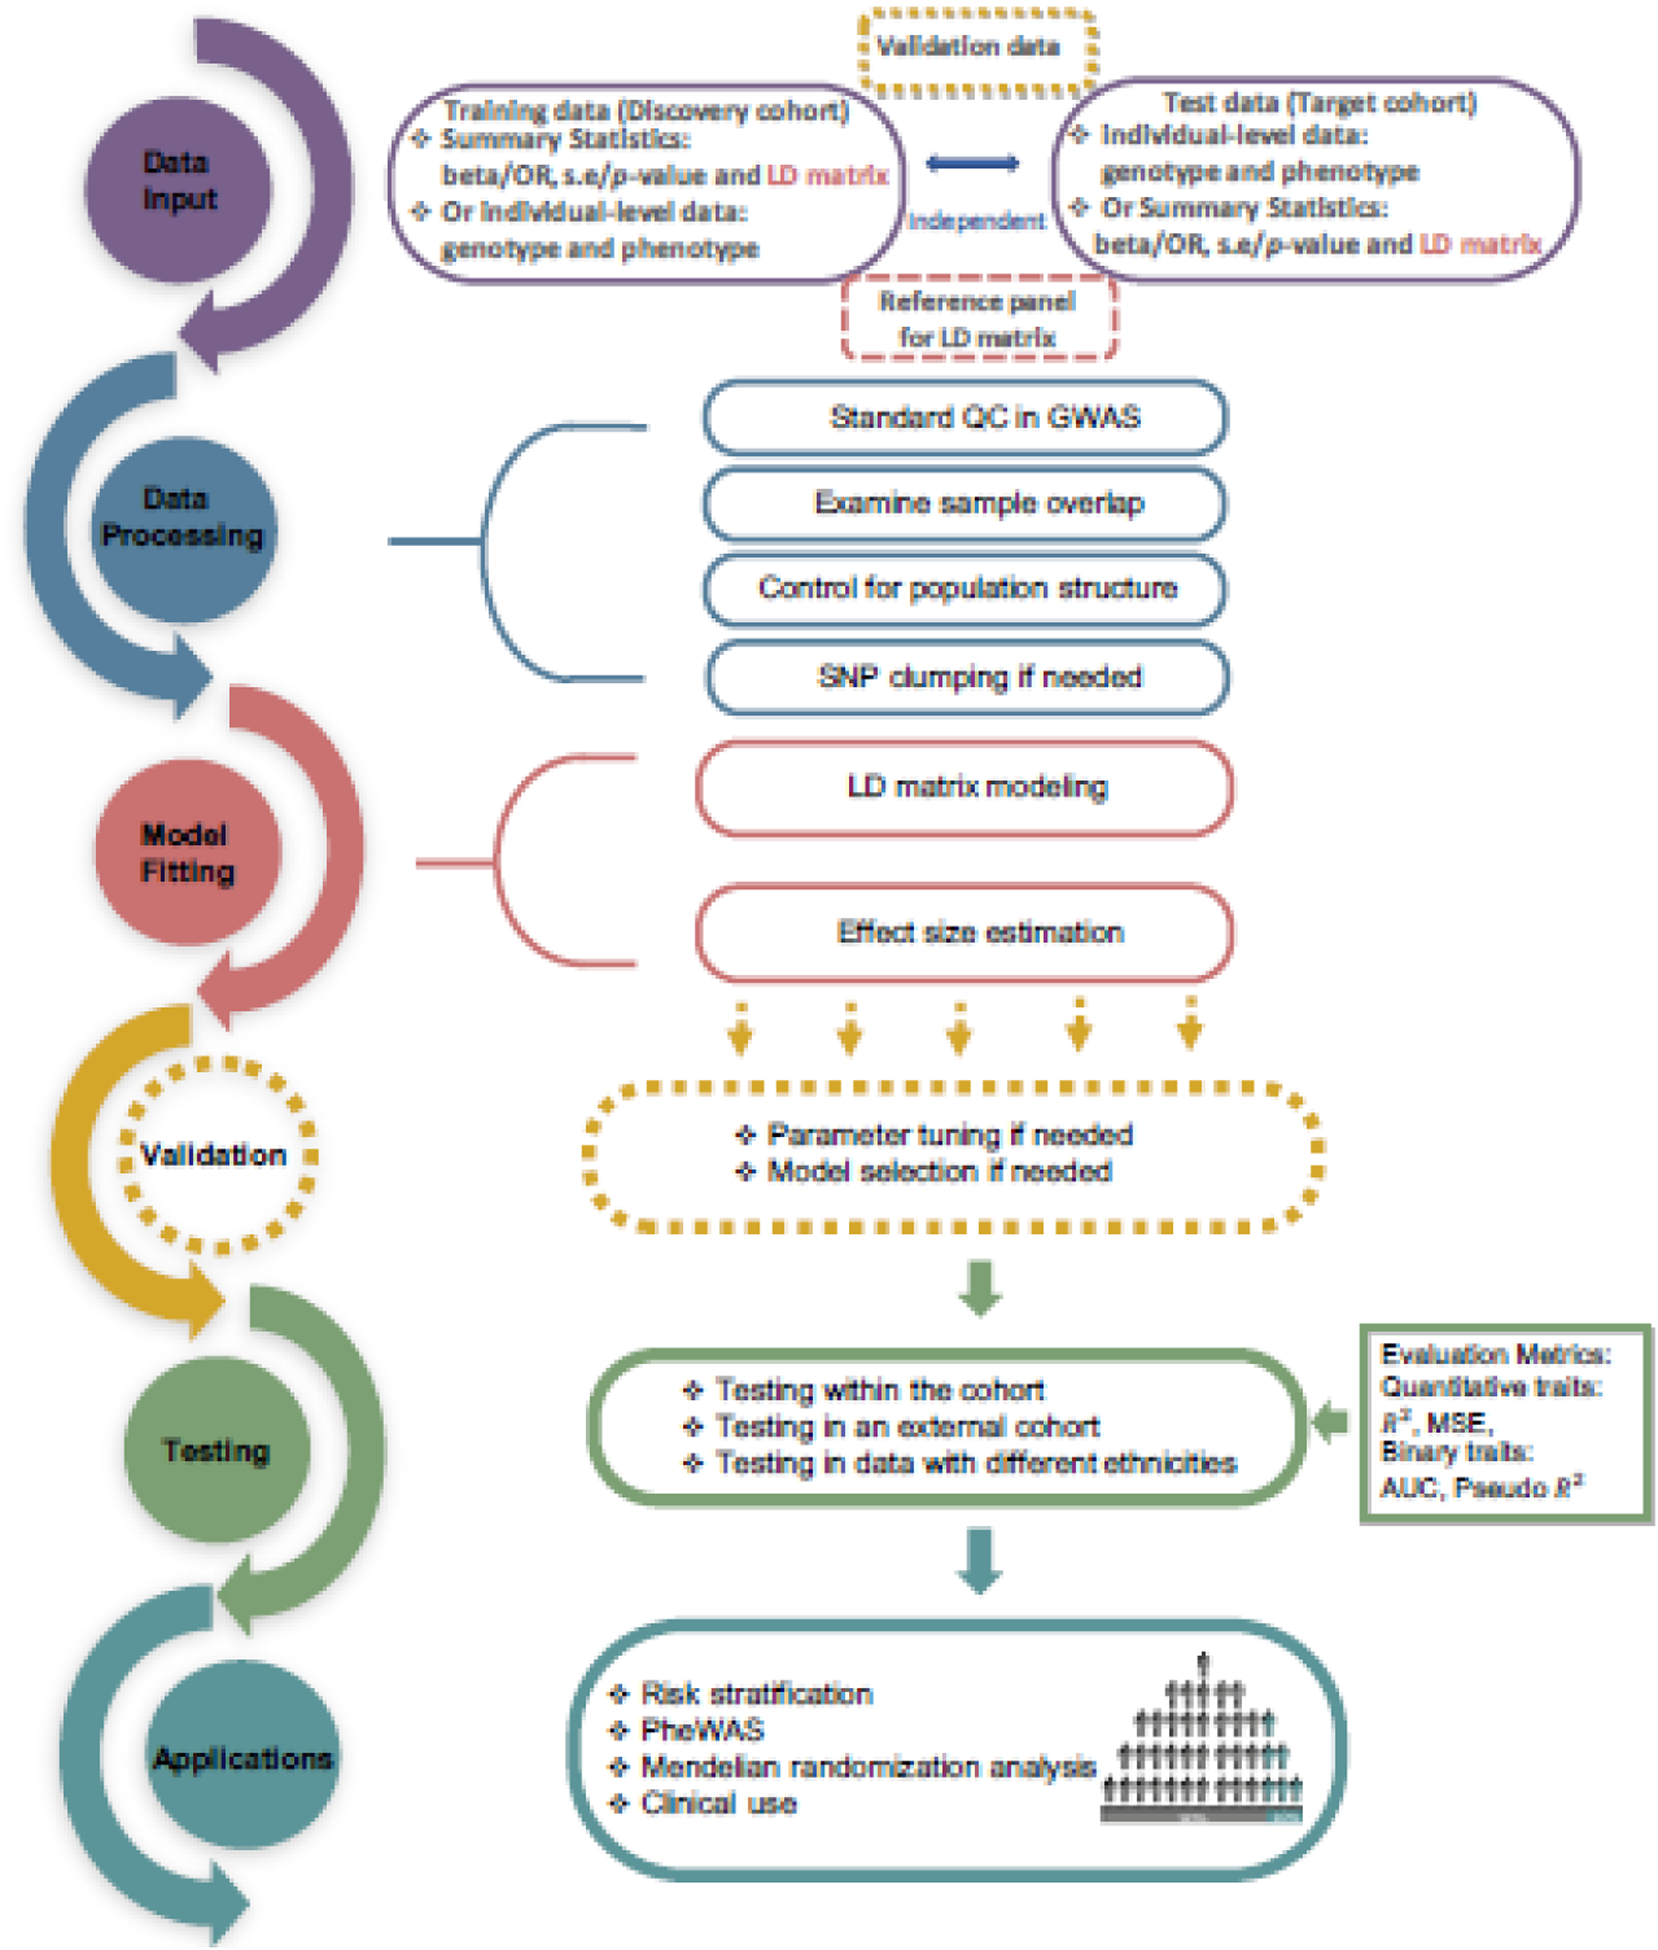
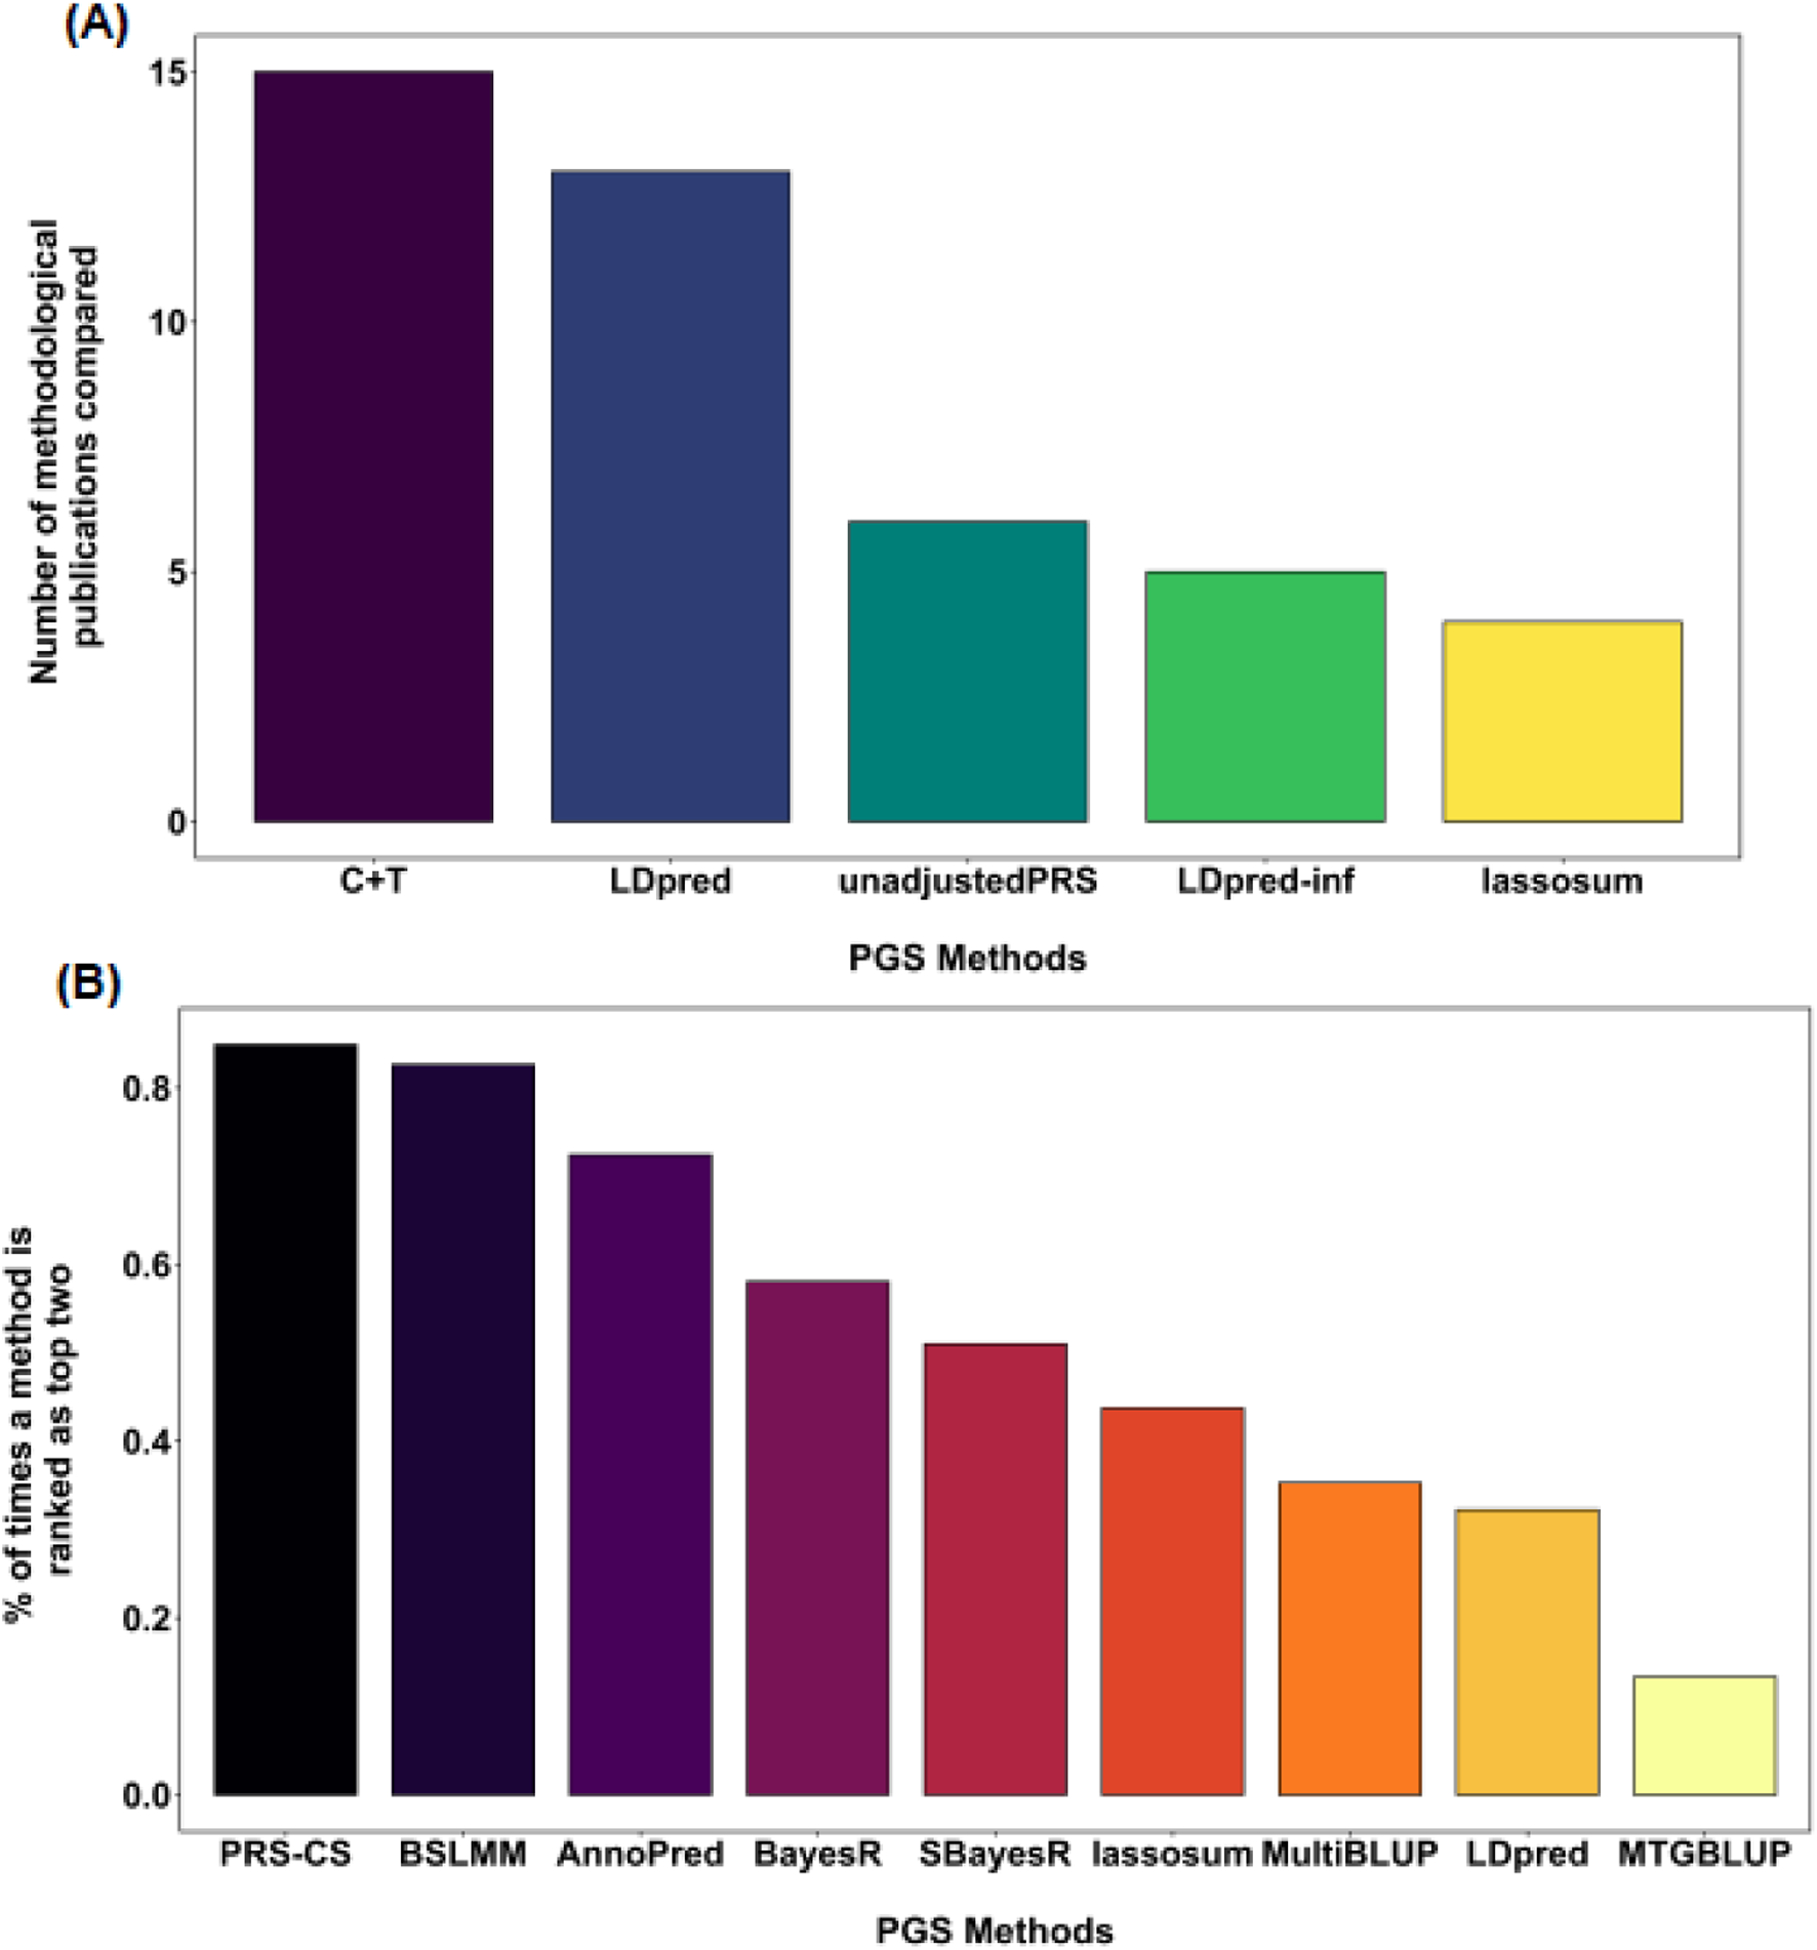
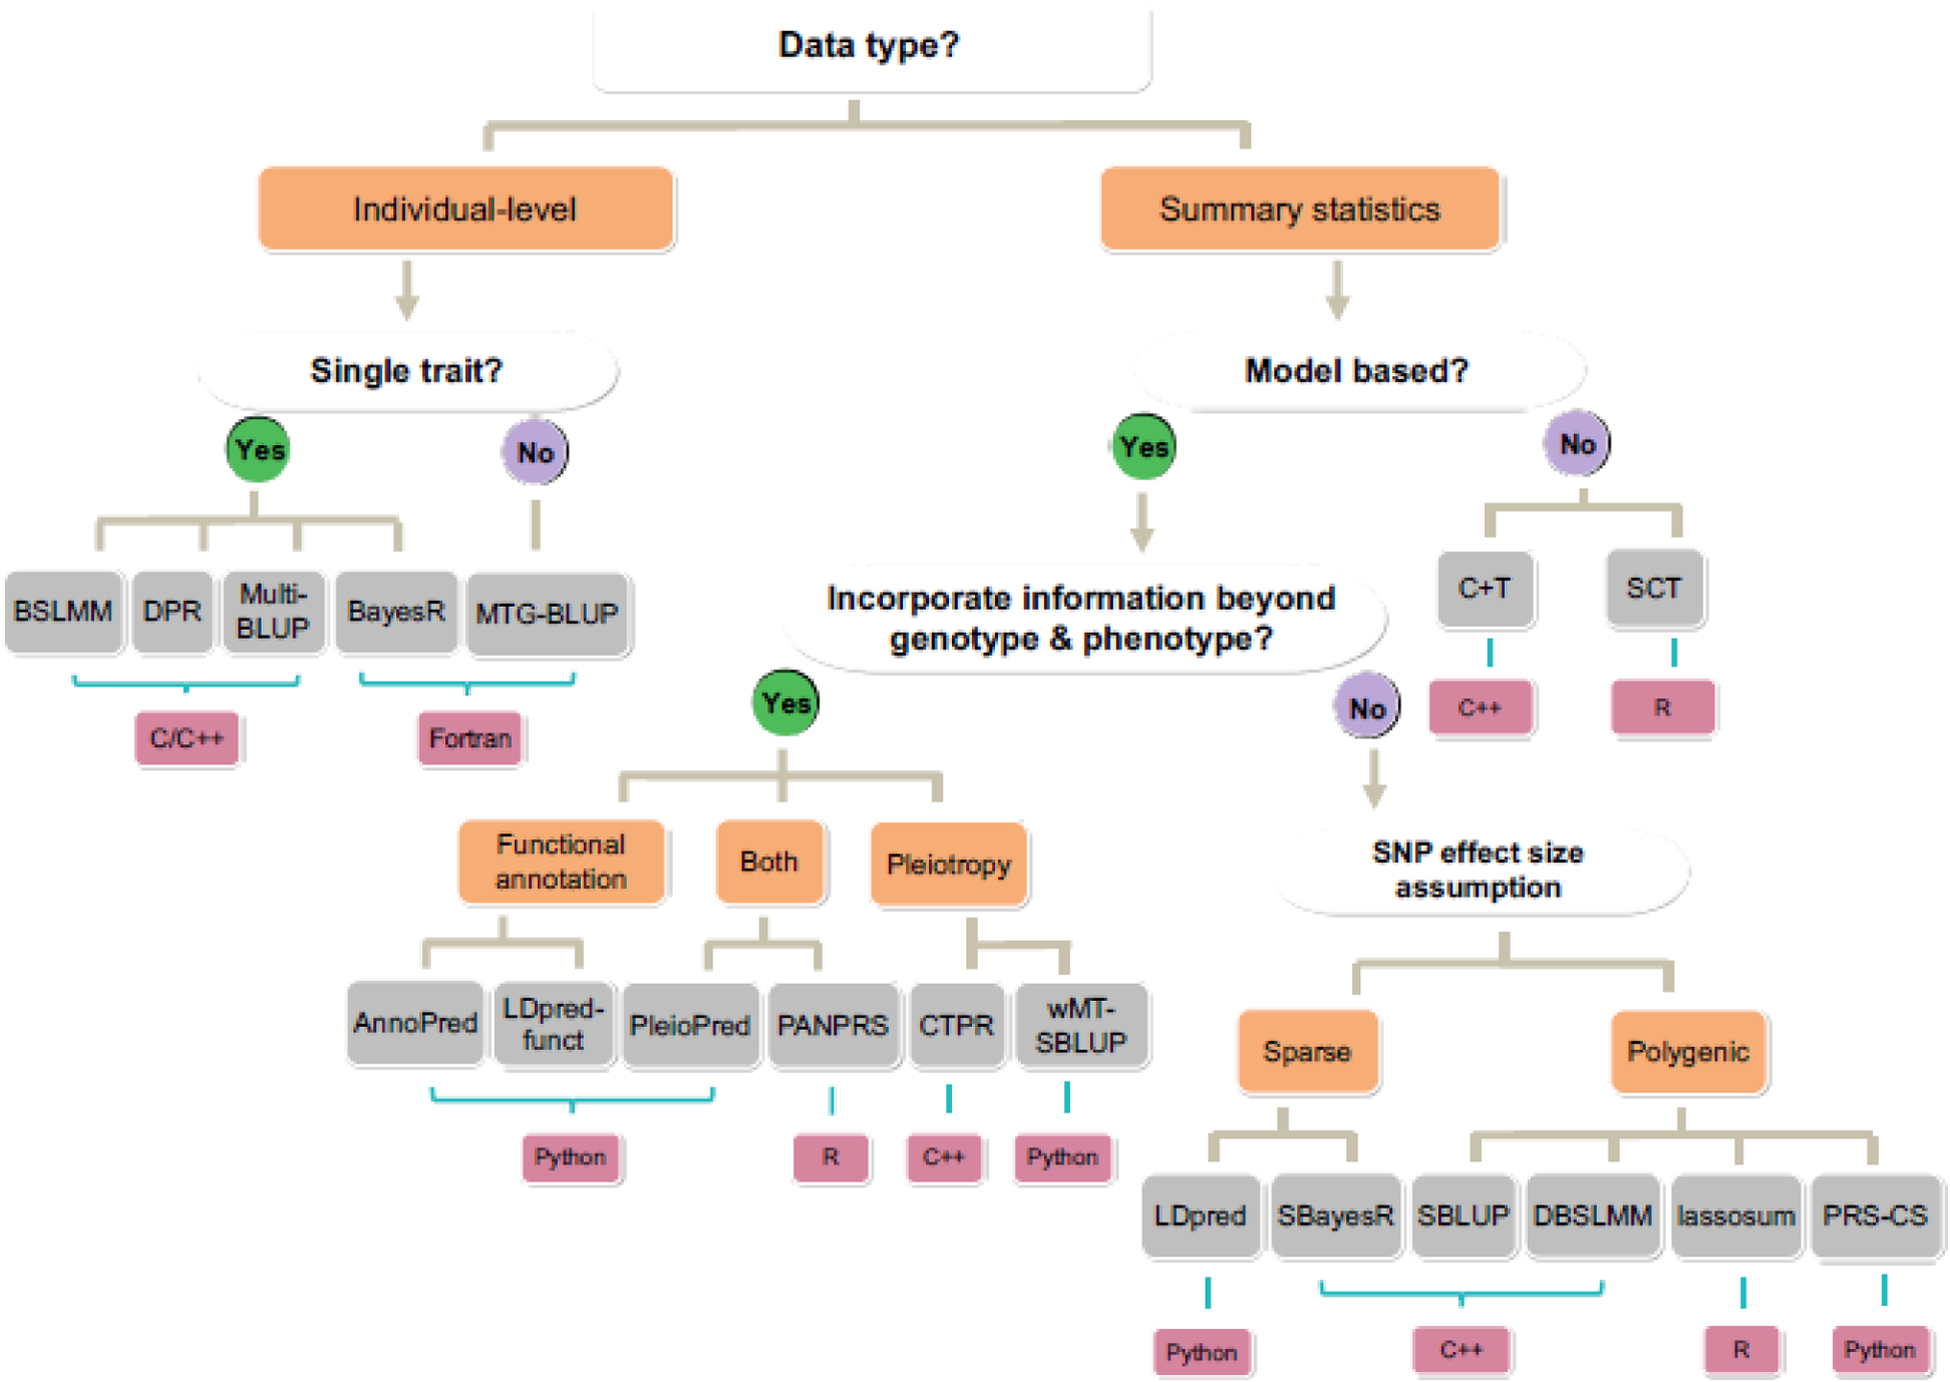
Accurate genetic prediction of complex traits can facilitate disease screening, improve early intervention, and aid in the development of personalized medicine. Genetic prediction of complex traits requires the development of statistical methods that can properly model polygenic architecture and construct a polygenic score (PGS). We present a comprehensive review of 46 methods for PGS construction. We connect the majority of these methods through a multiple linear regression framework which can be instrumental for understanding their prediction performance for traits with distinct genetic architectures. We discuss the practical considerations of PGS analysis as well as challenges and future directions of PGS method development. We hope our review serves as a useful reference both for statistical geneticists who develop PGS methods and for data analysts who perform PGS analysis.

Keywords: complex traits; genetic prediction; genome-wide association studies; polygenic risk scores; polygenic scores; statistical methods.


Conflict of interest statement

Declaration of interests No interests are declared.

Figures

Figure 1.
Figure 1.. An overview of PGS methods.
(A) The number of publications on polygenic scores increased substantially from 2001 to 2020, highlighting the popularity of PGS analysis. The number of publications is obtained by searching the key terms of “polygenic + score + or + polygenic + risk + score” on PubMed. (B) Timeline of the commonly used PGS methods that were developed in the past two decades. These PGS methods either use individual-level genotype and phenotype data as input (blue) or use summary statistics as input (orange). (C) PGS methods can be categorized into six categories based on their model and fitting strategy. Specifically, some PGS methods are model based and are described as a formal model with a corresponding fitting algorithm (colors other than red), while others are algorithm-based and are described as an algorithm or a fitting procedure without an explicit model (red). The model-based PGS methods can be further categorized based on the underlying inference algorithm: some are fully Bayesian and use Markov chain Monte Carlo (MCMC) for model fitting (grey); some are partial/empirical Bayesian, optimizing certain hyperparameters through grid search while obtaining other parameter estimates through MCMC (light grey); some are approximate approaches that assume independence across SNPs and use optimization for effect size estimation (yellow); some are frequentist in nature and can obtain an analytic solution without optimization (blue); and some are based on penalized regression and use iterative algorithms for parameter estimation (purple). (D) PGS methods can also be categorized in terms of the information used for PGS construction. Most PGS methods use only genotype and phenotype information from the GWAS on the trait of interest (pink). Some recent PGS methods can use additional SNP annotation information obtained from external data sources (green) and/or other phenotype information in addition to the phenotype of interest (taupe and navy blue).
Figure 2.
Figure 2.. A general pipeline for PGS construction and applications.
PGS methods require either two or three datasets as input: a training data, a test data, and if necessary, a validation data. These datasets need to undergo multiple steps of stringent quality control that include SNP filtering, overlap sample removal, adjustment of population stratification etc. The training data is then used to fit the desired PGS model for estimating the SNP effect sizes. For certain PGS methods, a validation data is needed to tune parameters in the model or perform model selection. The estimated SNP effect sizes are then used to construct PGS in a test data, where the predictive performance of PGS method is tested based on standard metrics. The constructed PGS are used for different applications, including risk stratification, PheWAS, and Mendelian randomization. Here, a dotted line box represents a step that is not necessary for all PGS methods.
Figure 3.
Figure 3.. Predictive performance of common PGS methods as revealed in the PGS methodological publications.
(A) The bar plot shows the top five PGS methods that have been compared the most in the real data applications in the 26 PGS methodological publications listed in Figure S1. y-axis denotes the number of times a specific PGS method is compared in a different PGS methodological publication. Note that PGS methods developed earlier tend to be compared more often than methods developed later. (B) The bar plot shows the percentage of times a PGS method is ranked as the top two methods in terms of prediction performance in human traits in the PGS methodological publications. The percentage is calculated both across publications and across traits examined in all PGS methodological publications listed in Figure S1. In both A and B, we only considered PGS methods that have been compared for at least one time in a PGS methodological publication from a different research group.
Figure 4.
Figure 4.. A decision tree on which methods to use for PGS analysis.
The decision tree begins with input data type, followed by the choices of analyzing single versus multiple traits, using model-based methods versus algorithm-based methods, whether to incorporate information beyond genotype and phenotype, as well as the detailed SNP effect size assumptions (blue brackets). The choices include Yes/No answers (Yes in green circles and No in purple circles) or other qualitative options (orange brackets). Different choices lead to different PGS methods (grey brackets), which are implemented with different computing language (pink brackets).

References

    1. Andersson L and Georges M (2004) Domestic-animal genomics: deciphering the genetics of complex traits. Nat. Rev. Genet 5, 202–212 - PubMed
    1. Frazer KA et al. (2009) Human genetic variation and its contribution to complex traits. Nat. Rev. Genet 10, 241–251 - PubMed
    1. McCarthy MI et al. (2008) Genome-wide association studies for complex traits: consensus, uncertainty and challenges. Nat. Rev. Genet 9, 356–369 - PubMed
    1. Martincorena I and Campbell PJ (2015) Somatic mutation in cancer and normal cells. Science 349, 1483–1489 - PubMed
    1. Nielsen R et al. (2011) Genotype and SNP calling from next-generation sequencing data. Nat. Rev. Genet 12, 443–451 - PMC - PubMed

Publication types

MeSH terms