. 2021 Jul 9;7(28):eabh3457.
doi: 10.1126/sciadv.abh3457. Print 2021 Jul.

The fluid shear stress sensor TRPM7 regulates tumor cell intravasation

Affiliations

The fluid shear stress sensor TRPM7 regulates tumor cell intravasation

Christopher L Yankaskas et al. Sci Adv. .

Abstract

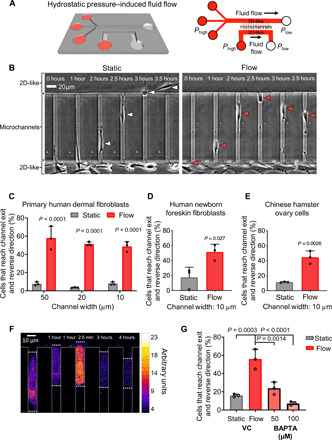
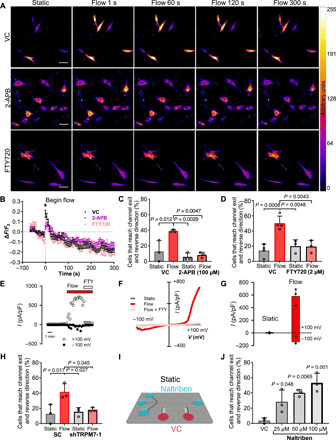
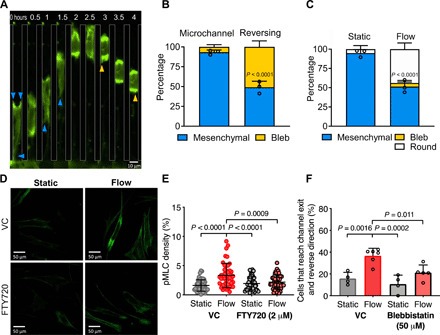
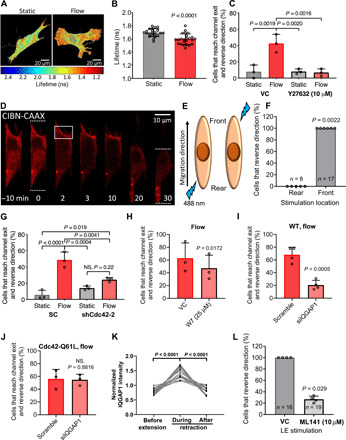
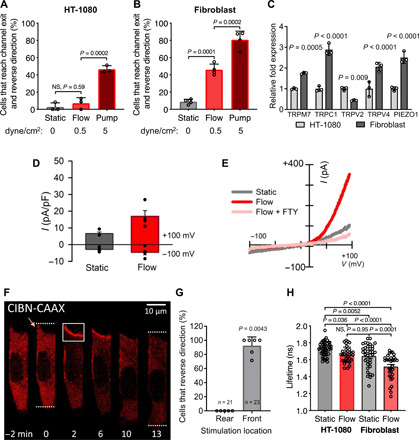
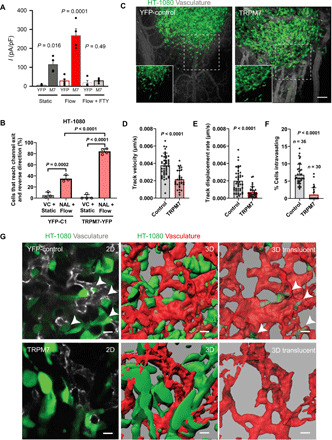
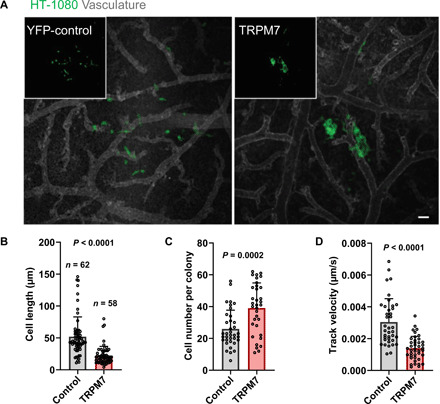
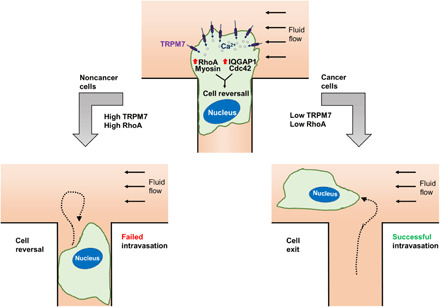
Tumor cell intravasation preferentially occurs in regions of low fluid shear because high shear is detrimental to tumor cells. Here, we describe a molecular mechanism by which cells avoid high shear during intravasation. The transition from migration to intravasation was modeled using a microfluidic device where cells migrating inside longitudinal tissue-like microchannels encounter an orthogonal channel in which fluid flow induces physiological shear stresses. This approach was complemented with intravital microscopy, patch-clamp, and signal transduction imaging techniques. Fluid shear-induced activation of the transient receptor potential melastatin 7 (TRPM7) channel promotes extracellular calcium influx, which then activates RhoA/myosin-II and calmodulin/IQGAP1/Cdc42 pathways to coordinate reversal of migration direction, thereby avoiding shear stress. Cells displaying higher shear sensitivity due to higher TRPM7 activity levels intravasate less efficiently and establish less invasive metastatic lesions. This study provides a mechanistic interpretation for the role of shear stress and its sensor, TRPM7, in tumor cell intravasation.


Figures

Fig. 1
Fig. 1. Fibroblasts reverse migration direction upon sensing fluid shear at their leading edge, which promotes rapid entry of extracellular calcium.
(A) Perspective view and schematic of the microfluidic device consisting of an array of parallel microchannels arranged in a ladder-like configuration and sandwiched orthogonally between two large 2D-like channels (W = 400 μm, H = 30 μm) where fluid flow is controlled. Cell migration was tracked in collagen I–coated microchannels of prescribed width (W = 10, 20, or 50 μm), height (H = 10 μm), and length (L = 200 μm). (B) In the absence of flow (static conditions), most of primary dermal fibroblasts migrate from the 2D-like seeding area into microchannels and exit to the other side into the apposing 2D-like area (white arrowheads). In contrast, 40 to 60% of these cells reverse migration direction when they reach the microchannel end and sense fluid flow in the apposing 2D-like area (red arrowheads). (C) Percentage of primary human dermal fibroblasts, (D) human newborn foreskin fibroblasts, or (E) CHO migrating cells that reach the end of the microchannels and then reverse their migration direction to remain in the microchannels under static or flow (0.5 dyne/cm2) conditions in the 2D-like regions. (F) Use of Fluo-4 Direct to visualize intracellular calcium in a migrating dermal fibroblast cell as it reaches the end of a microchannel where fluid flow is present. Scale bar, 10 μm. (G) Percentage of BAPTA- or vehicle control (VC)–treated cells that reverse migration direction in the presence of shear flow (0.5 dyne/cm2). Data represent the means ± SD from three independent experiments. Statistical comparisons were made between static and flow using two-way analysis of variance (ANOVA) followed by Sidak’s multiple comparisons test (C) or Student’s t test (D and E) or one-way ANOVA followed by Tukey’s post hoc test (G). See also fig. S1.
Fig. 2
Fig. 2. TRPM7 is the key fluid shear sensor, which mediates the reversal of fibroblast migration direction.
(A and B) Fluo-4 Direct fluorescence in vehicle control, 2-aminoethoxydiphenyl borate (2-APB)–, or fingolimod hydrochloride (FTY720)–treated dermal fibroblasts in a 2D-like channel imaged every 6 s for 1 min under static conditions followed by exposure to shear flow. Scale bars, 50 μm. (B) Quantification of Fluo-4 Direct fluorescence (ΔF/F0) from (A), where ΔF = FF0, F = fluorescence at a given time point, and F0 = average fluorescence intensity under static conditions. Data represent means ± SEM for n > 25 cells pooled from three independent experiments. *P < 0.05, two-way ANOVA followed by Tukey’s post hoc test. Percentage of cells that reverse migration direction following treatment with (C) 2-APB (100 μM), (D) FTY720 (2 μM) or vehicle control. (E) Time course of whole-cell TRPM7-like cationic currents recorded at +100 and −100 mV in wild-type primary fibroblasts exposed to flow condition (10 μl/s) followed by exposure to 10 μM FTY720. (F) Current-voltage relationships of whole-cell cationic currents recorded under static, flow, and flow + FTY conditions. (G) Mean current densities measured under static and flow conditions in wild-type primary fibroblasts (n = 6). P = 0.02 paired t test between static versus flow. (H) Percentage of scramble control (SC) or TRPM7-knockdown cells that reverse migration direction under static or flow conditions. (I) Schematic of microfluidic device after replacement of the medium in the channel opposite to the seeding channel with medium containing naltriben or vehicle control. (J) Percentage of fibroblasts that reverse migration direction under static conditions at the end of the microchannels in response to naltriben or vehicle control as shown in (I). Data represent means ± SD from n ≥ three independent experiments. P values calculated one-way ANOVA followed by Tukey’s post hoc test unless otherwise stated in the legend. See also figs. S2 and S3.
Fig. 3
Fig. 3. Fluid shear activates myosin-II contractility, which is required for reversal of fibroblast migration direction.
(A) Representative images of a migrating fibroblast expressing Lifeact-GFP imaged by epifluorescence at ×20 magnification. Shear flow is present perpendicular to the microchannel exits. Blue arrowheads mark cell protrusions. Yellow arrowheads mark cell blebs. (B) Migration phenotype of Lifeact-GFP–expressing fibroblasts in microchannels with flow present at the exits. Left bar, phenotype analysis of all cells migrating in the microchannel before reaching the end. Right bar, phenotype analysis of cells that have reached the end of the microchannel and reversed their migration direction. (C) Percentage of Lifeact-GFP–expressing fibroblasts exhibiting a protrusive, blebbing, or round morphology after exiting the microchannel into a 2D-like area under static (left) or flow (right) conditions. P value was calculated by two-way ANOVA followed by Sidak’s multiple comparisons test. Data represent means ± SD from three independent experiments. Data points represent percentage values of protrusive cells from individual experiments. (D) Representative confocal images of cells in 2D under static conditions or exposed to shear flow for 5 min and then fixed and immunostained for pMLC. (E) Quantification of pMLC fluorescence density. Data points represent values for individual cells pooled from three independent experiments. (F) Percentage of cells that reverse migration direction when treated with blebbistatin (50 μM) or a vehicle control. Data represent means ± SD from ≥3 independent experiments. Data points represent the percentage value from individual experiments. P values in (E) and (F) were calculated by one-way ANOVA followed by Tukey’s multiple comparisons test.
Fig. 4
Fig. 4. RhoA and Cdc42 act in concert to mediate the reversal of migration direction.
(A) Representative pixelwise heatmaps of RhoA FRET fluorescence lifetimes (ns) in fibroblasts under static or flow conditions. (B) Quantification of FLIM-FRET lifetimes. Data points represent the average fluorescent lifetime over a whole cell, pooled from three independent experiments. (C) Percentage of cells that reverse migration direction following treatment with Y27632 (10 μM) or vehicle control. (D) Fibroblasts expressing OptoGEF-RhoA and CAAX-CIBN-GFP. Dotted lines indicate the cell’s leading and trailing edges during confined migration at t = 0 and 30 min. For 2 min, the cell moves upward and is then stimulated with blue light in the region enclosed by the box. OptoGEF-RhoA enrichment is observed at the plasma membrane in this region, and the cell reverses its migration direction. (E) OptoGEF-RhoA–expressing fibroblasts migrating in microchannels were stimulated with blue light at the front or rear. (F) Percentage of cells that reversed their migration direction after optogenetic stimulation at the front or rear. Data points represent percentage of cells from an individual experiment. n = number of cells assayed. Percentage of (G) scramble control or Cdc42-KD cells, (H) vehicle control or W7-treated cells, (I) scramble control or siIQGAP1 cells, and (J) and scramble control or siIQGAP1 cells transduced with the constitutively active Cdc42-Q61L that reverse migration direction. NS, not significant; WT, wild type. (K) GFP-IQGAP1 intensity at cell edge during extension-retraction events (n = 18 cells from five independent experiments). (L) Percentage of OptoGEF-RhoA–expressing fibroblasts treated with ML141 (10 μM) or vehicle control that reverse their migration direction after stimulation with blue light at the leading edge (LE). Data represent means ± SD from three independent experiments (C and G to J). Statistical comparisons were made using Student’s t test (B and H to J) or one-way (C and G) or two-way ANOVA (K) followed by Tukey’s post hoc test and the Mann-Whitney U test (L and F). See also figs. S4 and S5.
Fig. 5
Fig. 5. HT-1080 fibrosarcoma cells display reduced TRPM7 activity, fluid shear sensitivity, and RhoA activity.
(A) Percentage of HT-1080 fibrosarcoma or (B) primary dermal fibroblasts that reverse migration direction at the end of the microchannels under static or prescribed shear flow conditions. (C) Relative mRNA expression of HT-1080 and fibroblast cells assessed by qPCR. Data represent means ± SD from ≥3 independent experiments (A to C). (D) Current-voltage relationships of whole-cell cationic currents recorded from HT-1080 fibrosarcoma cells under static and flow conditions. (E) Mean current densities measured under static, flow, and flow + FTY conditions in human wild-type primary fibroblasts (n = 4). P = 0.03 paired t test static versus flow. (F) HT-1080 cells expressing OptoGEF-RhoA and CAAX-CIBN-GFP. Dotted lines indicate the cell’s leading and trailing edges during confined migration at t = 0 or 13 min. Yellow arrow indicates a leading edge protrusion at t = 0. For 2 min, the cell moves upward and is then stimulated with blue light in the region indicated by the white box. OptoGEF-RhoA enrichment is observed at the plasma membrane in this region, and the cell reverses its migration direction. (G) Percentage of HT-1080 cells that reversed their migration direction after optogenetic stimulation at the front or rear. Data points represent percentage of cells from an individual experiment. n = number of cells assayed. (H) Comparison of RhoA FLIM for HT-1080 and fibroblasts in 2D under static or flow conditions. HT-1080 cells have reduced RhoA activity under static conditions compared with fibroblasts. Flow increases HT-1080 RhoA activity to similar levels to fibroblasts under static conditions but not to the level of fibroblasts in flow. Statistical comparisons were made using one-way ANOVA followed by Tukey’s post hoc test (A to C and H) or the Mann-Whitney U test (G).
Fig. 6
Fig. 6. HT-1080 fibrosarcoma cells gain acute shear sensitivity upon overexpressing TRPM7 and display reduced invasion out of the primary tumor and intravasation.
(A) Mean current densities measured under static and flow conditions in the presence or absence of FTY in HT-1080 cells transfected with YFP or mouse TRPM7-YFP. (B) Percentage of HT-1080 cells transfected with either TRPM7-YFP or YFP-C1 that reverse migration direction under static or shear flow conditions. Cells experiencing shear flow were treated with 50 μM naltriben (NAL) while those under static conditions with vehicle control. Data represent means ± SD from ≥3 independent experiments with >40 total cells analyzed per condition. Statistical comparison was performed using one-way ANOVA followed by Tukey’s post hoc test. (C) Representative images showing primary tumors formed by control (YFP-C1) or TRPM7-overexpressing (TRPM7-YFP) HT-1080 cells. Images are maximum intensity projections of 3D reconstructions. Insets show YFP signal alone from the areas marked by dashed squares. Quantification of average cancer cell (D) track velocity and (E) displacement rate at the invasive fronts of tumors formed by control or TRPM7-overexpressing HT-1080 cells. (F) Quantification of cancer cell intravasation rate for tumors formed by control or TRPM7-overexpressing HT-1080 cells. (G) Representative images from the primary tumors formed by control or TRPM7-overexpressing HT-1080 cells showing single optical sections (left), 3D reconstructions (middle), and 3D translucent rendering of vasculature with intravasated cancer cells inside the vascular lumen (right). White arrowheads point to intravasating HT-1080 cells at vascular wall breaches. In (D) to (F), data are means + SD with statistical comparison made using unpaired t test (D and E) or Mann-Whitney test (F). Scale bars, 100 μm (C) or 20 μm (G). See also fig. S6.
Fig. 7
Fig. 7. TRPM7 overexpression in HT-1080 fibrosarcoma cells inhibits invasive metastatic lesion formation.
(A) Representative images showing metastatic lesions formed by control (YFP-C1) or TRPM7-overexpressing (TRPM7-YFP) HT-1080 cells. Images are maximum intensity projections of 3D reconstructions. Insets show YFP signal alone. Quantification of average (B) cancer cell length, (C) cancer cell number, and (D) cancer cell track velocity within the metastatic lesions formed by control or TRPM7-overexpressing HT-1080 cells. Data are means + SD with statistical comparison made using unpaired t test. Scale bar, 50 μm.
Fig. 8
Fig. 8. Schematic summarizing the cascade of signaling events following cell exposure to fluid shear.

References

    1. Weigelin B., Bakker G.-J., Friedl P., Intravital third harmonic generation microscopy of collective melanoma cell invasion: Principles of interface guidance and microvesicle dynamics. Dermatol. Int. 1, 32–43 (2012). - PMC - PubMed
    1. Wolf K., Alexander S., Schacht V., Coussens L. M., von Andrian U. H., van Rheenen J., Deryugina E., Friedl P., Collagen-based cell migration models in vitro and in vivo. Semin. Cell Dev. Biol. 20, 931–941 (2009). - PMC - PubMed
    1. Chiang S. P., Cabrera R. M., Segall J. E., Tumor cell intravasation. Am. J. Physiol. Cell Physiol. 311, C1–C14 (2016). - PMC - PubMed
    1. Stoletov K., Montel V., Lester R. D., Gonias S. L., Klemke R., High-resolution imaging of the dynamic tumor cell vascular interface in transparent zebrafish. Proc. Natl. Acad. Sci. U.S.A. 104, 17406–17411 (2007). - PMC - PubMed
    1. Hashizume H., Baluk P., Morikawa S., McLean J. W., Thurston G., Roberge S., Jain R. K., McDonald D. M., Openings between defective endothelial cells explain tumor vessel leakiness. Am. J. Pathol. 156, 1363–1380 (2000). - PMC - PubMed