. 2021 Dec 1;11(12):3106-3125.
doi: 10.1158/2159-8290.CD-21-0211.

Cholesterol Auxotrophy as a Targetable Vulnerability in Clear Cell Renal Cell Carcinoma

Affiliations

Cholesterol Auxotrophy as a Targetable Vulnerability in Clear Cell Renal Cell Carcinoma

Romain Riscal et al. Cancer Discov. .

Abstract

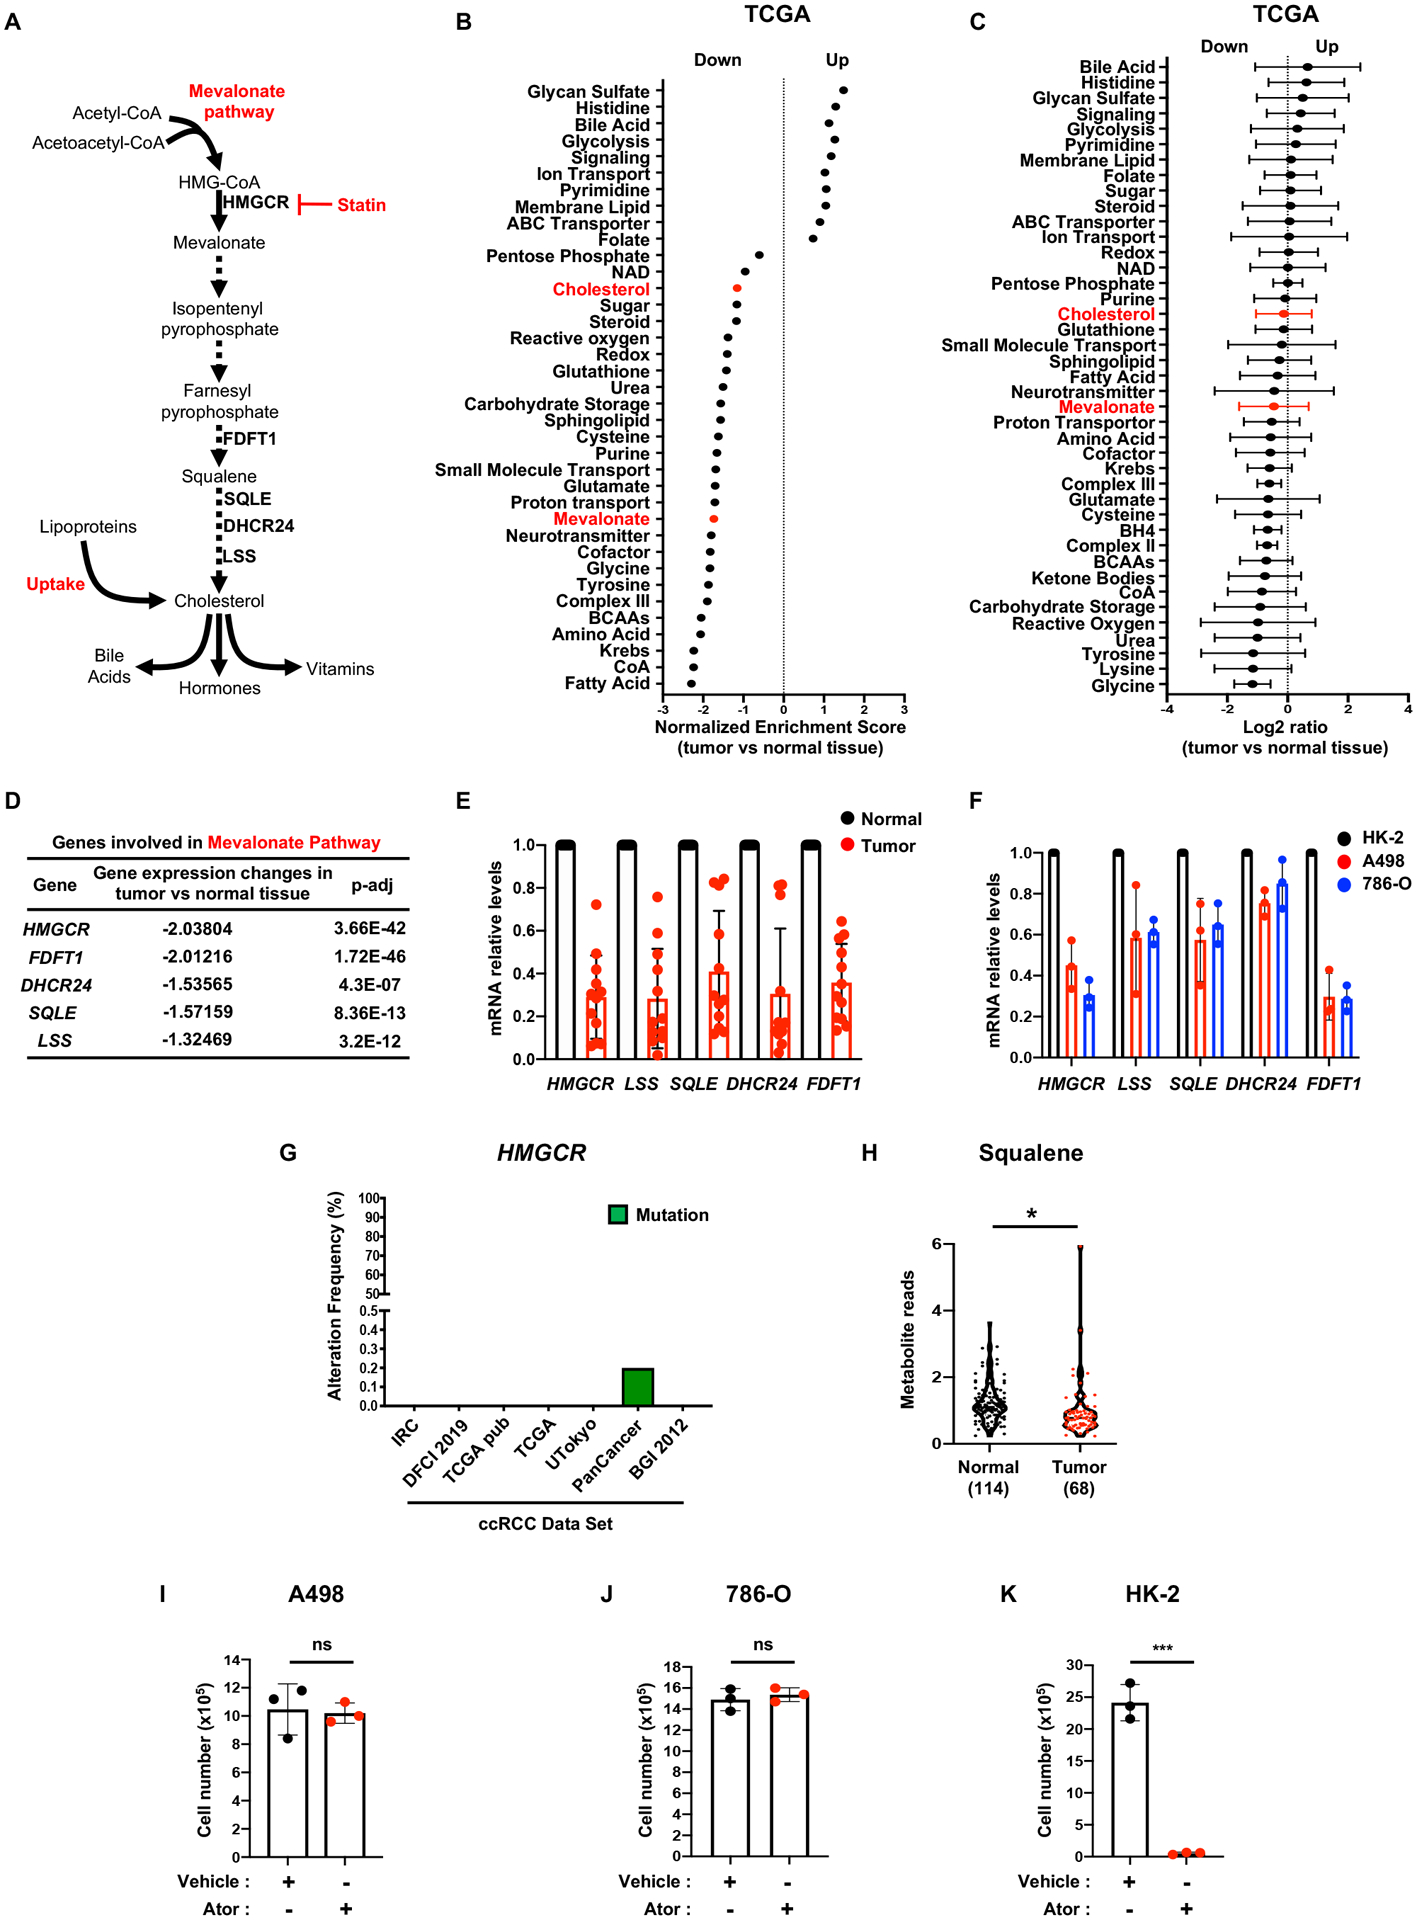
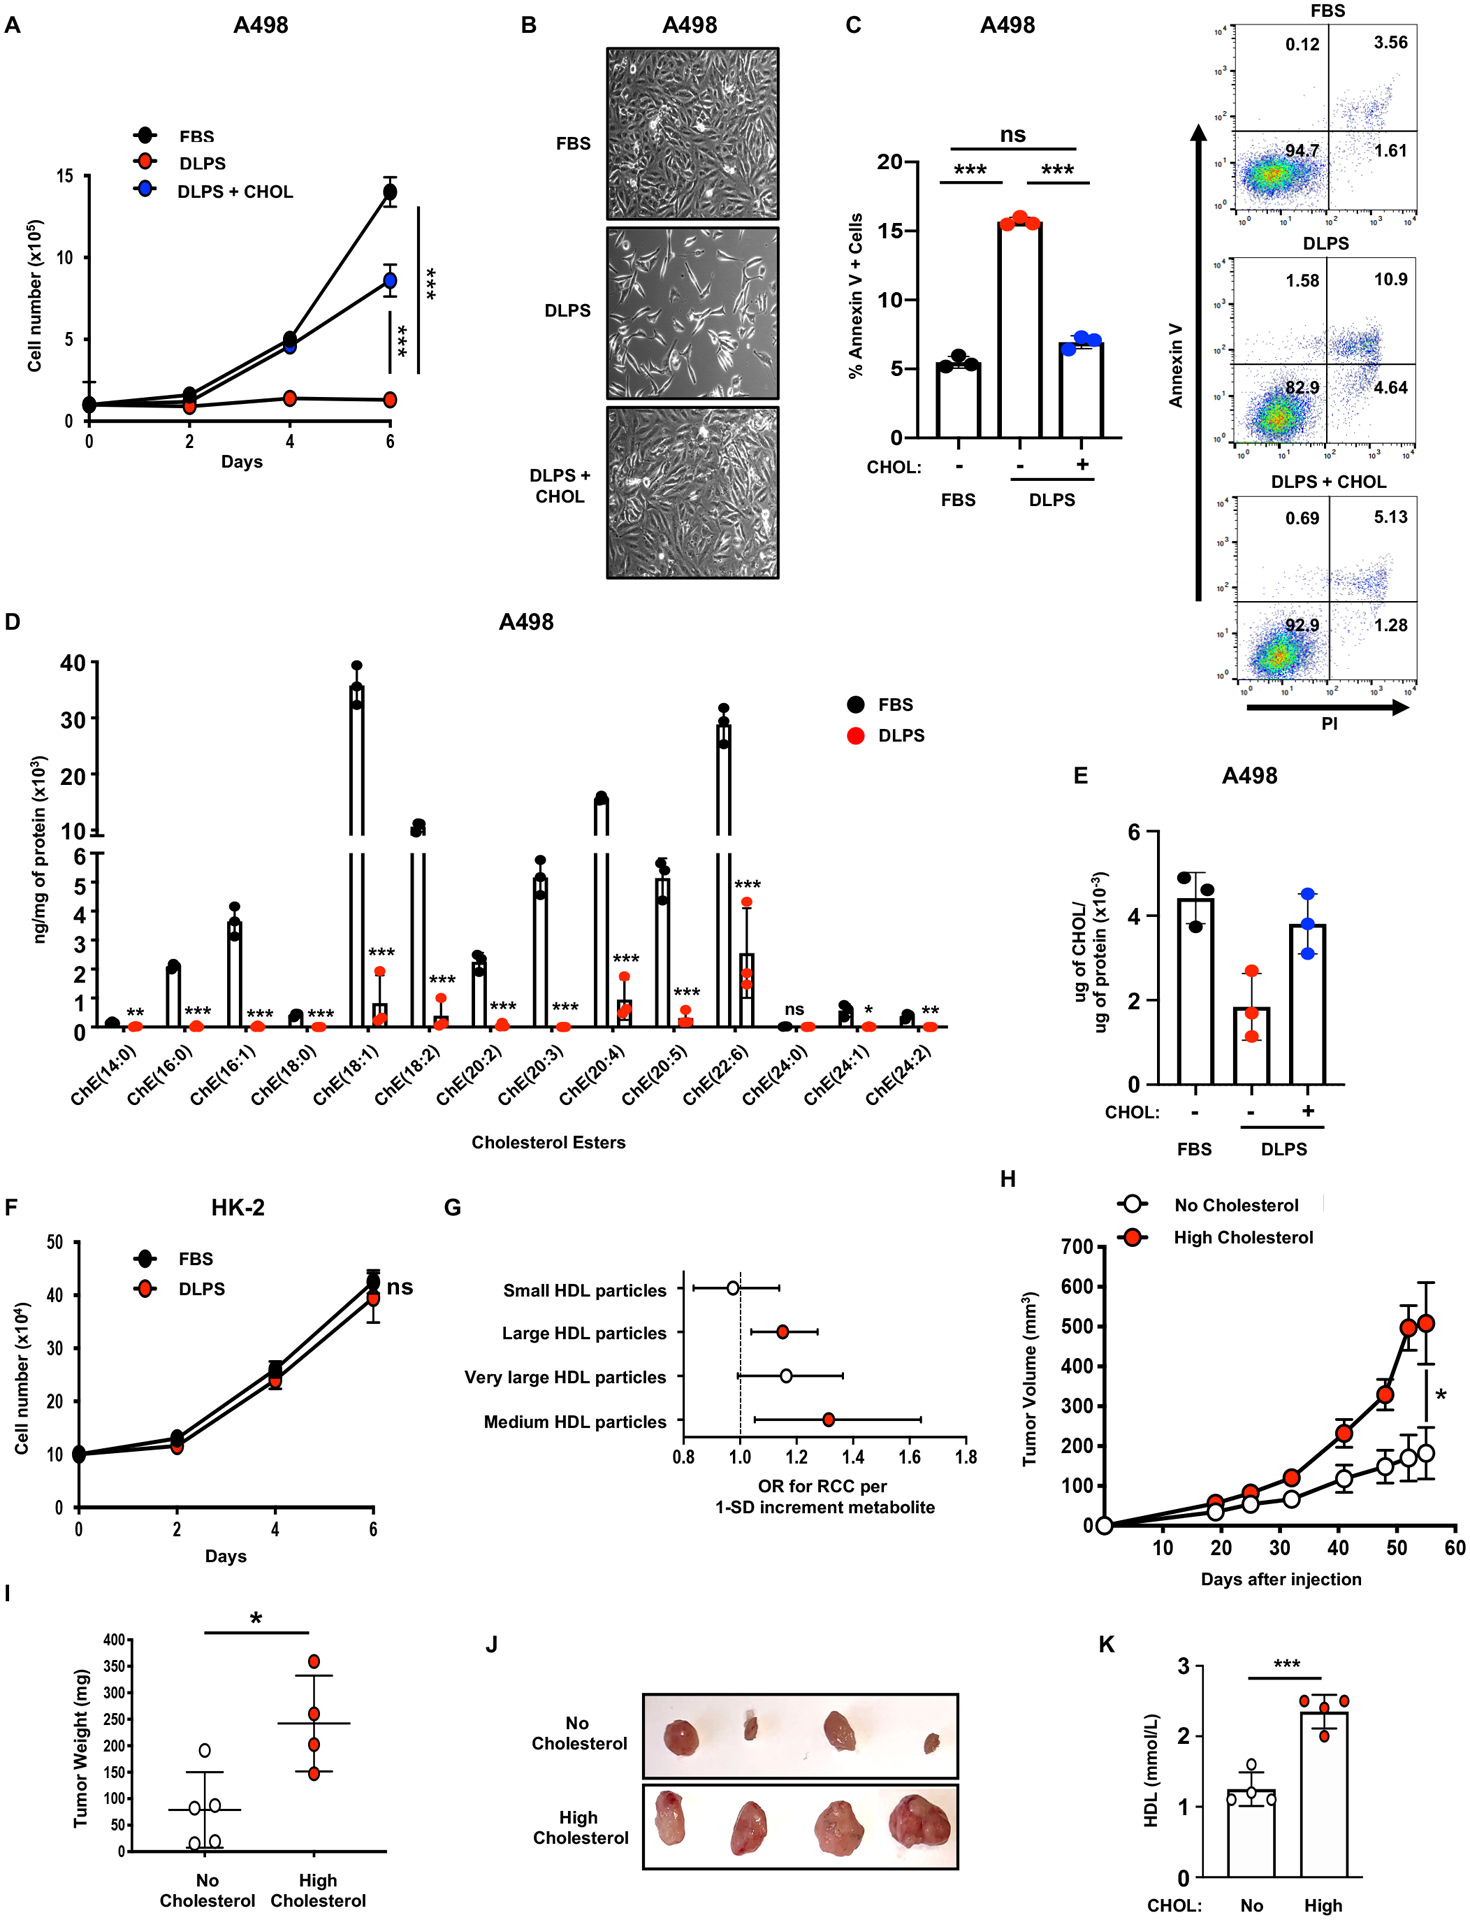
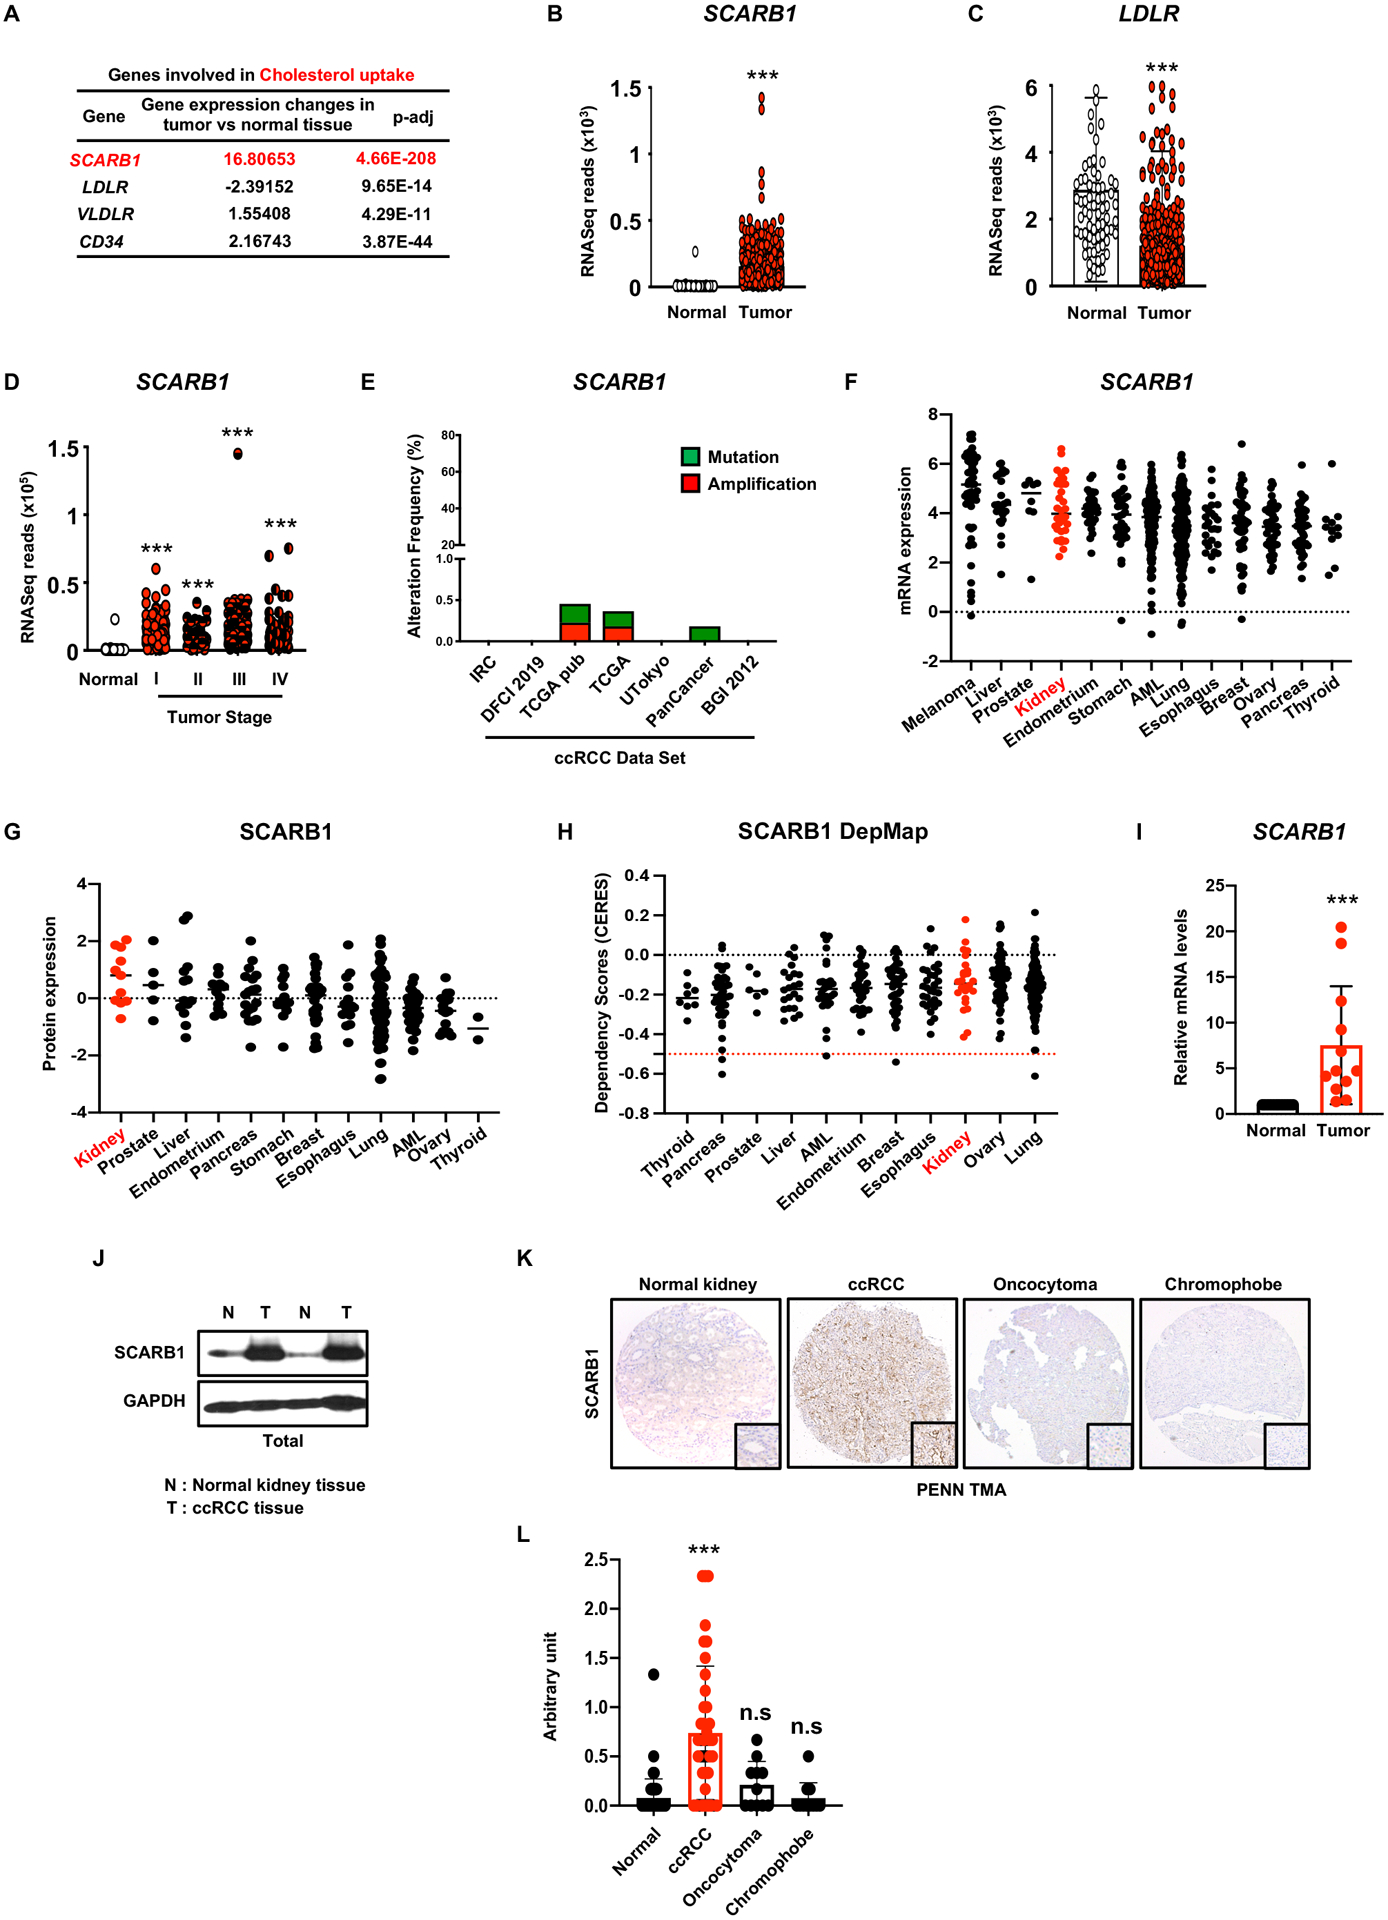
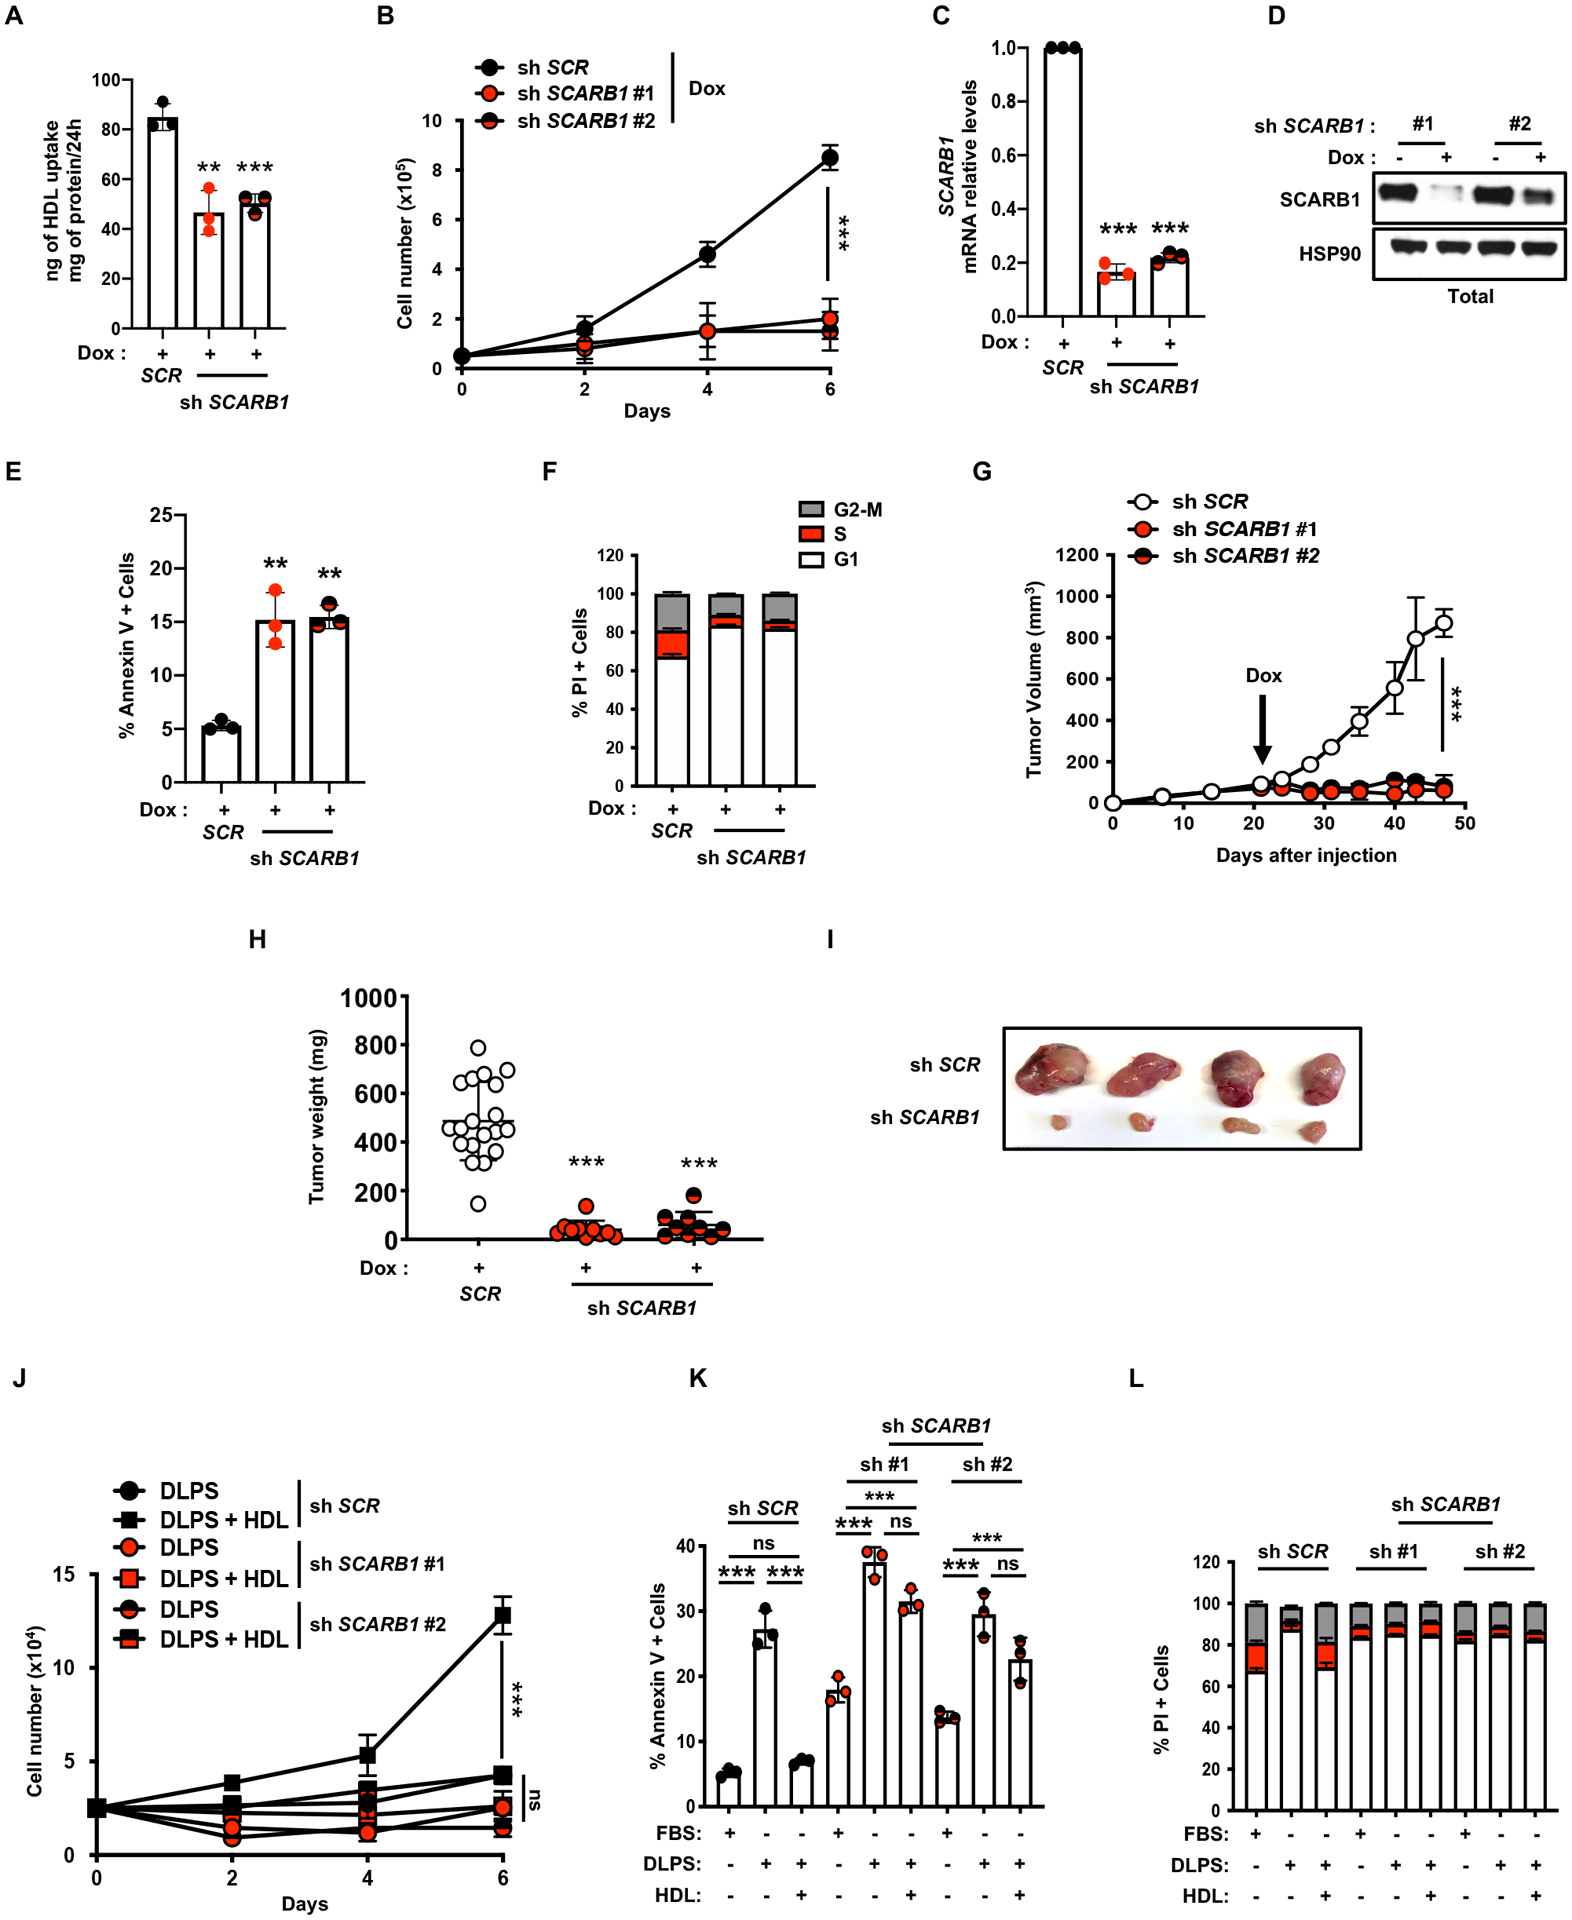
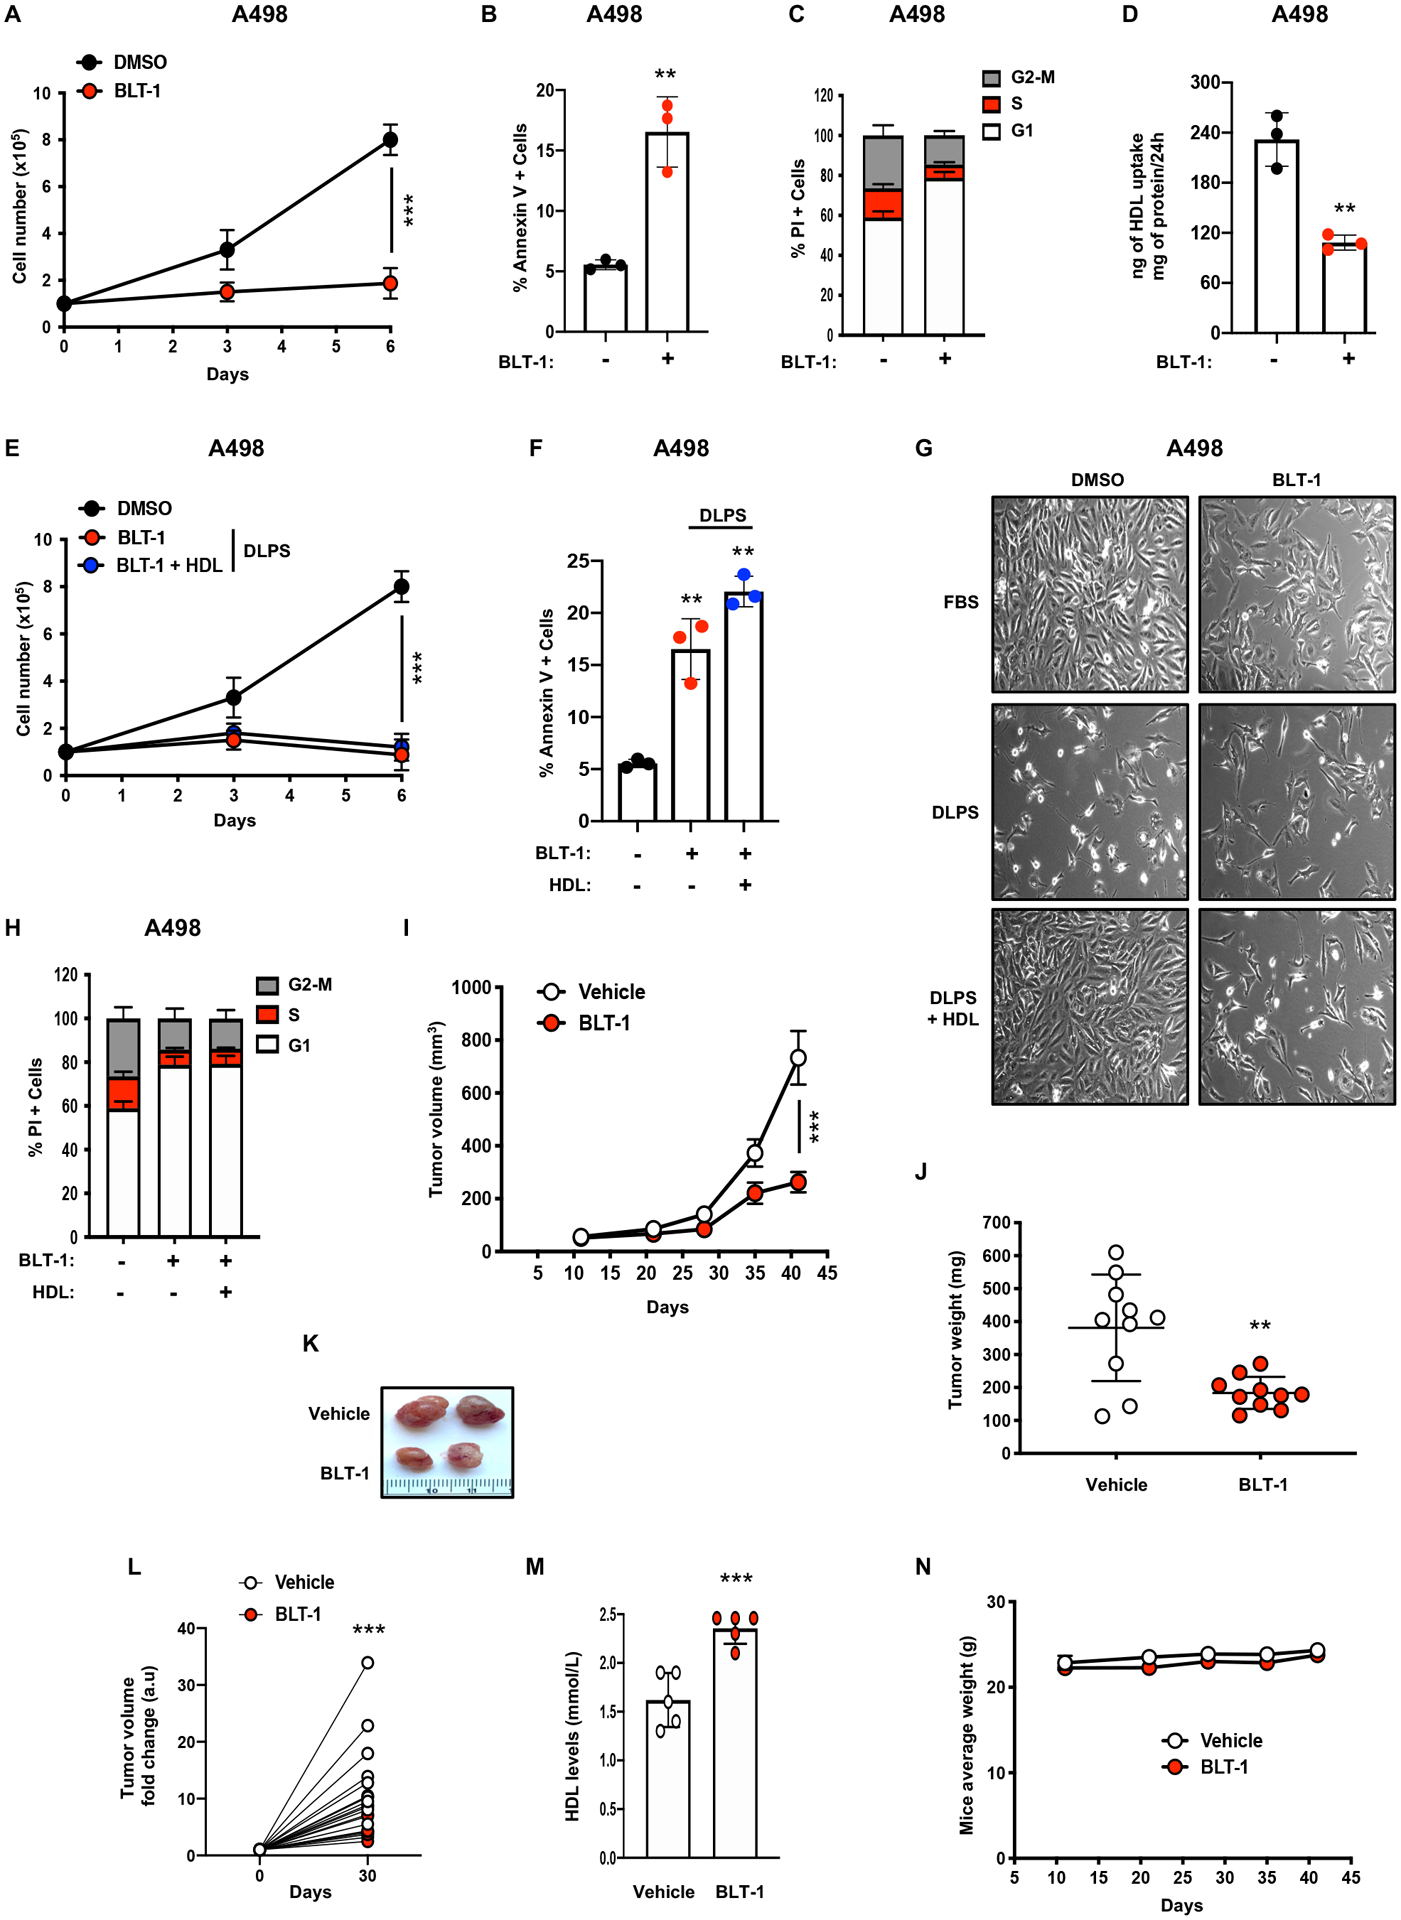
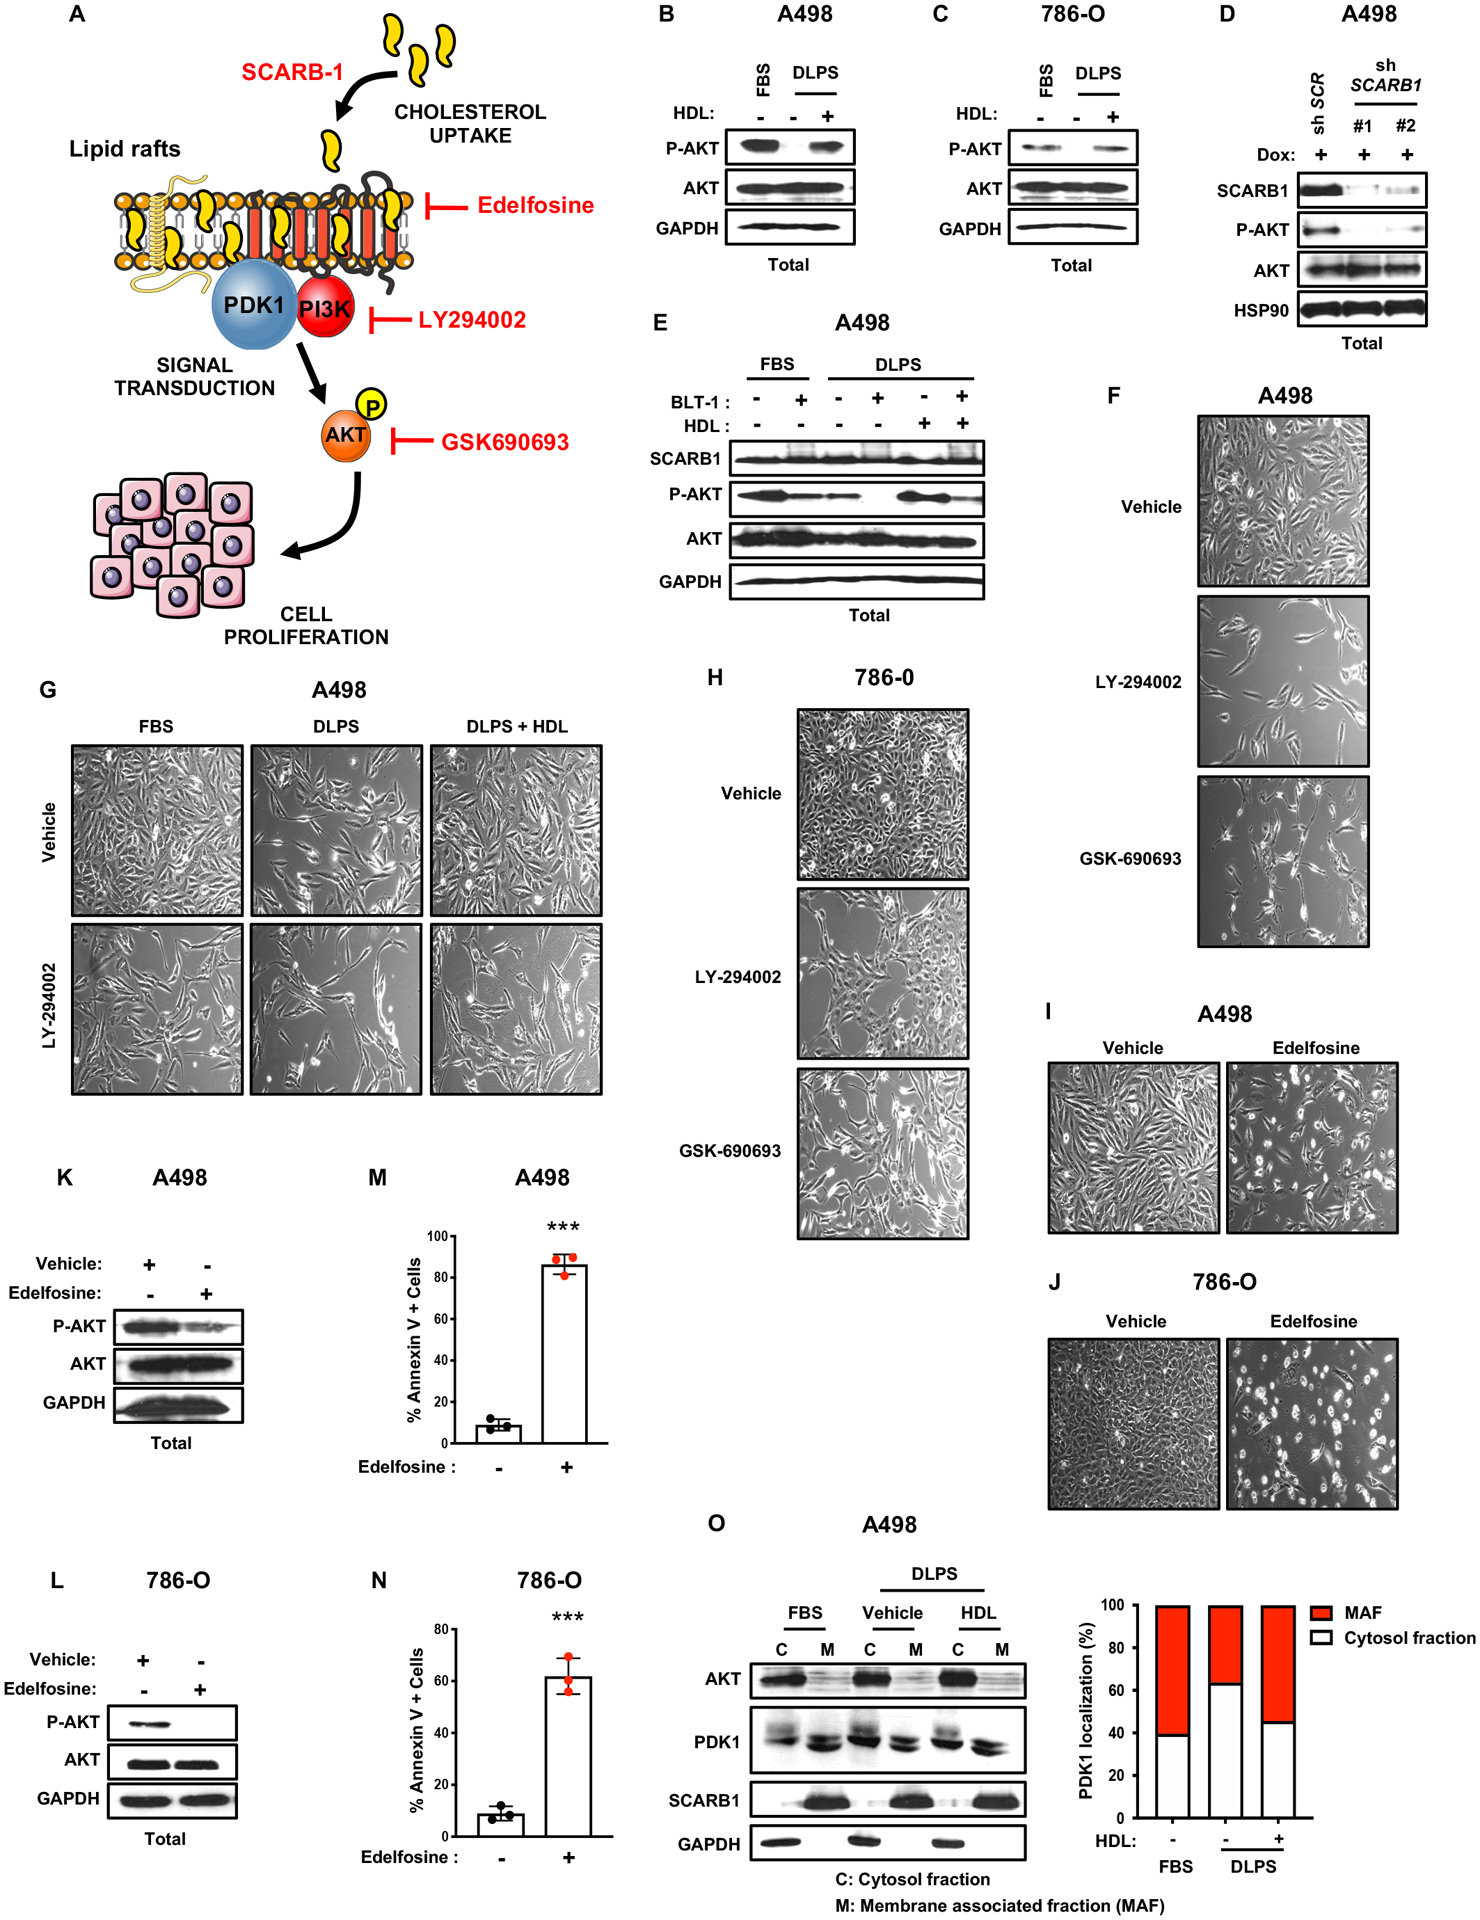
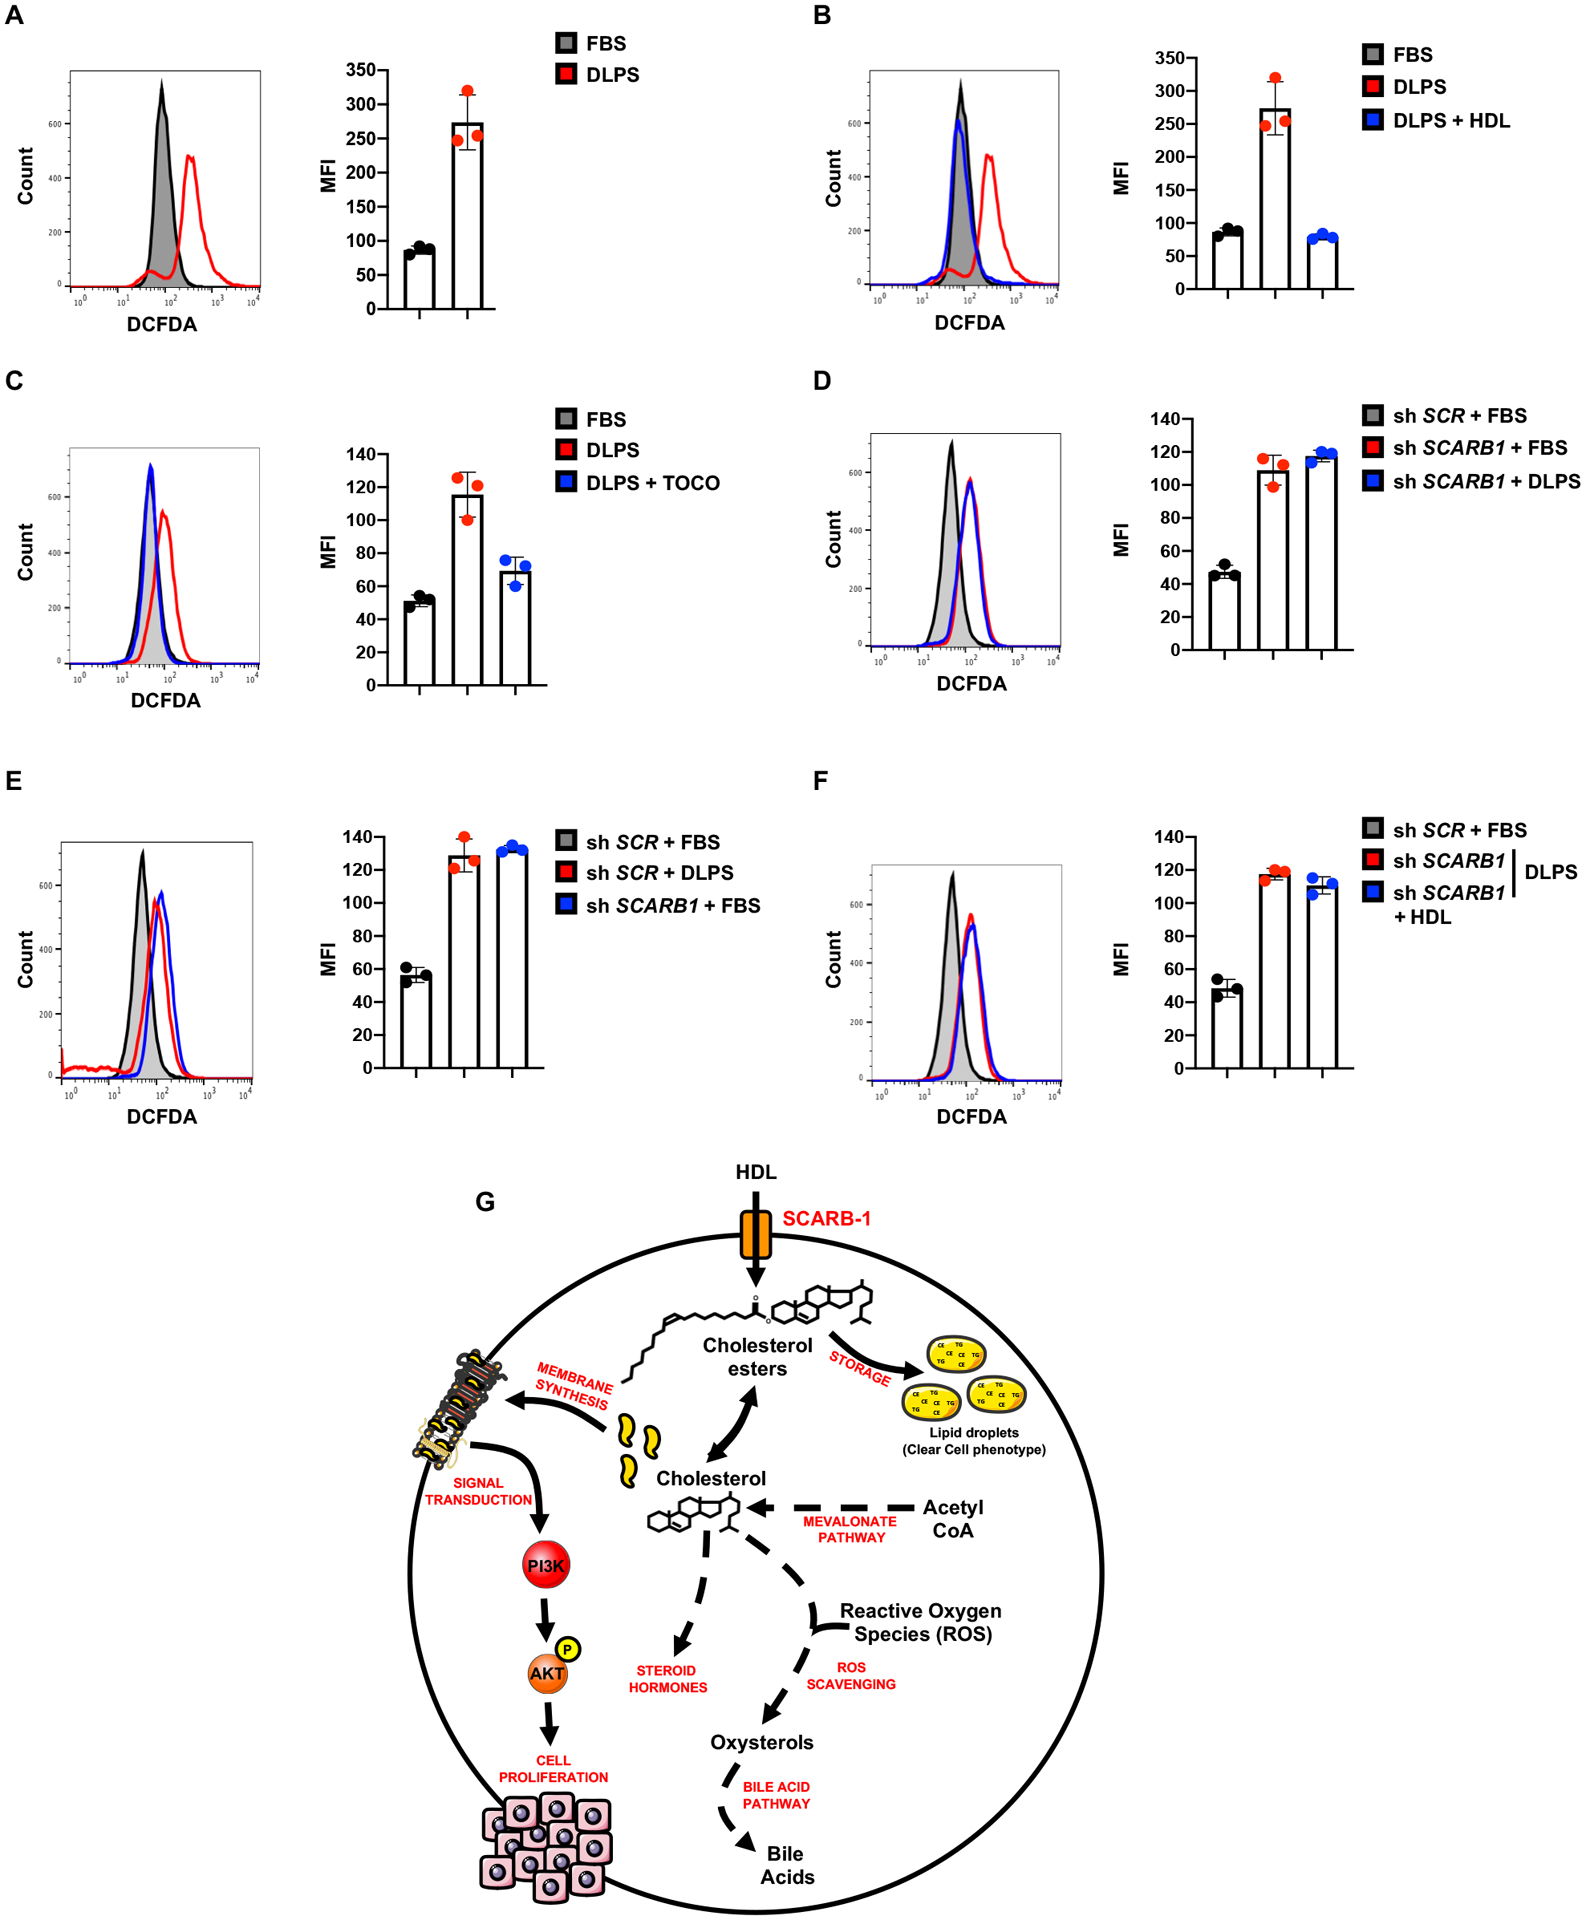
Clear cell renal cell carcinoma (ccRCC) is characterized by large intracellular lipid droplets containing free and esterified cholesterol; however, the functional significance of cholesterol accumulation in ccRCC cells is unknown. We demonstrate that, surprisingly, genes encoding cholesterol biosynthetic enzymes are repressed in ccRCC, suggesting a dependency on exogenous cholesterol. Mendelian randomization analyses based on 31,000 individuals indicate a causal link between elevated circulating high-density lipoprotein (HDL) cholesterol and ccRCC risk. Depriving ccRCC cells of either cholesterol or HDL compromises proliferation and survival in vitro and tumor growth in vivo; in contrast, elevated dietary cholesterol promotes tumor growth. Scavenger Receptor B1 (SCARB1) is uniquely required for cholesterol import, and inhibiting SCARB1 is sufficient to cause ccRCC cell-cycle arrest, apoptosis, elevated intracellular reactive oxygen species levels, and decreased PI3K/AKT signaling. Collectively, we reveal a cholesterol dependency in ccRCC and implicate SCARB1 as a novel therapeutic target for treating kidney cancer.

Significance: We demonstrate that ccRCC cells are auxotrophic for exogenous cholesterol to maintain PI3K/AKT signaling pathway and ROS homeostasis. Blocking cholesterol import through the HDL transporter SCARB1 compromises ccRCC cell survival and tumor growth, suggesting a novel pharmacologic target for this disease. This article is highlighted in the In This Issue feature, p. 2945.


Conflict of interest statement

DECLARATION OF INTERESTS

The authors declare no potential conflicts of interest with respect to the research, authorship, and/or publication of this article.

Figures

Figure 1.
Figure 1.. ccRCC cells harbor deregulated cholesterol metabolism.
A, Simplified schematic of the mevalonate pathway. Mammalian cells maintain cholesterol homeostasis through direct synthesis, which can be inhibited by statins, or import from the extracellular environment. B, Gene set enrichment analysis (GSEA) of RNAseq data provided by the TCGA KIRC project indicating that genes belonging to the “cholesterol” and “mevalonate” pathways have lower expression in ccRCC tumors compared to normal kidney tissue. Generated metabolic gene sets were ranked based on normalized enrichment score changes in ccRCC compared to normal tissue. C, Metabolic gene set analysis of RNAseq data provided by the TCGA KIRC project. 538 ccRCC tumor and 72 adjacent normal tissues were included. 2,752 genes encoding all human metabolic enzymes and transporters were classified according to KEGG. Generated metabolic gene sets were ranked based on their log2 median fold expression changes in ccRCC compared to normal tissue. D, TCGA dataset analysis shows that expression of genes involved in the “mevalonate pathway” is significantly downregulated in ccRCC tumors vs. normal tissue. HMGCR, 3-hydroxy-3-methylglutaryl-coenzyme A reductase; FDFT1, squalene synthase; DHCR24, delta 24-sterol reductase; SQLE, squalene monooxygenase; LSS, lanosterol synthase. E, Real-time qPCR analysis performed on 12 tumor tissues and their normal counterparts, indicating mevalonate pathway gene expression is decreased in tumors compared to normal tissues. F, Real-time qPCR analysis performed on immortalized proximal tubular renal epithelial cells (HK-2) and two ccRCC cell lines, A498 and 786-O, evaluating expression of HMGCR, LSS, SQLE, DHCR24 and FDFT1. G, Alteration frequency of HMGCR gene in several kidney cancer genomic datasets using cBio Cancer genomic portal. IRC, Nat Genet 2012; DFCI, Science 2019; TCGA pub, firehose legacy; TCGA, Nature 2013; Utokyo, Nat Genet 2013, TCGA PanCancer Atlas; BGI, Nat Genet 2012. H, Metabolomics analysis of squalene in 114 normal kidney tissues and 68 ccRCC tumors. I, J and K, A498, 786-O and HK-2 cell proliferation assays showing insensitivity of ccRCC cell lines to 72h of atorvastatin (ATOR) treatment (5μM). (All experiments were performed in at least triplicates and statistical analysis was applied with *=P<0.05, **=P<0.01, ***=<0.001, n.s=non-significant).
Figure 2.
Figure 2.. ccRCC cells rely on exogenous cholesterol.
A, Proliferation assay performed on A498 cells grown in media supplemented with 10% FBS, 10% DLPS, or 10% DLPS and cholesterol (CHOL) (10μg/mL). B, Representative photographs of A498 cells grown in media supplemented with 10% FBS, 10% DLPS, or 10% DLPS and cholesterol (CHOL) (10μg/mL) for 96h. Magnification (x100). C, Annexin-V/PI staining and flow cytometry analysis performed on A498 cells after 96h of incubation in 10% FBS, 10% DLPS, or 10% DLPS and cholesterol (CHOL) (10μg/mL) media (left). Representative annexin-V/PI flow plots of A498 cells after 96h of incubation in 10% FBS, 10% DLPS, or 10% DLPS and cholesterol (CHOL) (10μg/mL) media (right). D, Liquid chromatography-tandem mass spectrometry (LC/MS) analysis assessing various cholesterol ester species in A498 cells grown in 10% FBS or 10% DLPS media. E, Cholesterol content of A498 cells grown in 10% FBS or 10% DLPS. F, Proliferation assay performed on HK2 cells grown in media supplemented with 10% FBS, 10% DLPS, or 10% DLPS and cholesterol (CHOL) (10μg/mL). G, Mendelian Randomization analysis using GWAS summary statistics was performed and the effect of circulating metabolites on RCC odds estimated, revealing a significant association between HDL particles and RCC risk. Estimates reflect the OR (95% CI) for RCC per SD increase in circulating metabolite concentration. (red = significant) H, Tumor growth curves from A498 cells subcutaneously implanted in nude mice fed a no cholesterol (0%) or a high cholesterol (2%) diet. Tumor volume was assessed at the indicated timepoints using caliper measurements (n=5 mice per group, 2 tumors per mouse). I, Tumor weight from A498 cells subcutaneously implanted in nude mice, fed a no cholesterol (0%) or a high cholesterol (2%) diet, 55 days after implantation. J, Representative photographs of A498 tumors grown in mice fed a no cholesterol (0%) or a high cholesterol (2%) diet at day 55 after implantation. K, Analysis of serum HDL from nude mice subcutaneously implanted with A498 cells and fed a no cholesterol (0%) or a high cholesterol (2%) diet for 70 days. (All experiments were performed in at least triplicates and statistical analysis was applied with *=P<0.05, **=P<0.01, ***=<0.001, n.s=non-significant).
Figure 3.
Figure 3.. Scavenger receptor 1 is overexpressed in ccRCC tissues and cell lines.
A, Expression of genes involved in “cholesterol uptake” in ccRCC tumors vs. normal tissue. SCARB1, scavenger receptor B1; LDLR, Low-density lipoproteins receptor; VLDR, very low-density lipoprotein receptor; CD36, cluster of differentiation 36. B, Normalized RNASeq reads of SCARB1 in 72 normal kidneys and 538 ccRCC tumors (TCGA). C, Normalized RNASeq reads of LDLR in 72 normal kidneys and 538 ccRCC tumors (TCGA). D, Normalized RNASeq reads of SCARB1 in 72 normal kidneys and 538 ccRCC tumors grouped into stage I-IV (TCGA). E, Alteration frequency of SCARB1 gene in several kidney cancer genomic datasets using cBio Cancer genomic portal. F, Analysis of SCARB1 relative mRNA expression in various cancer cell lines using the Cancer Cell Line Encyclopedia. G, Analysis of SCARB1 protein expression in various cancer cell lines using Depmap dataset. H, Analysis of SCARB1 dependency scores across different cancer cell lines using Depmap dataset. I, Real-time qPCR analysis performed on 12 tumor tissues and their normal counterparts. SCARB1 gene expression is highly increased in tumors compared to normal tissues. J, SCARB1 protein expression in normal kidney tissue and ccRCC tumors assessed by immunoblots. GAPDH was used as the loading control. K, Representative photographs of immunohistochemistry analysis of SCARB1 expression in normal kidney tissue and various RCC tumors (ccRCC, oncocytoma and chromophobe). Magnification (100X) L, Quantification of immunohistochemistry analysis performed in J. Normal n=62, ccRCC n=40, Oncocytoma n=11, Chromophobe n=11. (All experiments were performed in at least triplicates and statistical analysis was applied with *=P<0.05, **=P<0.01, ***=<0.001, n.s=non-significant).
Figure 4.
Figure 4.. Targeting SCARB1 promotes ccRCC cell death in vitro and in vivo.
A, HDL uptake assay using shSCR and shSCARB1 A498 cells treated with doxycycline (DOX) (96h, 1μg/mL) showing reduced HDL uptake when SCARB1 is inhibited. B, Proliferation assay performed on shSCR and shSCARB1 A498 cells grown in media with 10%FBS and supplemented with doxycycline (DOX) to induce SCARB1 knockdown. C, Real-time qPCR analysis of SCARB1 mRNA level in A498 cells after shSCR or shSCARB1 lentiviral infection, puromycin selection (48h, 2μg/mL) and doxycycline (DOX) treatment for 4 days (1μg/mL). D, SCARB1 protein expression assessed by immunoblots in shSCR and shSCARB1 A498 cells treated or not with doxycycline (DOX) (4 days, 1μg/mL). HSP90 was used as the loading control. E, Annexin-V/PI staining and flow cytometry analysis performed on shSCR and shSCARB1 A498 cells after 96h of doxycycline (DOX) treatment (1μg/mL). F, Cell cycle analysis for shSCR and shSCARB1 A498 cells after 96h of doxycycline (DOX) treatment (1μg/mL) showing increased cell cycle arrest in G1 when SCARB1 is inhibited. G, Tumor growth curves from doxycycline-inducible shSCR and shSCARB1 A498 cells subcutaneously implanted in nude mice fed a diet containing doxycycline (DOX) (200mg/kg) when tumors reached a volume of ~100mm3. Tumor volume was assessed at the indicated timepoints using caliper measurements (n=10 mice per group). H, Tumor weight from shSCR and shSCARB1 A498 cells subcutaneously implanted in nude mice, fed a diet containing doxycycline (DOX) (200mg/kg), 48 days after implantation. I, Representative photographs of shSCR and shSCARB1 A498 tumors grown in nude mice fed a diet containing doxycycline (DOX) (200mg/kg), 48 days after implantation. J, Proliferation assay performed on shSCR and shSCARB1 A498 cells grown in 10% DLPS medium with or without HDL (100μg/mL), and supplemented with doxycycline (DOX) to induce SCARB1 knockdown. K, Annexin-V/PI staining and flow cytometry analysis performed on shSCR and shSCARB1 A498 cells treated with doxycycline (DOX) and grown in 10% FBS or 10% DLPS media supplemented with or without HDL (100μg/mL) for 4 days. L, Cell cycle analysis for shSCR and shSCARB1 A498 cells treated with doxycycline (DOX) (1μg/mL) and grown in 10% FBS or 10% DLPS media supplemented with or without HDL (100μg/mL). Percentage of cells in G1, S and G2-M phases is displayed. (All experiments were performed in at least triplicates and statistical analysis was applied with *=P<0.05, **=P<0.01, ***=<0.001, n.s=non-significant).
Figure 5.
Figure 5.. The SCARB1 antagonist BLT-1 impairs ccRCC cells growth in vitro and in vivo.
A, Proliferation assay performed on A498 cells grown in media with 10%FBS and treated with the SCARB1 inhibitor, BLT-1 (5μM), or vehicle control (DMSO). B, Annexin-V/PI staining and flow cytometry analysis performed on A498 cells after 96h of BLT-1 treatment (5μM). C, Cell cycle analysis for A498 cells after 96h of BLT-1 treatment (5μM) showing increased cell cycle arrest in G1 when SCARB1 is inhibited. D, HDL uptake assay using BLT-1-treated (96h, 5μM) A498 cells showing reduced HDL uptake when SCARB1 is inhibited. E, Proliferation assay performed on A498 cells grown in media with 10%FBS or 10% DLPS media supplemented with or without HDL (100μg/mL) and treated with BLT-1 (5μM) or vehicle control (DMSO). F, Annexin-V/PI staining and flow cytometry analysis performed on A498 cells after 96h of DMSO or BLT-1 treatment (5μM) and grown in 10% FBS or 10% DLPS media supplemented with or without HDL (100μg/mL). G, Representative photographs of A498 cells grown in media supplemented with 10% FBS, 10% DLPS, or 10% DLPS and HDL (100μg/mL) and treated with BLT-1 (5μM) or DMSO for 96h. Magnification (100X). H, Cell cycle analysis for A498 cells after 96h of BLT-1 (5μM) or DMSO treatment and grown in 10% FBS or 10% DLPS media supplemented with or without HDL (100μg/mL). Percentage of cells in G1, S and G2-M phases is displayed. I, Tumor growth curves from A498 cells subcutaneously implanted in nude mice treated or not with BLT-1 (50 mg/kg) by oral gavage daily for 30 days after tumor volume reached ~100mm3. Tumor volume was assessed at the indicated timepoints using caliper measurements (n=5 mice per group). J, Tumor weight from A498 cells subcutaneously implanted in nude mice treated or not with BLT-1 (50 mg/kg) by oral gavage daily for 30 days. K, Representative photographs of A498 tumors grown in nude mice treated or not with BLT-1 (50 mg/kg) by oral gavage daily for 30 days. L, Tumor volume fold change over the course of 30 day-vehicle or 30 day-BLT-1 (50 mg/kg) treatments. M, Analysis of serum HDL from nude mice subcutaneously implanted with A498 cells and treated or not with BLT-1 (50 mg/kg) by oral gavage daily for 30 days. N, Body weight average of mice treated by oral gavage daily for 30 days with either vehicle control or BLT-1 (50 mg/kg). (All experiments were performed in at least triplicates and statistical analysis was applied with *=P<0.05, **=P<0.01, ***=<0.001, n.s=non-significant)
Figure 6.
Figure 6.. Enhanced cholesterol uptake promotes cell growth through the PI3K/AKT signaling pathway.
A, Simplified schematic representing interactions between the PI3K/AKT pathway, lipid rafts and cell proliferation. Edelfosine is a synthetic alkyl-lysophospholipid accumulating in membrane lipid rafts and disrupting their compositions and functions, LY294002 is a flavonoid derivative and potent PI3K inhibitor, GSK690693 is an ATP competitive, potent pan-AKT inhibitor. B and C, AKT phosphorylation and AKT protein expression assessed by immunoblots in A498 and 786-O cells cultured for 4 days in 10% FBS or 10% DLPS media supplemented with or without HDL (100μg/mL). GAPDH was used as the loading control. D, AKT phosphorylation and AKT protein expression assessed by immunoblots in A498 control shRNA and SCARB1 knockdown cells treated with doxycycline. GAPDH was used as the loading control. E, AKT phosphorylation, AKT and SCARB1 protein expression assessed by immunoblots in A498 cells treated with the SCARB1 inhibitor, BLT-1, for 4 days in 10% FBS or 10% DLPS medium supplemented with or without HDL (100μg/mL). GAPDH was used as the loading control. F, Representative photographs of A498 cells grown in media supplemented with 10% FBS and treated with LY-294002 (10μM) or GSK690693 (10 μM) for 4 days. Magnification (x100). G, Representative photographs of A498 cells grown in 10% FBS or 10% DLPS media supplemented or not with HDL (100μg/mL) and treated with LY-294002 (10μM) for 4 days. Magnification (x100). H, Representative photographs of 786-O cells grown in media supplemented with 10% FBS and treated with LY-294002 (10μM) or GSK690693 (10 μM) for 4 days. Magnification (x100). I and J, Representative photographs of A498 and 786-O cells grown in media supplemented with 10% FBS and treated with Edelfosine (5μM) for 4 days. Magnification (x100). K and L, AKT phosphorylation and AKT protein expression assessed by immunoblots in A498 and 786-O cells cultured for 4 days in 10% FBS medium and treated with Edelfosine (5μM). GAPDH was used as the loading control. M and N, Annexin-V/PI staining and flow cytometry analysis performed on A498 and 786-O cells after 24h of Edelfosine treatment (5μM). O, AKT, PDK1, SCARB1 protein expression assessed by immunoblots in A498 cells cultured for 4 days in 10% FBS or 10% DLPS media supplemented with or without HDL (100μg/mL). Cytosolic and membrane fractionation indicating that DLPS conditions decrease PDK1 membrane localization relative to the cytosol, which is rescued by HDL addition. GAPDH was used as the loading control. (All experiments were performed in at least triplicates and statistical analysis was applied with *=P<0.05, **=P<0.01, ***=<0.001, n.s = non-significant)
Figure 7.
Figure 7.. Enhanced cholesterol uptake promotes cell growth by maintaining ROS homeostasis.
A, ROS levels assessed by flow cytometry measuring DCFDA fluorescence in A498 cells cultured in 10% FBS or 10% DLPS media for 72h. Representative plots (left) and mean fluorescence intensity quantifications are shown (right). B, ROS levels assessed by flow cytometry measuring DCFDA fluorescence in A498 cells cultured in 10% FBS or 10% DLPS media supplemented with or without HDL (100μg/mL) for 72h. Representative plots (left) and mean fluorescence intensity quantifications are shown (right). C, ROS levels assessed by flow cytometry measuring DCFDA fluorescence in A498 cells cultured in 10% FBS or 10% DLPS media supplemented with or without α-tocopherol (0.5mM) for 72h. Representative plots (left) and mean fluorescence intensity quantifications are shown (right). D and E, ROS levels assessed by flow cytometry measuring DCFDA fluorescence in shSCR and shSCARB1 A498 cells treated with doxycycline (DOX) (1μg/mL) and grown in 10% FBS or 10% DLPS media for 72h. F, ROS levels assessed by flow cytometry measuring DCFDA fluorescence in shSCR and shSCARB1 A498 cells treated with doxycycline (DOX) (1μg/mL) and grown in 10% FBS or 10% DLPS media supplemented with or without HDL (100μg/mL) for 72h. G, Schematic representing SCARB1, the HDL receptor, as a central receptor in ccRCC cells for cholesterol import compensated by diminished biosynthetic mevalonate pathway. High intracellular cholesterol levels allow ccRCC cells to maintain PI3K/AKT pathway activation, control ROS homeostasis and store cholesterol surplus in lipid droplets (CE: Cholesterol ester, TG: Triglycerides). (All experiments were performed in at least triplicates and statistical analysis was applied with *=P<0.05, **=P<0.01, ***=<0.001, n.s=non-significant).

Comment in

References

    1. Rini BI, Campbell SC, Escudier B. Renal cell carcinoma. Lancet [Internet] 2009. [cited 2019 Oct 16];373:1119–32. Available from: http://www.ncbi.nlm.nih.gov/pubmed/19269025 - PubMed
    1. Keith B, Johnson RS, Simon MC. HIF1α and HIF2α: sibling rivalry in hypoxic tumour growth and progression. Nat Rev Cancer [Internet] 2011. [cited 2019 Nov 7];12:9–22. Available from: http://www.nature.com/articles/nrc3183 - PMC - PubMed
    1. Linehan WM, Srinivasan R, Schmidt LS. The genetic basis of kidney cancer: A metabolic disease [Internet]. Nat. Rev. Urol 2010. [cited 2020 Apr 3]. page 277–85. Available from: http://www.ncbi.nlm.nih.gov/pubmed/20448661 - PMC - PubMed
    1. Ward PS, Thompson CB. Metabolic Reprogramming: A Cancer Hallmark Even Warburg Did Not Anticipate. Cancer Cell 2012. page 297–308. - PMC - PubMed
    1. DeBerardinis RJ, Chandel NS. Fundamentals of cancer metabolism. Sci Adv [Internet]. Sci Adv; 2016. [cited 2020 Dec 1];2:e1600200. Available from: http://www.ncbi.nlm.nih.gov/pubmed/27386546 - PMC - PubMed

Publication types

MeSH terms