. 2021 Jul 9;12(1):4229.
doi: 10.1038/s41467-021-24383-3.

The force loading rate drives cell mechanosensing through both reinforcement and cytoskeletal softening

Affiliations

The force loading rate drives cell mechanosensing through both reinforcement and cytoskeletal softening

Ion Andreu et al. Nat Commun. .

Abstract

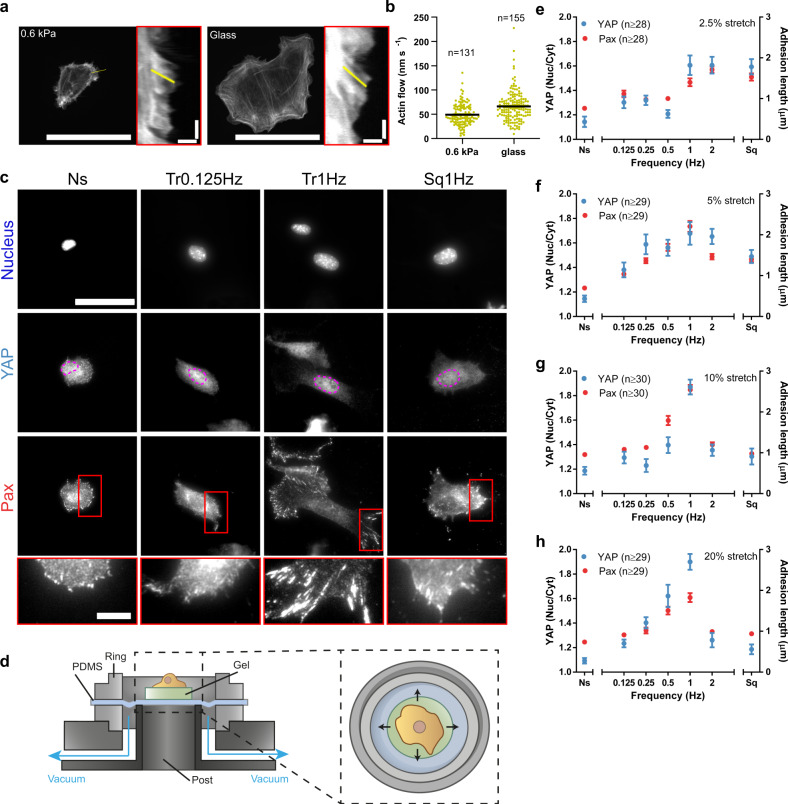
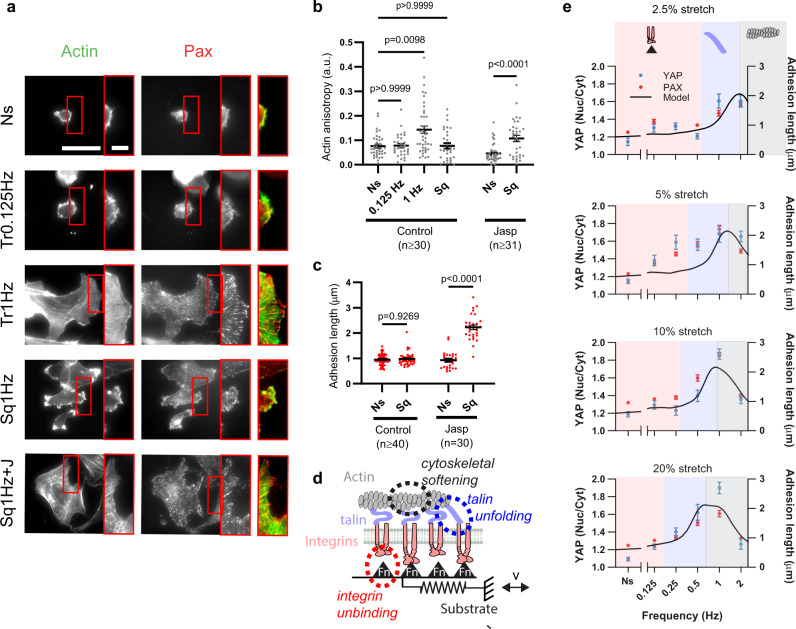
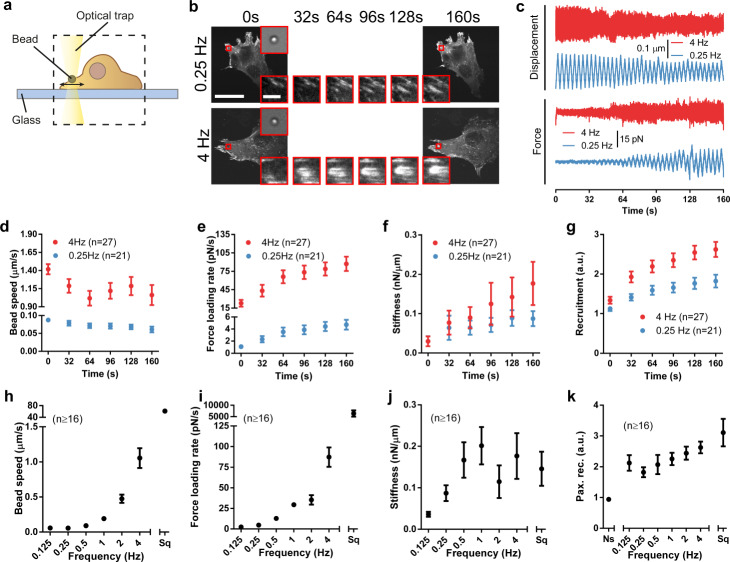
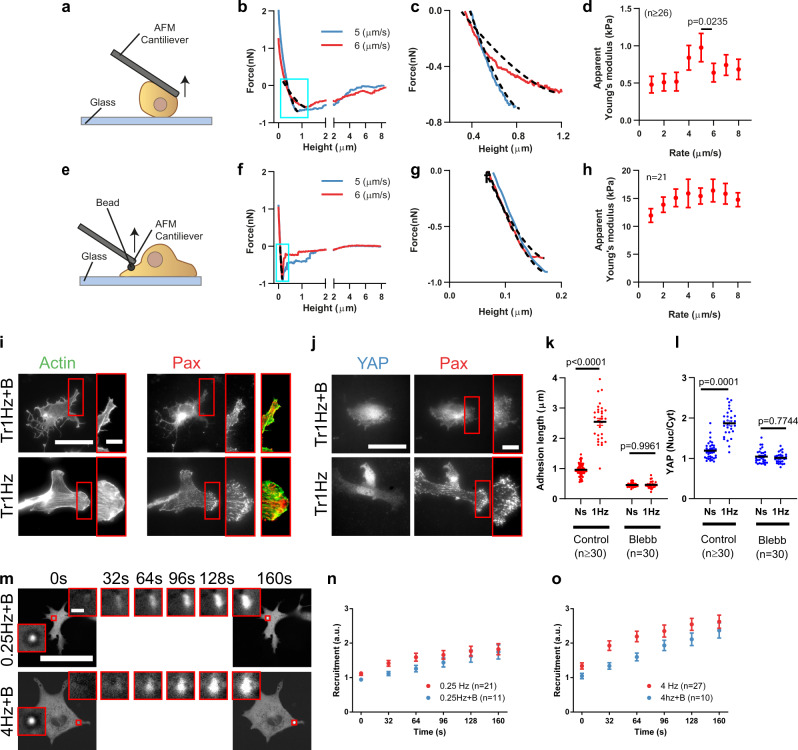
Cell response to force regulates essential processes in health and disease. However, the fundamental mechanical variables that cells sense and respond to remain unclear. Here we show that the rate of force application (loading rate) drives mechanosensing, as predicted by a molecular clutch model. By applying dynamic force regimes to cells through substrate stretching, optical tweezers, and atomic force microscopy, we find that increasing loading rates trigger talin-dependent mechanosensing, leading to adhesion growth and reinforcement, and YAP nuclear localization. However, above a given threshold the actin cytoskeleton softens, decreasing loading rates and preventing reinforcement. By stretching rat lungs in vivo, we show that a similar phenomenon may occur. Our results show that cell sensing of external forces and of passive mechanical parameters (like tissue stiffness) can be understood through the same mechanisms, driven by the properties under force of the mechanosensing molecules involved.


Conflict of interest statement

The authors declare no competing interests.

Figures

Fig. 1
Fig. 1. The rate of cell stretch drives mechanosensing in a biphasic manner.
a Cells transfected with LifeAct-GFP and plated on polyacrylamide gels of 0.6 kPa or on glass. Insets are kymographs showing the movement of actin features along the lines marked in yellow. b Actin retrograde flow of cells cultured on 0.6 kPa gels or glass. n numbers are traces. c Nuclear, YAP, and paxillin stainings of cells stretched by 10% using the setup using triangular (Tr) and square (Sq) signals at different frequencies. Ns non-stretched cells. In YAP images, magenta outlines indicate the nucleus. In paxillin images, areas circled in red are shown magnified below. d Illustration of the stretch setup. eh Quantifications of YAP nuclear to cytoplasmic ratios and paxillin focal adhesion lengths for cells stretched at 2.5 % (e), 5% (f) 10% (g), and 20% (h). Results are shown for non-stretched cells (Ns), cells stretched with triangular signals at different frequencies, and cells stretched with a square signal at 1 Hz (Sq). The effects of frequency were significant for both YAP and paxillin in all panels (p < 0.0001). The effect of square versus triangular 1 Hz signals was significant for paxillin at 5% stretch (p = 0.0025) and for both YAP and paxillin for 10 and 20% stretch (p < 0.0001). Statistical significance was assessed with Kruskal–Wallis tests. n numbers are cells. Scale bars are 50 μm in cells, 2 μm/40 s in kymographs (x/y axes), and 10 µm in magnifications. Data are shown as mean ± s.e.m.
Fig. 2
Fig. 2. A molecular clutch model considering mechanosensing and cytoskeletal softening predicts the response to stretch.
a Actin and paxillin stainings for cells either not stretched or stretched by 10% with triangular signals (0.125 Hz, 1 Hz) or square signals (Sq, 1 Hz, with or without Jasplakinolide treatment). Areas circled in red are shown magnified at the right of each image, and shown as a merged image (actin, green, paxillin, red). Scale bar is 50 µm, and 10 µm in magnifications. b, c corresponding quantifications of actin anisotropy (b) and adhesion length (c) for control cells, and cells treated with Jasplakinolide. n numbers are cells. Statistical significance was assessed with two-way ANOVA. d Cartoon of computational clutch model (see “Methods” section). The model considers a relative speed of movement v between cell and substrate (given by stretch). The substrate is represented by an elastic spring with binding sites to integrins (via fibronectin, Fn triangles), which in turn connect to talin and actin. As stretch applies forces, these can lead to integrin unbinding, talin unfolding, or cytoskeletal softening. e Model predictions (black line) overlaid on experimental YAP and paxillin results from Fig. 1. The only parameter changing between simulations is stretch amplitude (1.5, 2, 2.5, and 3 µm for 2.5, 5, 10, and 20% stretch). Areas shaded in pink, blue, and gray show the regions dominated respectively by integrin unbinding, talin unfolding, and cytoskeletal softening. Data are shown as mean ± s.e.m.
Fig. 3
Fig. 3. The loading rate of force application to single adhesions drives their maturation.
a Illustration of the optical tweezer setup. b Images of cells transfected with GFP-paxillin during force application with triangular signals at 0.25 and 4 Hz, shown as a function of time. The area circled in red indicates the position of the stimulated bead, which is shown magnified at the top-right corner (brightfield image) and bottom-right corner (GFP-paxillin image). Magnified GFP-paxillin images are shown at different timepoints. c Example traces of displacement and forces for beads stimulated at 4 and 0.25 Hz. dg Bead speed (d), force loading rate (e), stiffness (f), and recruitment of GFP-paxillin at beads (g) as a function of time for beads stimulated at 4 Hz and 0.25 Hz. hk Bead speed (h), force loading rate (i), stiffness (j), and recruitment of GFP-paxillin at beads (k) for beads at the end of the experiment (160 s) for all conditions. The effects of frequency on both stiffness and paxillin recruitment were significant (p = 0.002 and 0.008, respectively). Ns non-stimulated beads, Sq stimulation with a 1 Hz square signal. n numbers are beads in all panels. Statistical significance was assessed with Kruskal–Wallis test. Scale bar is 50 µm, and 5 µm in magnifications. Data are shown as mean ± s.e.m.
Fig. 4
Fig. 4. High deformation rates lead to cytoskeletal softening.
a Illustration of the single-cell AFM setup. b Example cantilever retraction curves of the single-cell AFM experiments. Dashed lines within blue squares show the fits of the force/deformation curves used to calculate apparent cell stiffness (Young’s modulus). Curves were fitted between the beginning of cell stretch (below zero force) and the point at which cells start detaching (minimum force in the curve). c Magnification of the curve section fitted in b. d Stiffness as a function of the retraction speed for cells attaching to a fibronectin-coated substrate. The effect of retraction speed (p < 0.0001), and the specific decrease from 5 to 6 µm/s (p = 0.0235) were significant. n numbers are curves. Statistical significance was assessed with Friedman test. e Illustration of the bead AFM setup. f Example cantilever retraction curves of bead AFM experiments. g Magnification of the curve section fitted in f. h Stiffness as a function of the retraction speed for fibronectin-coated beads attaching to cells. The effect of retraction speed was not significant (Friedman test). n numbers are curves. i, j Actin and paxillin (i) and YAP and paxillin (j) stainings for cells stretched by 10% with a triangular 1 Hz signal, with or without blebbistatin treatment. Scale bar is 50 µm (10 µm in magnifications). k, l Corresponding quantifications of adhesion length (k) and YAP nuclear to cytosolic ratios (l). n numbers are cells. Statistical significance was assessed with two-way ANOVA. m Images of blebbistatin-treated cells transfected with GFP-paxillin during force application with triangular signals at 0.25 and 4 Hz, shown as a function of time. Areas circled in red are shown magnified at different timepoints. Scale bar is 50 µm (2 µm in magnifications). n, o Corresponding quantifications of recruitment of GFP-paxillin at beads at 0.25 Hz (n) and 4 Hz (o). No significant effect of blebbistatin was observed (two-way ANOVA). n numbers are beads. Data are shown as mean ± s.e.m.
Fig. 5
Fig. 5. Increasing rates of lung ventilation in vivo induce YAP nuclear localization.
a Diagram of the rat lung ventilation setup, where each lung was independently cannulated and ventilated. Ventilation was either uniform at 1.1 Hz in both lungs (Ctrl) or differential with the left and right lungs ventilated at 0.1 and 2.1 Hz, respectively (Dif). Both conditions had the same ventilation volume. b YAP staining of rat lungs ventilated at 0.1, 1.1, and 2.1 Hz. Areas circled in red are magnified below each image. In magnified images, nuclear contours (as determined from Hoechst stainings) are shown in red. Scale bar is 50 µm in top images, and 5 µm in magnifications. c Quantification of YAP nuclear to cytoplasmic ratios for rat lungs ventilated with same tidal volume at 0.1, 1.1, and 2.1 Hz. Statistical significance was assessed with one-way ANOVA. d Quantification of YAP nuclear to cytoplasmic ratios for left and right rat lungs ventilated at 1.1 Hz. n numbers are rat lungs. No significant differences were observed (two-sided t-test). Data are shown as mean ± s.e.m.

References

    1. Humphrey JD, Schwartz MA, Tellides G, Milewicz DM. Role of mechanotransduction in vascular biology. Circ. Res. 2015;116:1448–1461. doi: 10.1161/CIRCRESAHA.114.304936. - DOI - PMC - PubMed
    1. Waters, C. M., Roan, E. & Navajas, D. Mechanobiology in lung epithelial cells: measurements, perturbations, and responses. Compr. Physiol.2, 1–29 (2012). - PMC - PubMed
    1. DuFort CC, Paszek MJ, Weaver VM. Balancing forces: architectural control of mechanotransduction. Nat. Rev. Mol. Cell Biol. 2011;12:308–319. doi: 10.1038/nrm3112. - DOI - PMC - PubMed
    1. Schedin P, Keely PJ. Mammary gland ECM remodeling, stiffness, and mechanosignaling in normal development and tumor progression. Cold Spring Harb. Perspect. Biol. 2011;3:a003228. doi: 10.1101/cshperspect.a003228. - DOI - PMC - PubMed
    1. Saez A, Buguin A, Silberzan P, Ladoux B. Is the mechanical activity of epithelial cells controlled by deformations or forces? Biophys. J. 2005;89:L52–L54. doi: 10.1529/biophysj.105.071217. - DOI - PMC - PubMed

Publication types

MeSH terms