Observational Study
. 2021 Jul 9;12(1):4220.
doi: 10.1038/s41467-021-24469-y.

Prokineticin-2 prevents neuronal cell deaths in a model of traumatic brain injury

Affiliations
Observational Study

Prokineticin-2 prevents neuronal cell deaths in a model of traumatic brain injury

Zhongyuan Bao et al. Nat Commun. .

Abstract

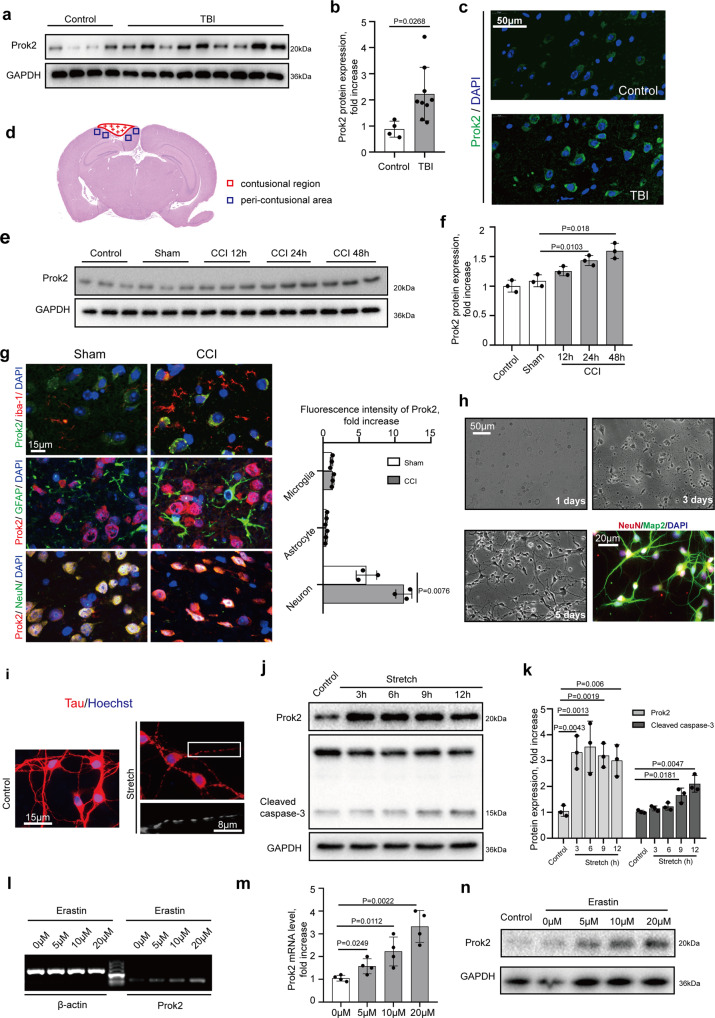
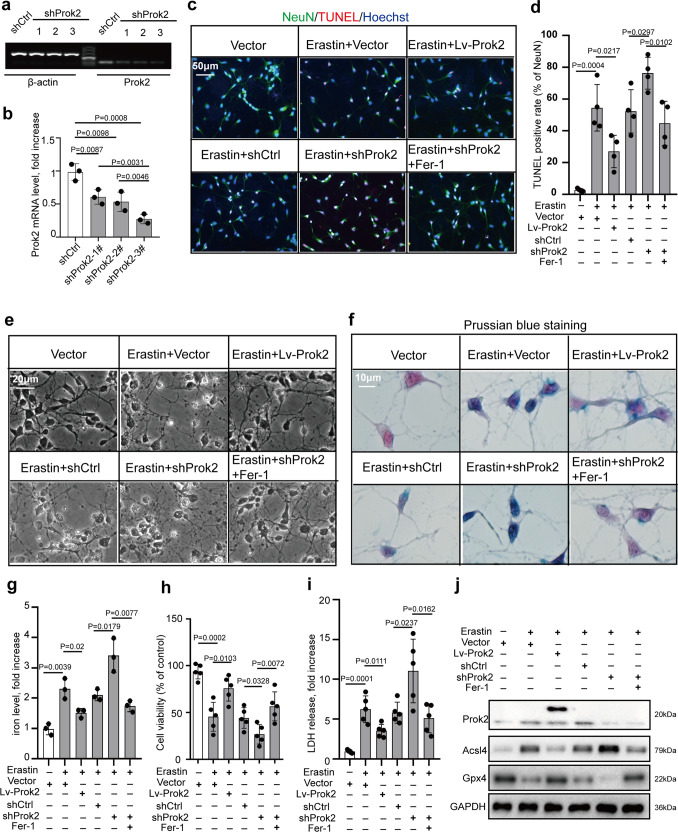
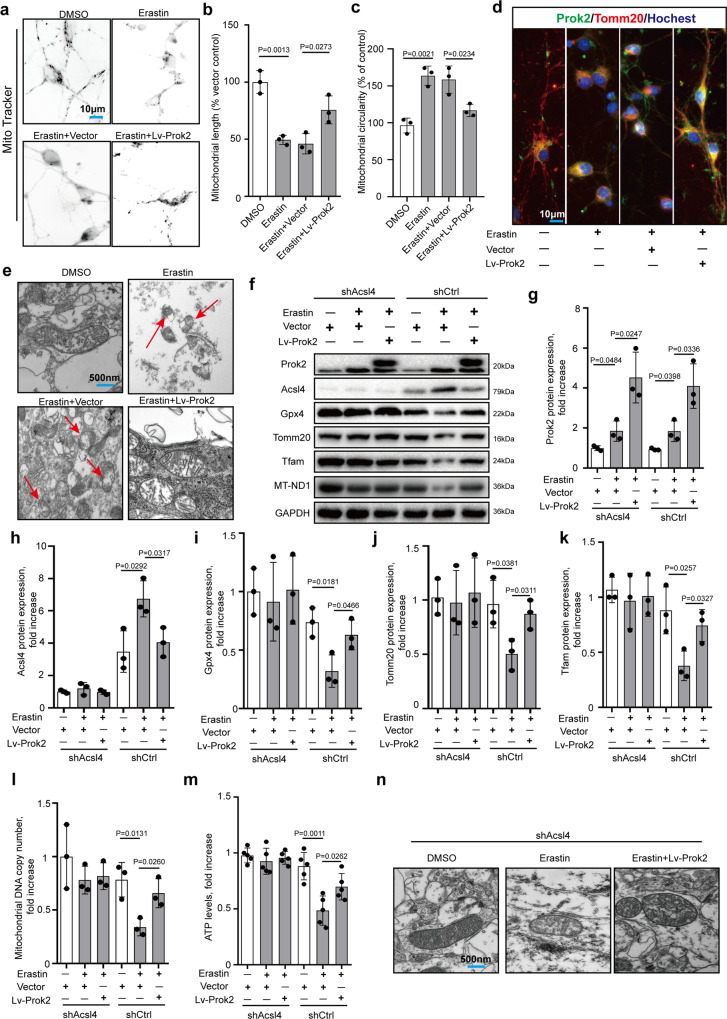
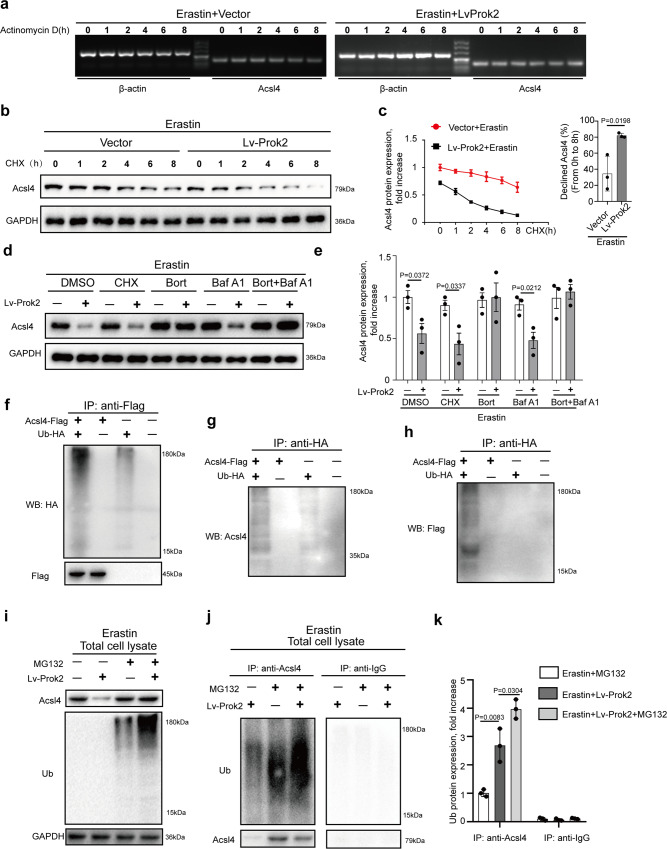
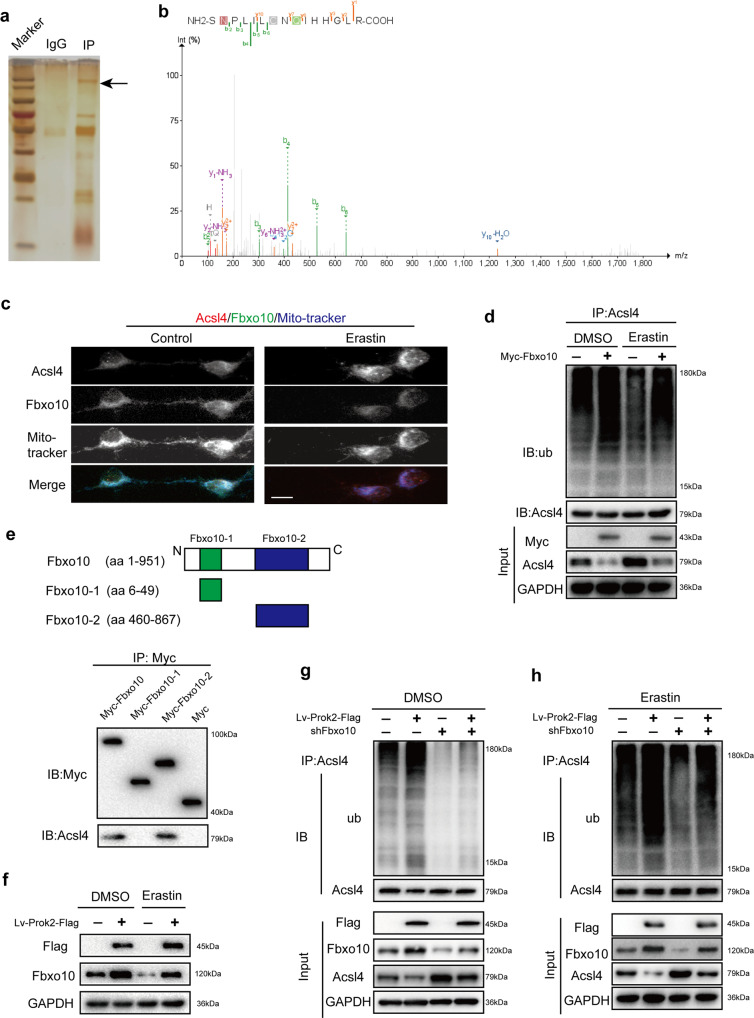
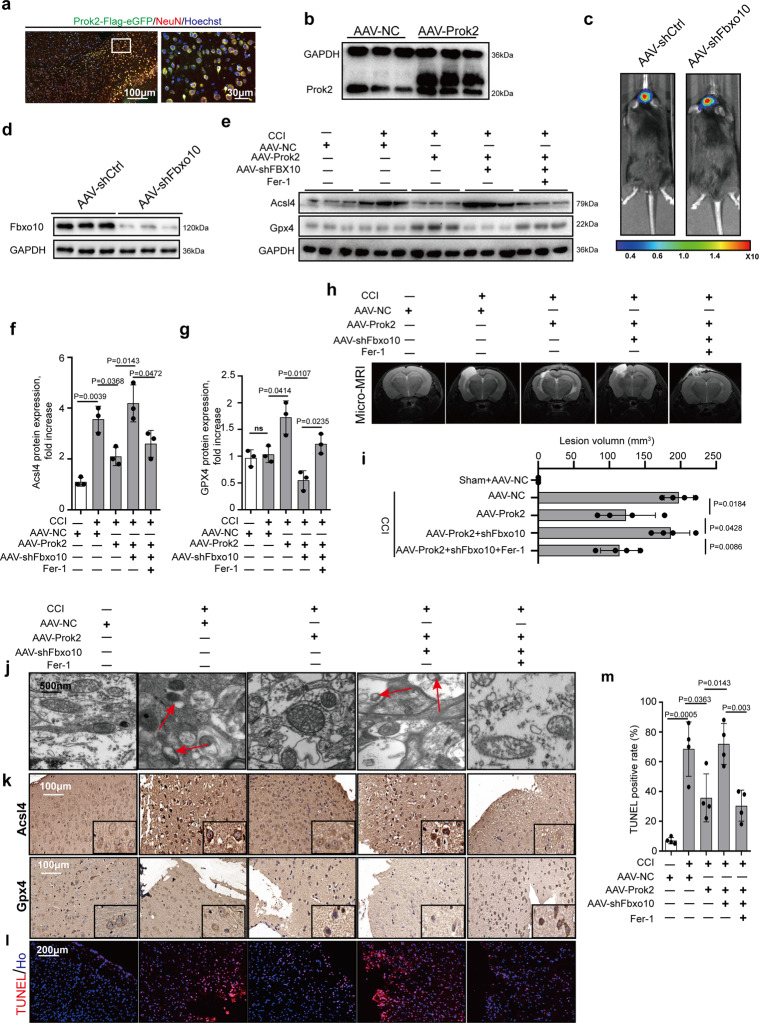
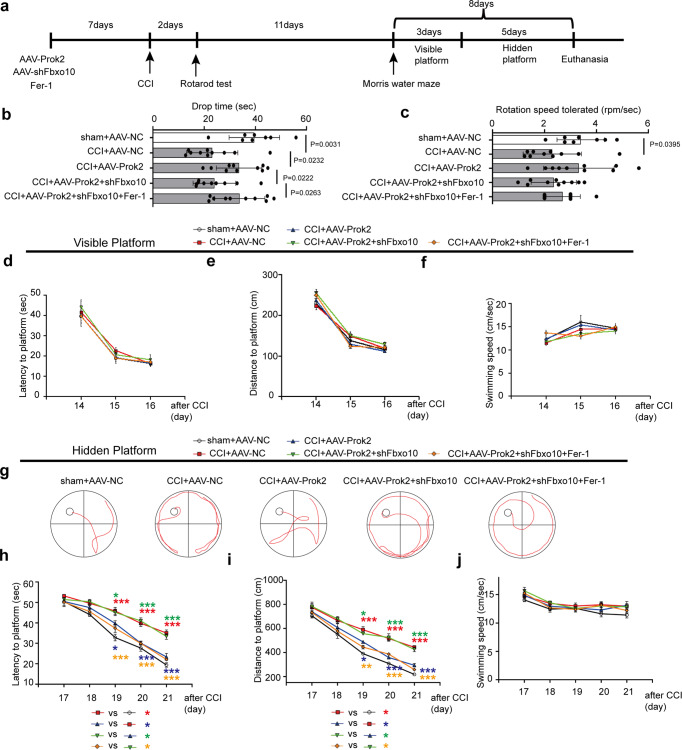
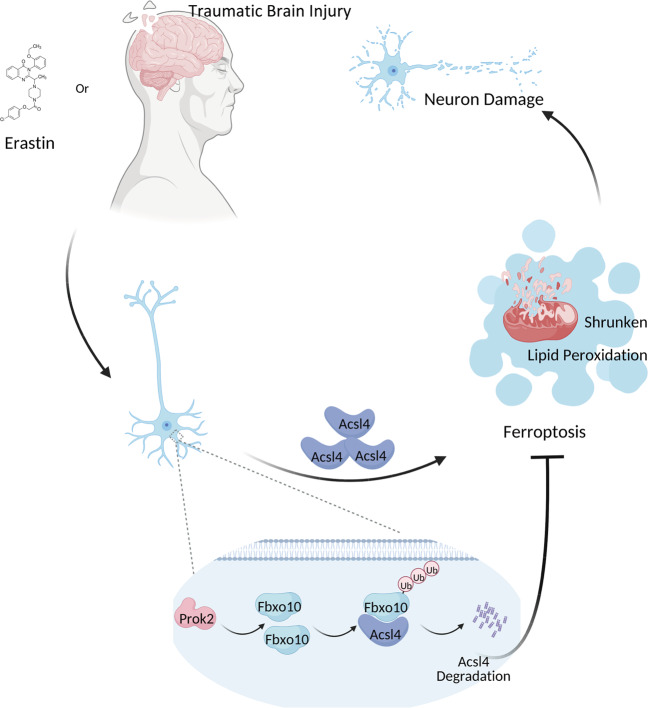
Prokineticin-2 (Prok2) is an important secreted protein likely involved in the pathogenesis of several acute and chronic neurological diseases through currently unidentified regulatory mechanisms. The initial mechanical injury of neurons by traumatic brain injury triggers multiple secondary responses including various cell death programs. One of these is ferroptosis, which is associated with dysregulation of iron and thiols and culminates in fatal lipid peroxidation. Here, we explore the regulatory role of Prok2 in neuronal ferroptosis in vitro and in vivo. We show that Prok2 prevents neuronal cell death by suppressing the biosynthesis of lipid peroxidation substrates, arachidonic acid-phospholipids, via accelerated F-box only protein 10 (Fbxo10)-driven ubiquitination, degradation of long-chain-fatty-acid-CoA ligase 4 (Acsl4), and inhibition of lipid peroxidation. Mice injected with adeno-associated virus-Prok2 before controlled cortical impact injury show reduced neuronal degeneration and improved motor and cognitive functions, which could be inhibited by Fbxo10 knockdown. Our study shows that Prok2 mediates neuronal cell deaths in traumatic brain injury via ferroptosis.


Conflict of interest statement

The authors declare no competing interests.

Figures

Fig. 1
Fig. 1. Prok2 expression is increased after exposure to TBI, stretch, and Erastin.
a, b Western blot analysis and densitometric quantification of Prok2 expression by ImageJ in brain tissue of control (n = 4 samples) and TBI (n = 9 samples) patients. Data presented as mean ± SD. c Immunofluorescence assessment of Prok2 expression (green) in brain tissue from control and TBI patients. Scale bar is 50 μm. DAPI is used to label nucleus. d Schematic representation of the contusional region (red) and the peri-contusional area (blue) after CCI. Tissues from the peri-contusional area (blue) are collected for western blot and qRT-PCR analysis. e, f Western blot analysis and densitometric quantification of Prok2 expression by ImageJ in control, sham and CCI mouse brain tissue. GAPDH is used as a control. Data presented as mean±SD (n = 3 mice). g Dual immunofluorescence staining shows that Prok2 expression is most prominent in neurons (NeuN-labeled), whereas low levels of Prok2-staining are found in astrocytes (GFAP-labeled) and microglia (iba-1-labeled). Scale bar is 15 μm. Quantification of Prok2 fluorescence intensity by ImageJ is shown in the right panel. Data presented as mean±SD (n = 3). h Representative photomicrographs of NeuN (red) and Map2 (green) expressing primary cortical neurons utilized in the studies. Scale bar is 50 μm for light microscopy image and 20 μm for fluorescence image. i Stretch-induced neuronal injury manifests as the appearance of thin and disrupted neurites and loss of the cytoplasm. Immunofluorescence labeling of tau protein (red) is used to monitor the effects of mechanical stretch on neurites; Hoechst is used to stain cell nuclei. Scale bar is 15 and 8 μm, respectively. j, k Western blot analysis and quantification of Prok2 and cleaved caspase-3 expression by ImageJ in control and stretch groups. GAPDH is used as loading control. Data presented as mean ± SD (n = 3 experiments). l, m Detection and quantification of Prok2 mRNA in primary cortical neurons exposed to Erastin for 24 h at different concentrations. β-actin is used as control. Data presented as mean ± SD (n = 3 experiments). n Erastin exposure increases Prok2 protein expression. GAPDH is used as control in western blot assays. For all panels, n indicates biologically independent repeats. P value was determined by a two-tailed unpaired Student’s t test for comparations between two groups. Source data are provided as a Source Data file.
Fig. 2
Fig. 2. Overexpression of Prok2 attenuates Erastin-induced cytotoxicity.
Primary cortical neurons are treated with 20 µM Erastin for 24 h, lentivirus containing Prok2 (Lv-Prok2) or control (vector), control RNAi (shCtrl) or RNAi against Prok2 (shProk2), and ferrostatin-1 (Fer-1). a shProk2 decreases Prok2 mRNA levels vs. shCtrl. One of the three Prok2-interfereing shRNAs, the sh-Prok2-3#, is found to decrease Prok2 mRNA expression most efficiently. b Quantification of Prok2 mRNA levels by ImageJ. Data presented as mean ± SD (n = 3 experiments). c, d Cell death measured by TUNEL staining of primary neurons. Scale bar is 50 μm. Data presented as mean±SD (n = 4 experiments). e Representative photomicrographs of primary cortical neurons in different groups. Characteristic of neuronal injury are disruption and thinning of neurites with large vacuoles and bright spots as well as decreased cytoplasm. Cellular and neurite fragments are also observed in extracellular compartment. Scale bar is 20 μm. f, g Prussian blue staining shows that Erastin stimulates the formation of Fe3+ (blue) in neurons. Lv-Prok2 suppresses this effect. Scale bar is 10 μm. The iron levels are determined based on the color intensities measured by ImageJ. Data presented as mean±SD (n = 3 independent experiments). h, i Cell viability analyzed by CCK-8. Cytotoxicity induced by Erastin is measured by LDH assay. Data presented as mean ± SD (n = 5 experiments). j Expression of Prok2, Gpx4 and Acsl4 in primary neurons under various treatment conditions. GAPDH is used as control in western blot assays. For all panels, n indicates biologically independent repeats. P value was determined by two-tailed unpaired Student’s t test for comparations between two groups. Source data are provided as a Source Data file.
Fig. 3
Fig. 3. Prok2 protects mitochondrial function in an Acsl4-dependent manner.
20 μM Erastin for 24 h is used to induce ferroptosis in these studies. a Mito-Tracker staining exhibits a fusiform structure, a small rod-like form in neurites, and an interconnected network in the cytoplasm in the normal primary neurons. Erastin treatment disrupts the mitochondrial network and mitochondria appear as small fragmented punctiform structures and small circles. Prok2 overexpression reduces mitochondrial circularity (b) and increases mitochondrial length (c). Data presented as mean ± SD (n = 5 experiments). d Immunofluorescence assessment of the expression and intracellular distribution of Tomm20 and Prok2. Prok2 overexpression increases Tomm20 positivity and promotes migration of mitochondria to neurites. Scale bar is 10 μm. e Representative electron microscopy images show shrunken mitochondria and outer membrane rupture upon exposure to Erastin (red arrow), which is inhibited by Prok2 overexpression. Scale bar is 500 nm. fl Expression levels of Acsl4, Gpx4, Tfam, Tomm20, and MT-ND1 (mitochondrial DNA copy number) in Acsl4 deficient (shAcsl4) and control (shCtrl) primary neurons. GAPDH is used as control. Data presented as mean ± SD (n = 3 experiments). m ATP levels are decreased upon exposure to Erastin. Overexpression of Prok2 prevented the decrease in mtDNA copy number and ATP levels in Erastin-treated cells. Data presented as mean ± SD (n = 5 experiments). n Representative TEM images illustrating that Erastin administration does not cause marked changes of mitochondrial morphology in shAcsl4 primary neurons. Scale bar is 500 nm. For all panels, n indicates biologically independent repeats. P value was determined by two-tailed unpaired Student’s t test for comparations between two groups. Source data are provided as a Source Data file.
Fig. 4
Fig. 4. Prok2 promotes Acsl4 ubiquitination degradation.
a Vector and Prok2 overexpressing (Lv-Prok2) primary cortical neurons are treated with 20 μM Erastin for 24 h. Then, actinomycin D (Act D), a transcription inhibitor blocking mRNA synthesis, is added at a concentration of 6 μg/ml, and total RNA is isolated at the indicated time points for semi-qRT-PCR analysis of Acsl4 and β-actin. Prok2 overexpression has no effect on the steady-state levels of Acsl4 mRNA. b Vector and Prok2 (Lv-Prok2) overexpressing primary cortical neurons are treated with 20 μM Erastin for 24 h after which CHX, a protein synthesis inhibitor, is added to cells at a concentration of 5 μg/ml. Total cell lysates are isolated at the indicated times and subjected to western blotting. Bands are visualized using antibodies against Acsl4 and GAPDH. c The line graph (left panel) shows the expressions of Acsl4 analyzed by ImageJ and the bar graph (right panel) indicates a higher Acsl4 degradation rate observed in Lv-Prok2 cells vs. vector after Erastin treatment. Data are presented as mean values ± SD (n = 3 experiments). d, e Primary cortical neurons are treated with 5 μg/ml CHX, 200 nM bortezomib (Bort), 50 nM bafilomycin A1 (Baf A1), or a combination of Bort and Baf A1 for 1 h prior to the addition of 20 μM Erastin. Cell lysates are obtained after 24 h of Erastin administration and immunoblotted for Acsl4 and GAPDH. Bar graph shows Acsl4 expression normalized to GAPDH under different conditions. Bort alone or in combination with Baf A1 blocks Prok2-mediated degradation of Acsl4. Data are presented as mean values ± SD (n = 3 experiments). fh Plasmids encoding Flag-tagged Acsl4 and HA-Ubiquitin (Ub) as well as empty vectors as controls are co-transfected into primary cortical neurons. Then cell lysates are immunoprecipitated with anti-Flag or anti-HA and western blot analysis is performed for Acsl4, Flag, and HA showing ubiquitinated species of Acsl4. i Primary cortical neurons expressing control empty vector or Lv-Prok2 are treated with 20 μM MG132 for 6 h to block proteasomal degradation and then are exposed to 20 μM Erastin for 24 h. Total lysates are analyzed for Acsl4 and ubiquitinated proteins by immunoblotting using anti-Acsl4 and anti-Ub antibodies. The decrease in Acsl4 protein observed upon Prok2 overexpression is abolished by MG132 and ubiquitination of Acsl4 is increased. j, k IP with Acsl4 antibody and western blot with anti-Ub show that ubiquitination of Acsl4 is higher in Prok2 overexpressing plus MG132-treated cells vs. control untreated cells as well as empty vector transfected plus MG132-treated cells. IgG is used as a negative control. Bar graph shows quantification of ubiquitinated Acsl4. Data are presented as mean values ± SD (n = 3 experiments). For all panels, n indicates biologically independent repeats. P value was determined by two-tailed unpaired Student’s t test for comparations between two groups. Source data are provided as a Source Data file.
Fig. 5
Fig. 5. Fbxo10 is crucial in Prok2-induced Acsl4 ubiquitination.
a Cell lysates obtained from primary cortical neurons are immunoprecipitated with Acsl4 antibody. Silver staining is used to reveal all proteins bound to Acsl4 antibody. Mass spectrometry analysis identified Fbxo10 as the only ubiquitin ligase in the extracted protein from primary cortical neurons. b Mass spectrogram of Fbxo10. c Immunofluorescence staining shows co-localization of Fbxo10 (green), Acsl4 (red) and Mito-tracker (blue) in primary cortical neurons. Scale bar is 10 μm. d IP with Acsl4 followed by western blot with anti-Ub shows that overexpression of Fbxo10 increases ubiquitination of Acsl4 in the presence or absence of Erastin. e Schematic representation of Fbxo10 fusion proteins (upper part). Interaction is detected between Fbxo10 domains (aa 460–867) and Acsl4 (lower part). f Overexpression of Prok2 in primary cortical neurons increases Fbxo10 protein levels in the presence or absence of Erastin. g, h Primary neurons are co-transfected with Lv-Prok2-Flag and Fbxo10 shRNA. Cell lysates are obtained and immunoprecipitated with Acsl4 antibody followed by western blot with anti-Ub. Prok2-induced ubiquitination of Acsl4 is decreased in Fbxo10-knockdown cells both in the presence and absence of Erastin. Acsl4 is used as a control in IP lysates; GAPDH is used as a control in input lysates. Source data are provided as a Source Data file.
Fig. 6
Fig. 6. AAV-Prok2 intracerebroventricular injection (i.c.v) decreases CCI-induced lesion volume in a Fbxo10-dependent way.
a GFP-tagged Prok2-AAV is injected into mouse brain at 1 week before CCI. Dual-labeled immunofluorescence staining with Prok2-eGFP (green) and NeuN (red) is used to test the efficiency of AAV transfection in neurons. Scale bar is 100 μm (left) and 30 μm (right). b Increased brain tissue Prok2 expression is detected by western blot at 7 days after i.c.v. injection of GFP-tagged Prok2-AAV. GAPDH is used as control. c, d AAV-shFbxo10 carrying luciferase is injected into mouse brain tissue. Cri Maestro In-vivo Imaging Systems is used to screen for successful transfection. Fbxo10 knockdown in brain tissue is confirmed by western blot assays. GAPDH is used as control. eg 2 days after CCI, protein expression of Gpx4 and Acsl4 proteins is examined by western blot analysis. Fer-1(1 mg/kg per day) is given i.p. once daily for 7 days before CCI and continued until euthanasia. While Acsl4 levels increases. Gpx4 levels do not change after CCI. AAV-Prok2 administration increases Gpx4 but decreases Acsl4 expression, which is blocked by Fbxo10 knockdown after CCI. Fer-1 administration suppresses CCI-induced increases in Acsl4 levels and alleviates AAV-shFbxo10-induced decrease in Gpx4 expression. Data are presented as mean values ± SD (n = 3 mice per group). h and i Representative T2 weighted MR images showing lesion volume in mouse brain after CCI in different experimental groups. While AAV-Prok2 transfection reduces lesion volume, co-transfection of AAV-Prok2 and AAV-shFbxo10 abolishes this effect. Administration of Fer-1 on the other hand decreases lesion volume in CCI mice expressing AAV-Prok2 and AAV-shFbxo10. Data are presented as mean values ± SD (n = 4 mice per group). j Mitochondrial morphology under different conditions is evaluated by electron microscopy. CCI-induced shrunken mitochondria and rupture of OMM, ferroptosis-related morphological changes of mitochondria (red arrow), are prevented by AAV-Prok2. k Immunostaining is used to examine the spatial distribution Gpx4 and Acsl4 expression in pericontusional area and shows similar treatment effect that is seen in western blot analysis observed in panels f, g. l, m Cell death response in the pericontusional area is quantified using TUNEL. Data are presented as mean values ± SD (n = 4 mice per group). For all panels, n indicates biologically independent repeats. P value was determined by two-tailed unpaired Student’s t test for comparations between two groups. Source data are provided as a Source Data file.
Fig. 7
Fig. 7. AAV-Prok2 improves neurobehavioral outcome after CCI.
a Schematic outlining the timeline for the neurobehavioral testing. Fer-1 (1 mg/kg) is given i.p. once daily for 7 days before CCI and continued until euthanasia or the MWM test. Motor function is evaluated using Rotarod 2 days after CCI. MWM is utilized to examine spatial memory acquisition. MWM consisted of df visible platform testing for 3 days (4 trials per day) to assess motor and visual capabilities, followed by hj hidden platform testing for 5 days (4 trials per day) to assess spatial learning ability. b A two-tailed unpaired Student’s t test and one-way ANOVA plus Tukey’s test revealed motor activity of inured AAV-Prok2-injected mice is improved versus CCI-alone (P = 0.0232). Addition of AAV-shFbxo10 abolishes this effect (P = 0.0222). Fer-1 attenuated the negative effect of AAV-shFbxo10 and enhanced motor function (P = 0.0263). Data are presented as mean values ± SD (n = 8 mice in sham group and 10 mice per group in other groups). c The rotation speed tolerated is not significantly different between groups except between sham + AAV-NC and CCI + AAV-NC. P = 0.0395 versus CCI + AAV-NC group. Data are presented as mean values ± SD (n = 8 mice in sham + AAV-NC group; n = 10 mice in CCI + AAV-NC group). df Latency to platform, distance to platform and swimming speed in the visible platform testing. Data are presented as mean values ± SD (n = 8 mice in sham + AAV-NC group; n = 10 mice per group in other groups). g Representative swimming tracks of the mice in all five groups on the 8th day of the MWM task. hj During the hidden platform testing, time spent to reach the platform (h), swimming distance (i) and swimming speed (j) are recorded. One-way ANOVA followed by Tukey post hoc test for different groups on the same time point are carried out. Among of them, *(red) means CCI + AAV-NC group versus sham + AAV-NC group; *(blue) means CCI + AAV-Prok2 group versus CCI + AAV-NC group; *(green) means CCI + AAV-Prok2 + shFbxo10 group versus CCI + AAV-Prok2 group; *(orange) means CCI + AAV-Prok2 + shFbxo10+Fer-1 group versus CCI + AAV-Prok2 + shFbxo10 group. Mice in CCI group spend more time (P(19d) < 0.0001, P(20d) < 0.0001, and P(21d) < 0.0001) and travel longer distances (P(19d) < 0.0001, P(20d) < 0.0001, and P(21d) < 0.0001) to reach the platform than sham. AAV-Prok2 mice exhibit a decrease in latency (P(19d) = 0.0199, P(20d) < 0.0001, and P(21d) < 0.0001) and distance (P(19d) = 0.0126, P(20d) < 0.0001, and P(21d) < 0.0001) as the training progressed. Mice injected with AAV-shFbxo10 group exhibits a significant decline in the ability to learn the spatial location of the submerged platform (P(19d) = 0.0499, P(20d) < 0.0001 and P(21d) < 0.0001 for latency; P(19d) = 0.0409, P(20d) < 0.0001, and P(21d) = 0.0004 for distance). However, Fer-1 administration significantly reduces the latency and distance spent on searching for the hidden platform despite AAV-shFbxo10 administration (P(19d) = 0.0009, P(20d) < 0.0001 and P(21d) < 0.0001 for latency; P(19d) = 0.004, P(20d) = 0.0002, and P(21d) < 0.0001 for distance). Swimming speed is not different between the groups. *P < 0.05, **P < 0.01, and ***P < 0.001. A two-way ANOVA with repeated measures followed by Tukey post hoc test is used for the whole groups, which reveals group by day interaction effect in latency to platform (F16,215 = 3.524, P < 0.0001), swimming distance (F16,215 = 1.998, P = 0.0145) and swimming speed (F16,215 = 0.6165, P = 0.8702) during hidden test. For MWM analysis, data are presented as mean values ± SD (n = 8 mice in sham + AAV-NC group; n = 10 mice per group in other groups).
Fig. 8
Fig. 8. A schematic diagram showing the neuroprotective and anti-ferroptotic effects of Prok2.
TBI and Erastin in primary neurons trigger ferroptotic process, resulting in lipid peroxidation, shrunken mitochondrial morphology and neuronal damage. Overexpression of Prok2 is anti-ferroptotic and neuroprotective by upregulating the expression of Fbxo10, a E3 ubiquitin ligase that binds to Acsl4, and thereby inducing ubiquitination degradation of Acsl4.

References

    1. Andelic N. The epidemiology of traumatic brain injury. Lancet Neurol. 2013;12:28–29. doi: 10.1016/S1474-4422(12)70294-6. - DOI - PubMed
    1. Rosenfeld JV, et al. Early management of severe traumatic brain injury. Lancet. 2012;380:1088–1098. doi: 10.1016/S0140-6736(12)60864-2. - DOI - PubMed
    1. Shafi S, et al. Suboptimal compliance with evidence-based guidelines in patients with traumatic brain injuries. J. Neurosurg. 2014;120:773–777. doi: 10.3171/2013.12.JNS132151. - DOI - PubMed
    1. Timmons, S. D., Waltzman, D., Duhaime, A. C., Spinks, T. J. & Sarmiento, K. Considerations for neurosurgeons: recommendations from the CDC Pediatric Mild Traumatic Brain Injury Guideline. J. Neurosurg. 131, 1–5 (2019). - PMC - PubMed
    1. Hutchinson PJ, et al. Trial of decompressive craniectomy for traumatic intracranial hypertension. N. Engl. J. Med. 2016;375:1119–1130. doi: 10.1056/NEJMoa1605215. - DOI - PubMed

Publication types

MeSH terms