. 2021 Jul 9;4(1):852.
doi: 10.1038/s42003-021-02361-1.

Multiplexed imaging analysis of the tumor-immune microenvironment reveals predictors of outcome in triple-negative breast cancer

Affiliations

Multiplexed imaging analysis of the tumor-immune microenvironment reveals predictors of outcome in triple-negative breast cancer

Aalok Patwa et al. Commun Biol. .

Abstract

Triple-negative breast cancer, the poorest-prognosis breast cancer subtype, lacks clinically approved biomarkers for patient risk stratification and treatment management. Prior literature has shown that interrogation of the tumor-immune microenvironment may be a promising approach to fill these gaps. Recently developed high-dimensional tissue imaging technology, such as multiplexed ion beam imaging, provide spatial context to protein expression in the microenvironment, allowing in-depth characterization of cellular processes. We demonstrate that profiling the functional proteins involved in cell-to-cell interactions in the microenvironment can predict recurrence and overall survival. We highlight the immunological relevance of the immunoregulatory proteins PD-1, PD-L1, IDO, and Lag3 by tying interactions involving them to recurrence and survival. Multivariate analysis reveals that our methods provide additional prognostic information compared to clinical variables. In this work, we present a computational pipeline for the examination of the tumor-immune microenvironment using multiplexed ion beam imaging that produces interpretable results, and is generalizable to other cancer types.


Conflict of interest statement

The authors declare no competing interests.

Figures
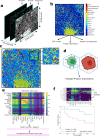
Fig. 1
Fig. 1. Overview of the computational pipeline.
a Drawing of the layered structure of MIBI scans. Each MIBI image has dimensions of 2048 × 2048 pixels with 44 channels, where each channel represents expression for each protein; i.e., each pixel in the image at each channel conveys the concentration of that protein at that location. b Color-mapped image of cell segmentation performed on a MIBI image. The cell segmentation map has one channel with dimensions of 2048 × 2048. Each cell has its own cell type represented in colors referenced in the color bar. From these cell segmentation maps and the original MIBI images, we extract cell counts, measure protein expression, and quantify co-expression. c Voronoi tessellation diagram of the cell segmentation map. Each polygon corresponds to a cell in the original segmentation, such that each point in the area of the polygon is closer to the centroid of the corresponding cell than any other cell. Each polygon borders a finite number of other polygons, simulating adjacencies between cells. d Using Voronoi diagrams, we analyze interactions between neighboring cells. e An interaction matrix is computed for each patient, with the entry at row A and column B representing the number of times a cell positive for protein A was adjacent to a cell positive for protein B (top). The top half triangle of the matrix, split across the diagonal, is selected, as shown with the purple rectangles. These rectangles are then flattened to form one feature vector, i.e., interaction features, for each patient. f Interaction features are used to cluster patients, and the two patient clusters are compared with regard to recurrence/survival using Kaplan–Meier curves and the log-rank test.
Fig. 2
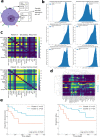
Fig. 2. Quantification and analysis of protein expression.
a Drawing showing how protein expression is calculated. The black squares each represent one pixel in the image. Expression levels are measured for each pixel in the cell and then summed across all pixels in the cell. The resulting number is divided by the size of the cell (in pixels), resulting in the average per-pixel expression level of the cell for each protein. b Histograms showing the distributions of log per-pixel expression levels for several relevant proteins. Per-pixel expression in the background channel (the positivity threshold) is shown with the vertical dotted line. c Heatmaps showing the cube root of co-expression of pairs of functional proteins in two different patients. The color bar also shows the cube root, so color value 16 indicates 163 instances of co-expression. d Clustermap showing flattened features for all 38 patients. Two clusters were chosen from the dendrogram. The red line shows the way that the two clusters were separated. e Kaplan–Meier curves comparing clusters formed from co-expression features for recurrence and overall survival. Two-sided log-rank test (df = 1) p-values are shown in the plot legend.
Fig. 3
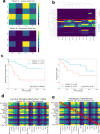
Fig. 3. Analysis of cell-to-cell interactions.
a Drawing showing how interactions are analyzed to find which combinations of proteins are involved in the interaction. The interaction is characterized by the adjacency of the two Voronoi polygons. Each cell involved in the interaction has a unique protein expression pattern, resulting in complex interactions. b Heatmaps showing the cube root of the number of interactions between pairs of functional proteins in two patients. The entry at row A and column B in the heatmap represent the cube root of the number of times that a cell positive for protein A was adjacent to a cell positive for protein B in that patient’s MIBI image. Pairs that had zero interactions are excluded from the plot. c Clustermap of patients’ functional protein interaction features. d Kaplan–Meier curves of recurrence and overall survival comparing clusters formed from interaction features. Two-sided log-rank test (df = 1) p-values are shown in the plot legend.
Fig. 4
Fig. 4. Analysis of subsets of interactions.
a Heatmaps of the interaction matrices of immunoregulatory proteins (IDO, Lag3, PD-L1, PD-1) for two patients, whose outcomes are shown above the heatmaps. b Clustermap of patient’s immunoregulatory protein interaction features. The place at which the dendrogram was split is indicated with a red line. c Kaplan–Meier curves for recurrence and survival comparing clusters formed from immunoregulatory protein interactions. Two-sided log-rank test (df = 1) p-values are shown in the plot legends. d Diagram showing how the interactions of individual proteins are evaluated through ablation analysis one at a time. The only interactions included as features are the ones that involve a specific protein. The diagram gives the example of CD63. e Diagram showing the set of homotypic interactions. As shown by the red boxes, only the entries in the diagonal are included as features.
Fig. 5
Fig. 5. Random forest variable importance.
a Bar plot showing the mean SHAP value for each variable in a random forest predicting recurrence, with n = 38 TNBC images. SHAP (Shapley additive explanations) values are a measure of variable importance that quantifies how the expected model prediction would change when conditioning on a certain variable. They are more aligned with human intuition than other feature attribution methods. b Bar plot showing the mean SHAP value for each variable in a random forest predicting survival, with n = 38 TNBC images.

References

    1. Aysola, K. et al. Triple negative breast cancer—an overview. Hereditary Genet. 2013 (2013). - PMC - PubMed
    1. Anders C, Carey LA. Understanding and treating triple-negative breast cancer. Oncology. 2008;22:1233–1239. - PMC - PubMed
    1. Omarini C, et al. Neoadjuvant treatments in triple-negative breast cancer patients: where we are now and where we are going. Cancer Manag. Res. 2018;10:91–103. doi: 10.2147/CMAR.S146658. - DOI - PMC - PubMed
    1. Carey LA, et al. Race, breast cancer subtypes, and survival in the Carolina breast cancer study. JAMA. 2006;295:2492–2502. doi: 10.1001/jama.295.21.2492. - DOI - PubMed
    1. Blows FM, et al. Subtyping of breast cancer by immunohistochemistry to investigate a relationship between subtype and short and long term survival: a collaborative analysis of data for 10,159 cases from 12 studies. PLoS Med. 2010;7:e1000279. doi: 10.1371/journal.pmed.1000279. - DOI - PMC - PubMed

Publication types

MeSH terms