

Tutorial: best practices and considerations for mass-spectrometry-based protein biomarker discovery and validation
- PMID: 34244696
- PMCID: PMC8830262
- DOI: 10.1038/s41596-021-00566-6
Tutorial: best practices and considerations for mass-spectrometry-based protein biomarker discovery and validation
Abstract
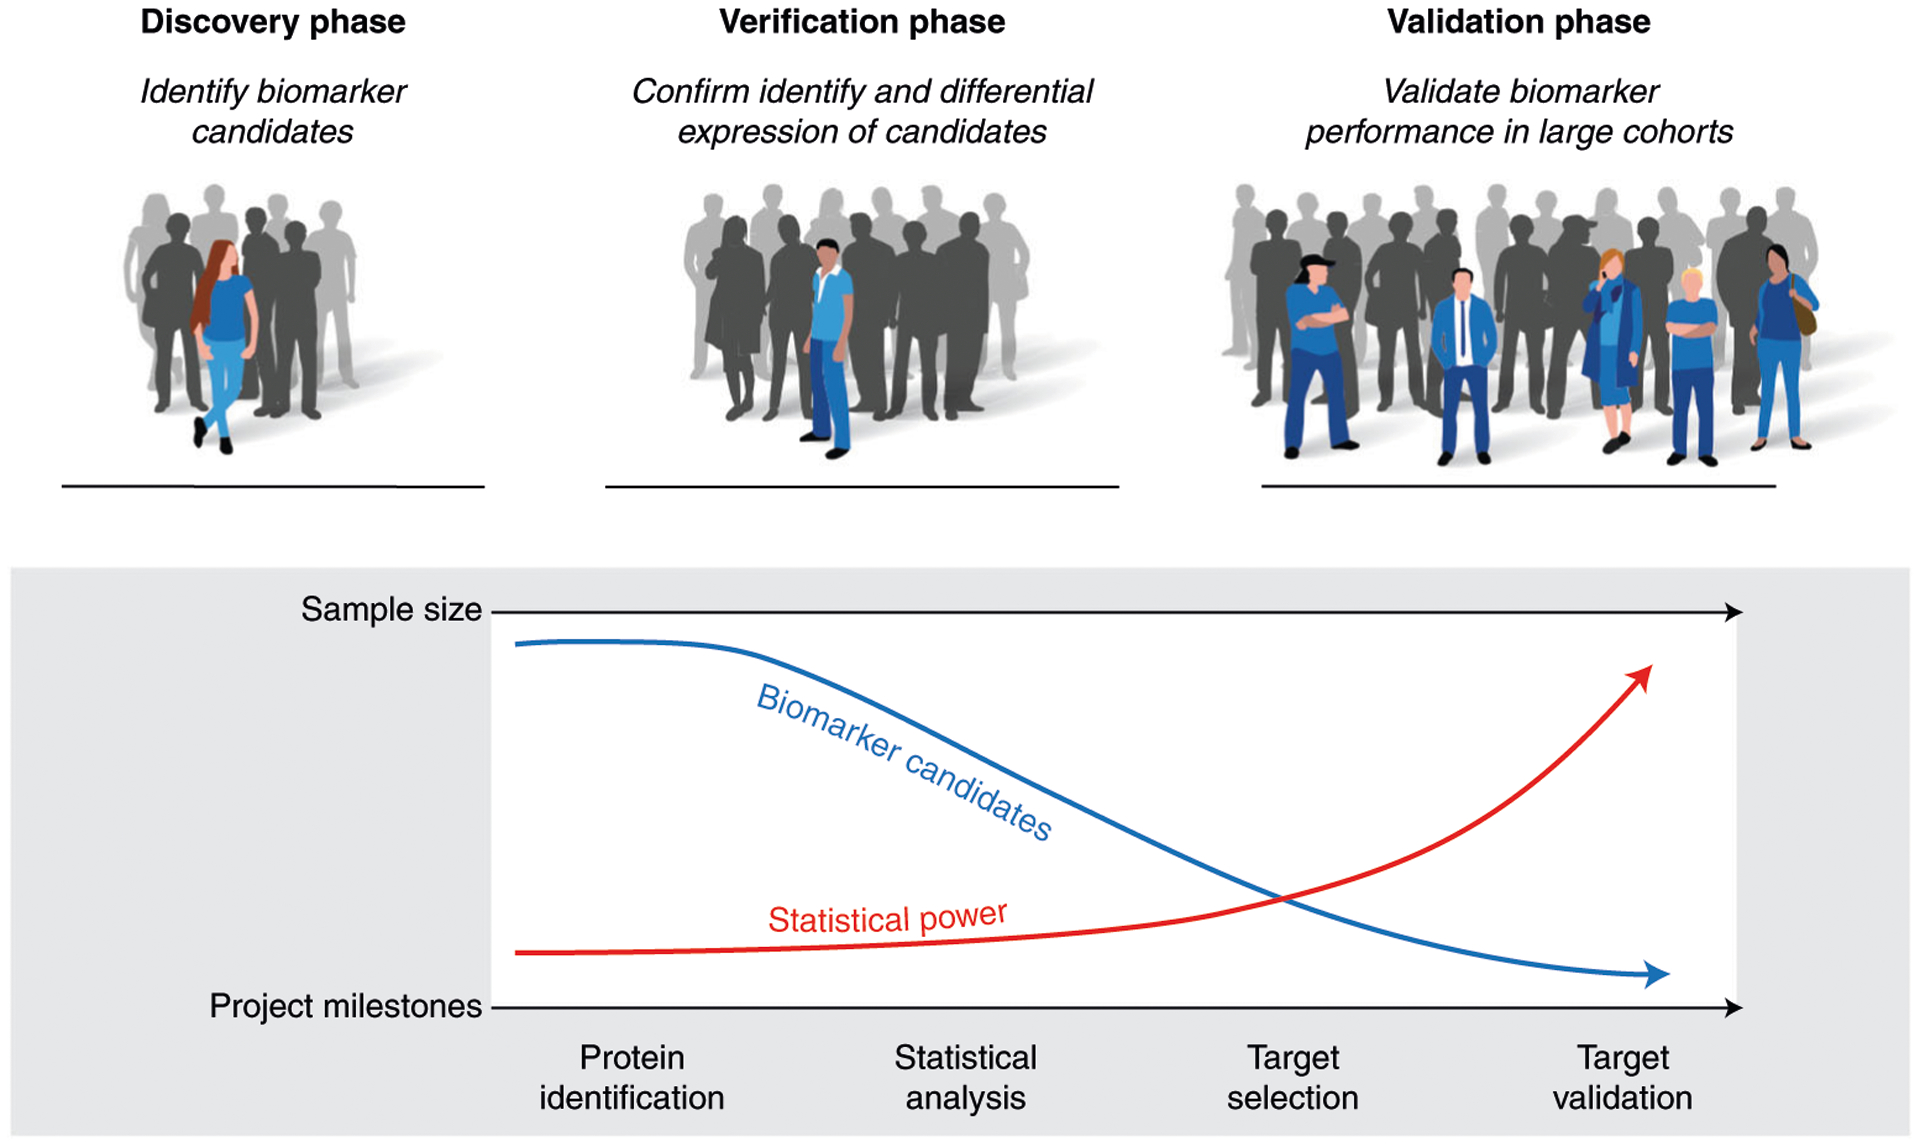
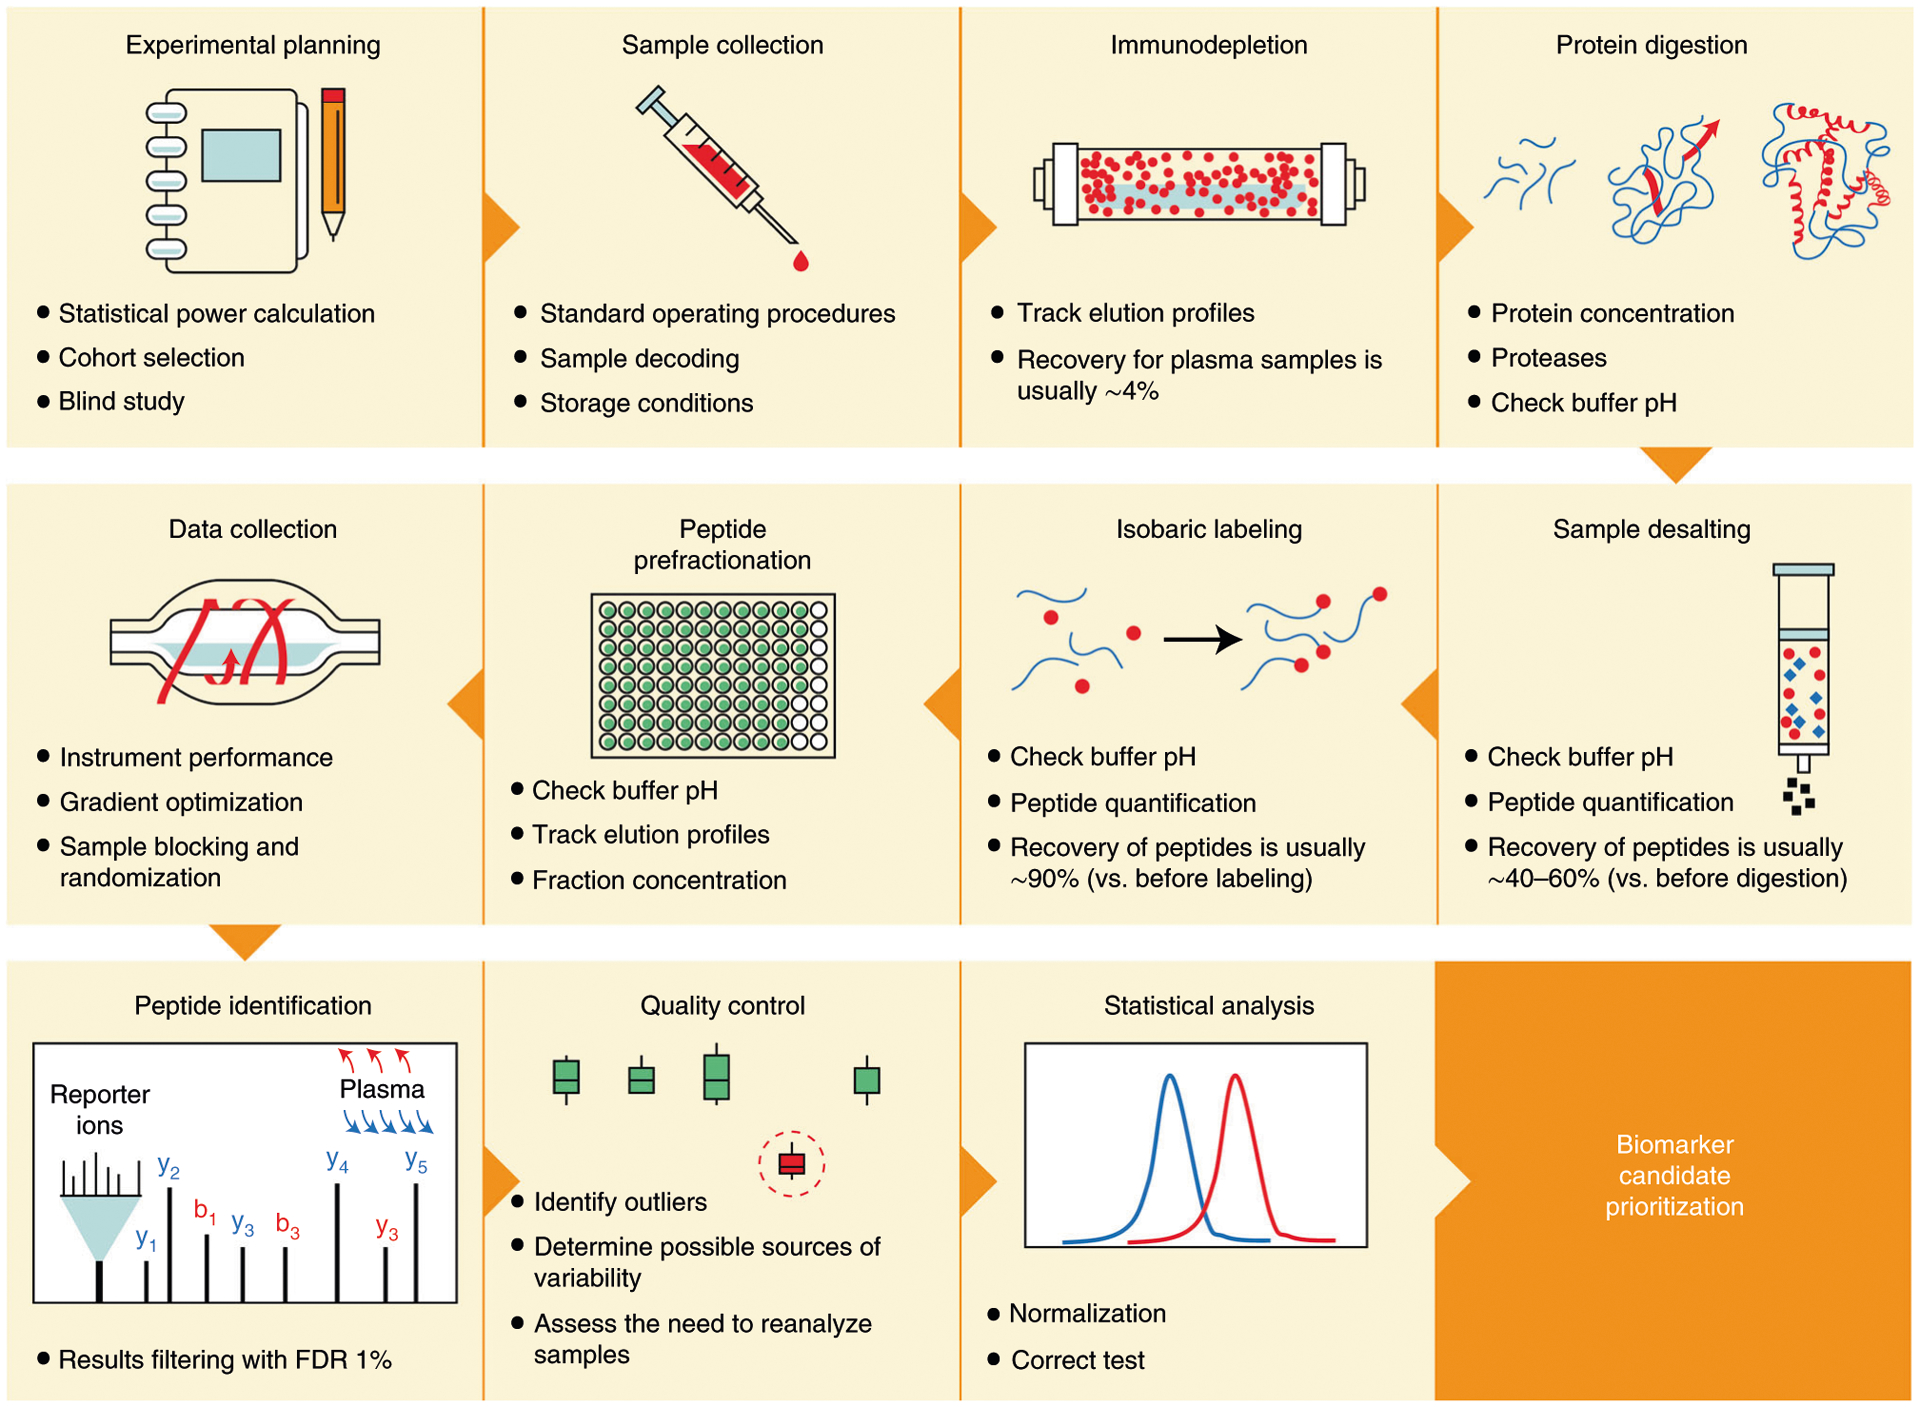
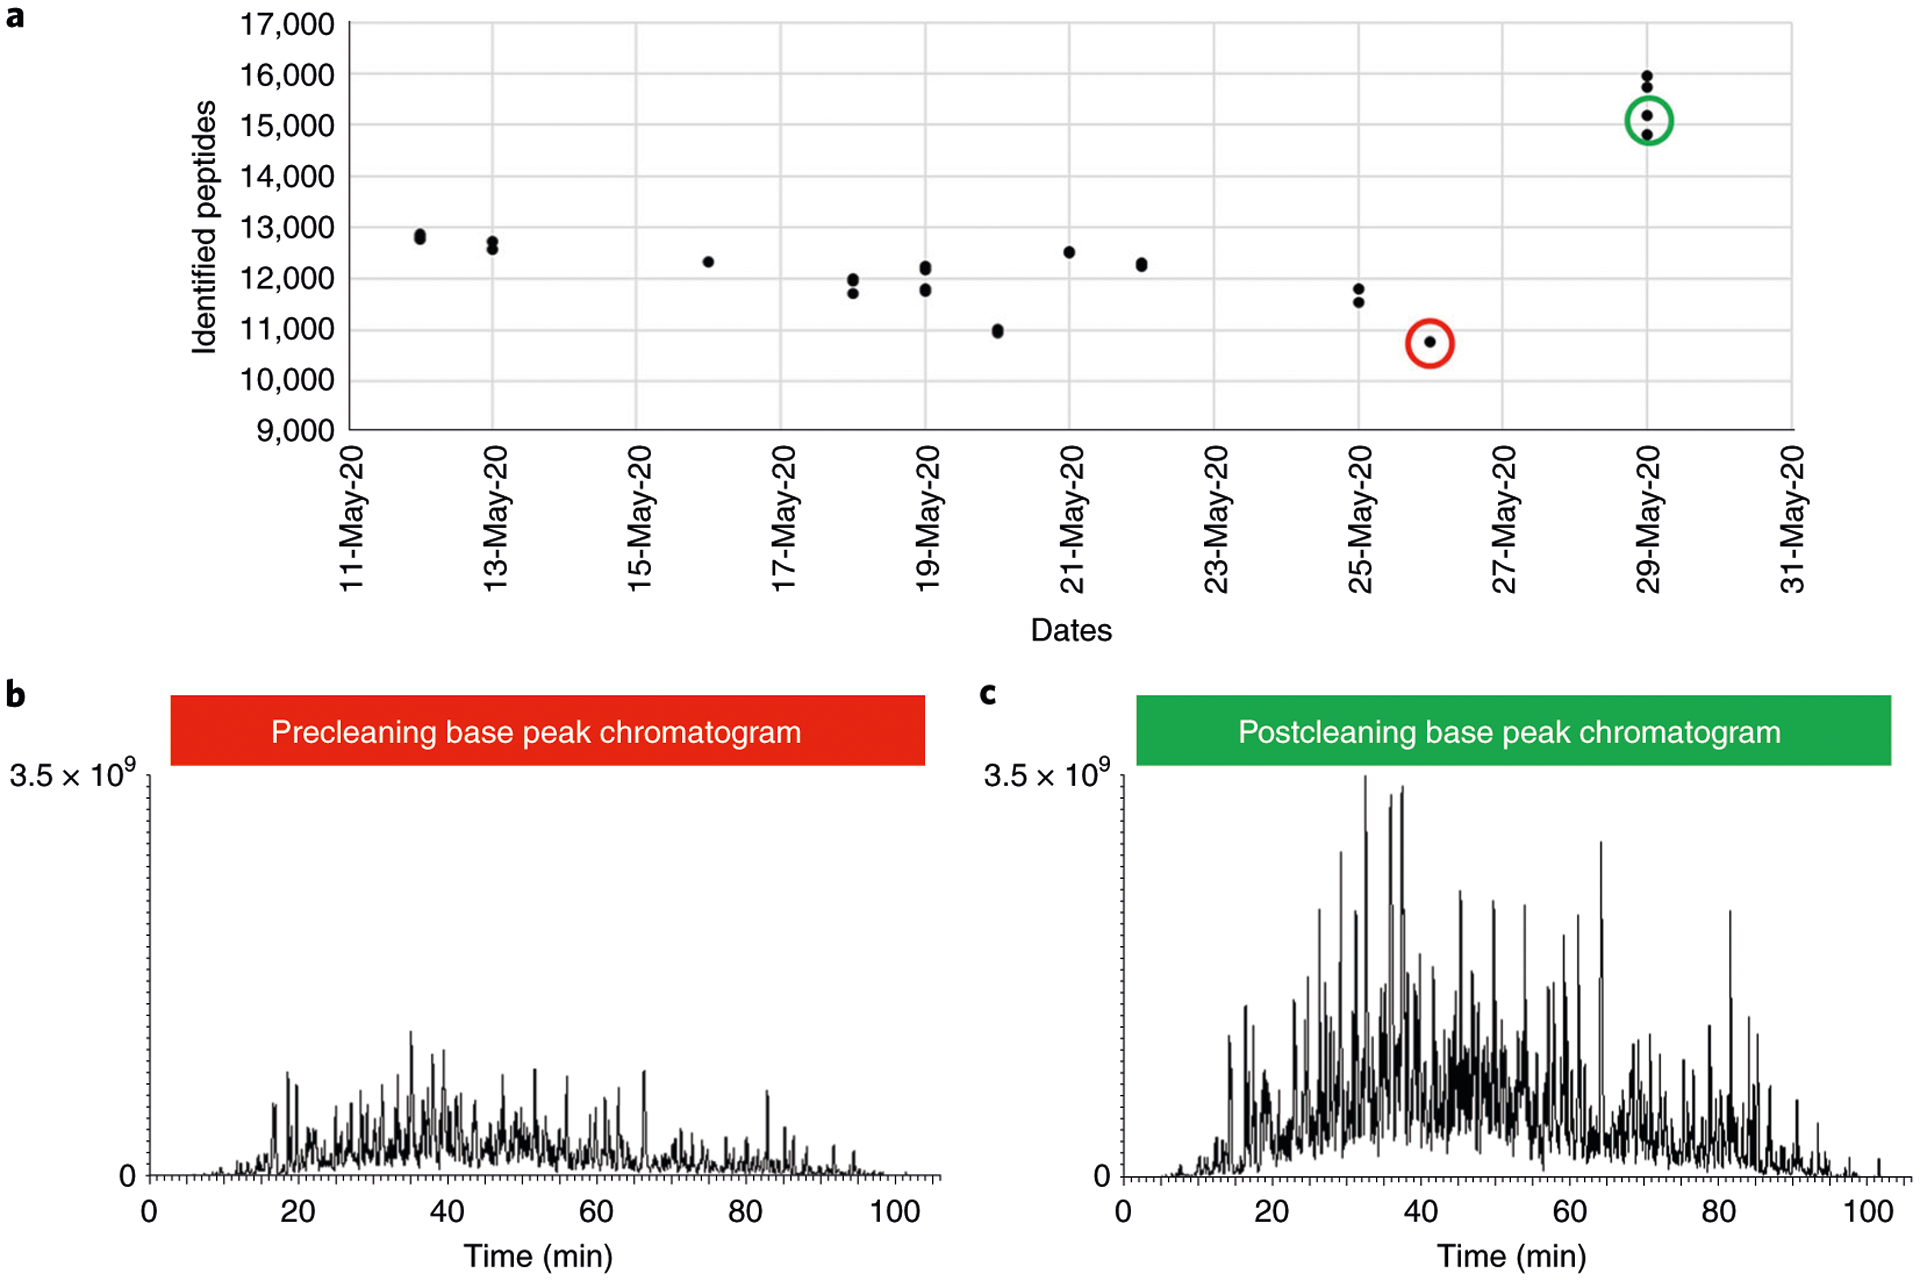
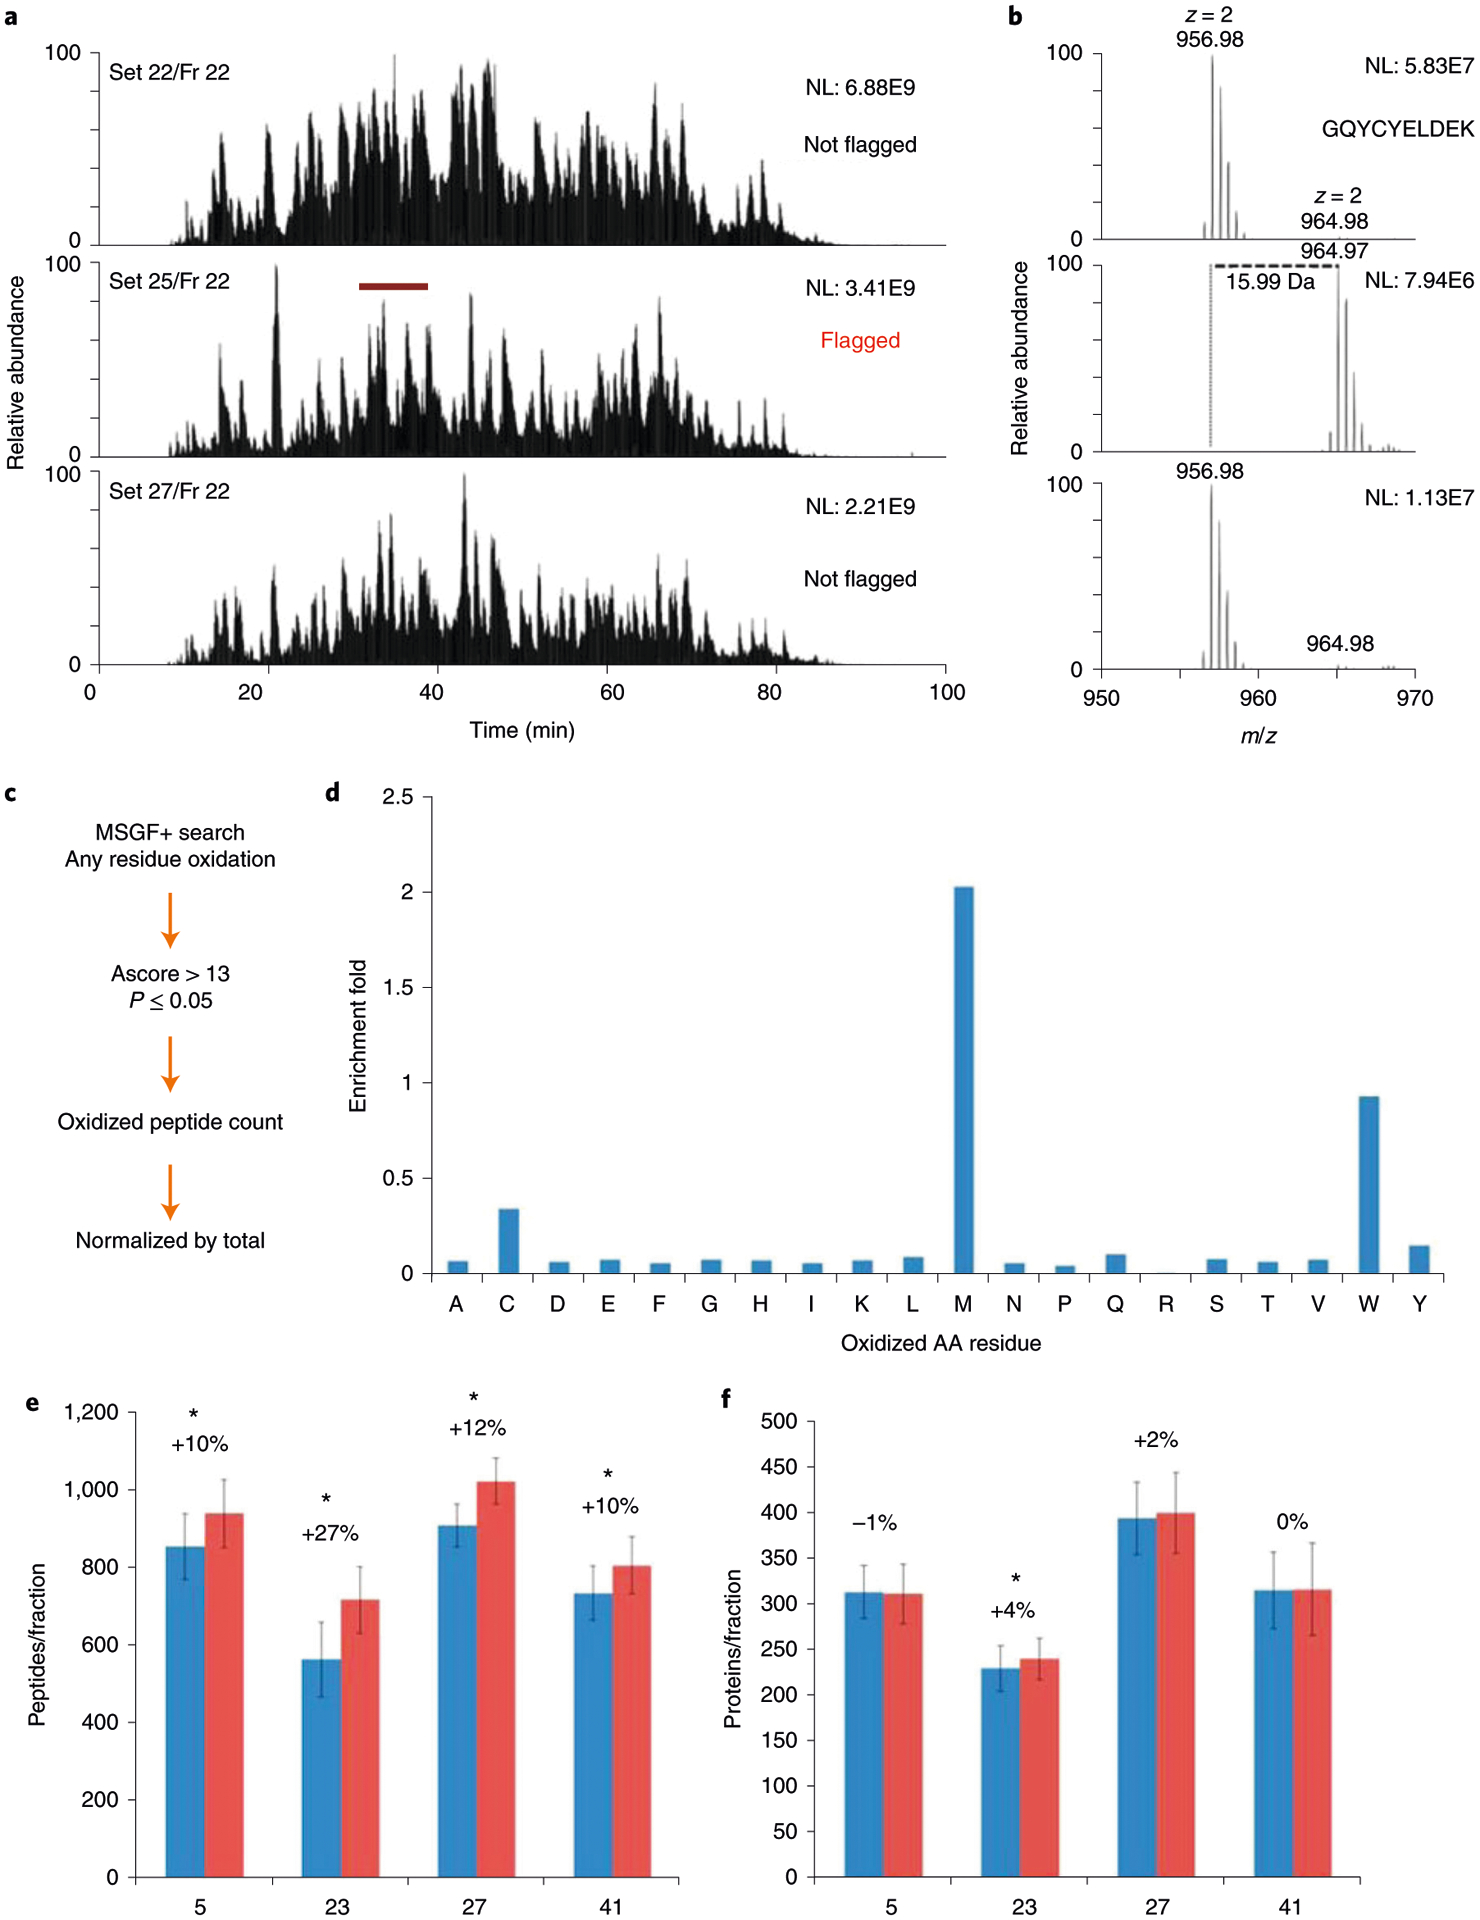
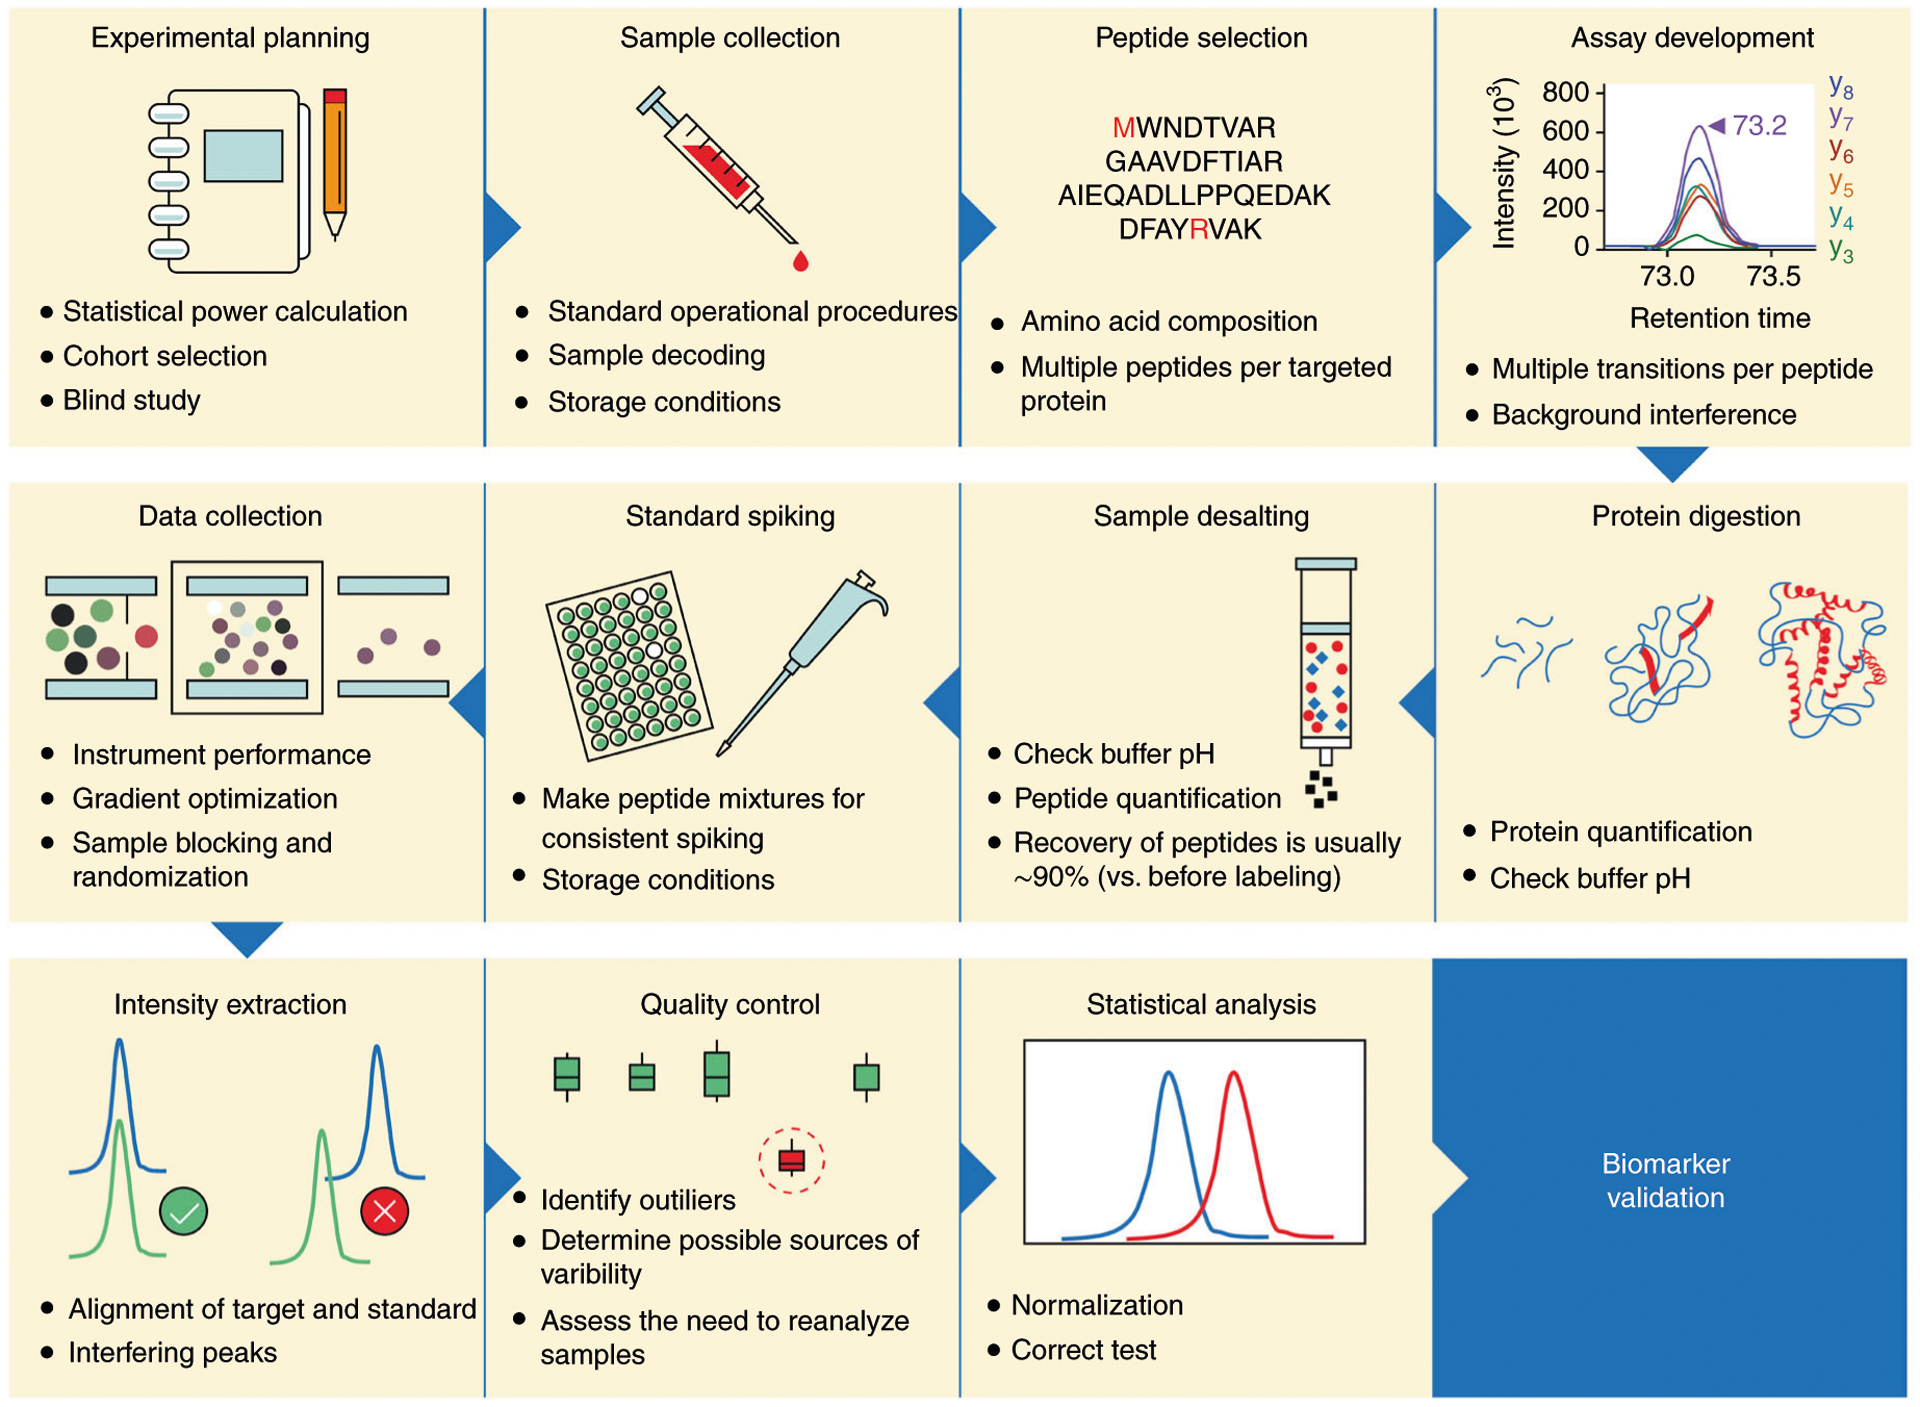
Mass-spectrometry-based proteomic analysis is a powerful approach for discovering new disease biomarkers. However, certain critical steps of study design such as cohort selection, evaluation of statistical power, sample blinding and randomization, and sample/data quality control are often neglected or underappreciated during experimental design and execution. This tutorial discusses important steps for designing and implementing a liquid-chromatography-mass-spectrometry-based biomarker discovery study. We describe the rationale, considerations and possible failures in each step of such studies, including experimental design, sample collection and processing, and data collection. We also provide guidance for major steps of data processing and final statistical analysis for meaningful biological interpretations along with highlights of several successful biomarker studies. The provided guidelines from study design to implementation to data interpretation serve as a reference for improving rigor and reproducibility of biomarker development studies.
© 2021. This is a U.S. government work and not under copyright protection in the U.S.; foreign copyright protection may apply.
Conflict of interest statement
Competing interests
The authors declare no competing interests.
Figures
References
-
- Sands BE Biomarkers of inflammation in inflammatory bowel disease. Gastroenterology 149, 1275–1285 e1272 (2015). - PubMed
-
- Lindhardt M et al. Proteomic prediction and Renin angiotensin aldosterone system Inhibition prevention Of early diabetic nephRopathy in TYpe 2 diabetic patients with normoalbuminuria (PRIORITY): essential study design and rationale of a randomised clinical multicentre trial. BMJ Open 6, e010310 (2016). - PMC - PubMed
Key references using this review
Publication types
MeSH terms
Substances
Grants and funding
- U01 DK063821/DK/NIDDK NIH HHS/United States
- R21 DK119800/DK/NIDDK NIH HHS/United States
- I01 BX001733/BX/BLRD VA/United States
- UL1 TR002535/TR/NCATS NIH HHS/United States
- P30 DK116073/DK/NIDDK NIH HHS/United States
- P30 DK097512/DK/NIDDK NIH HHS/United States
- U01 DK063861/DK/NIDDK NIH HHS/United States
- U01 DK063790/DK/NIDDK NIH HHS/United States
- R01 DK032493/DK/NIDDK NIH HHS/United States
- R01 DK093954/DK/NIDDK NIH HHS/United States
- UC4 DK063863/DK/NIDDK NIH HHS/United States
- UC4 DK104166/DK/NIDDK NIH HHS/United States
- UL1 TR000064/TR/NCATS NIH HHS/United States
- HHSN267200700014C/LM/NLM NIH HHS/United States
- U01 DK063836/DK/NIDDK NIH HHS/United States
- U01 DK127786/DK/NIDDK NIH HHS/United States
- U01 DK063829/DK/NIDDK NIH HHS/United States
- U01 DK063865/DK/NIDDK NIH HHS/United States
- UC4 DK095300/DK/NIDDK NIH HHS/United States
- UC4 DK063861/DK/NIDDK NIH HHS/United States
- UC4 DK063829/DK/NIDDK NIH HHS/United States
- UC4 DK063821/DK/NIDDK NIH HHS/United States
- UC4 DK117483/DK/NIDDK NIH HHS/United States
- UC4 DK063836/DK/NIDDK NIH HHS/United States
- UC4 DK112243/DK/NIDDK NIH HHS/United States
- UC4 DK063865/DK/NIDDK NIH HHS/United States
- U01 DK063863/DK/NIDDK NIH HHS/United States
- UC4 DK106955/DK/NIDDK NIH HHS/United States
- U01 DK124020/DK/NIDDK NIH HHS/United States
- UC4 DK100238/DK/NIDDK NIH HHS/United States
LinkOut - more resources
Full Text Sources
