Review
. 2021 Aug;16(8):4004-4030.
doi: 10.1038/s41596-021-00571-9. Epub 2021 Jul 9.

Smart-RRBS for single-cell methylome and transcriptome analysis

Affiliations
Review

Smart-RRBS for single-cell methylome and transcriptome analysis

Hongcang Gu et al. Nat Protoc. 2021 Aug.

Abstract

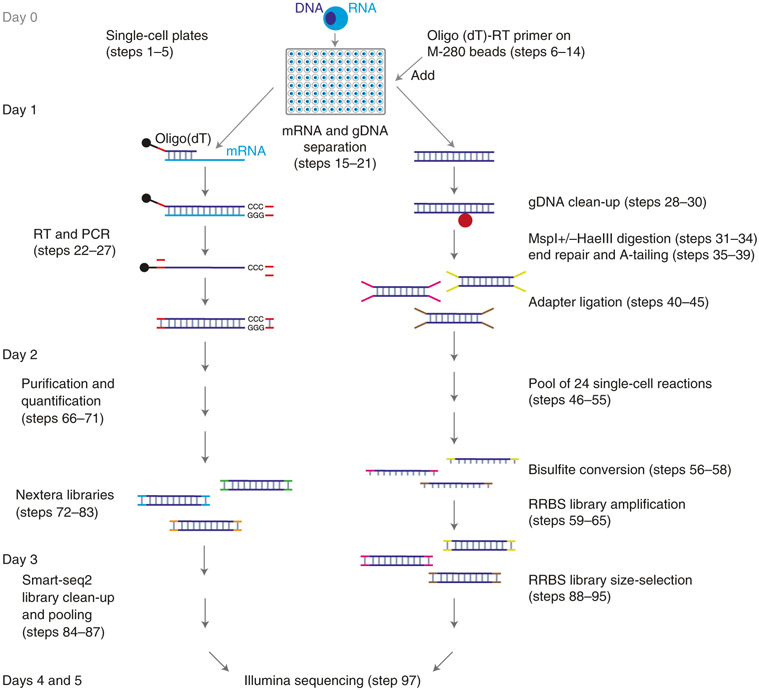
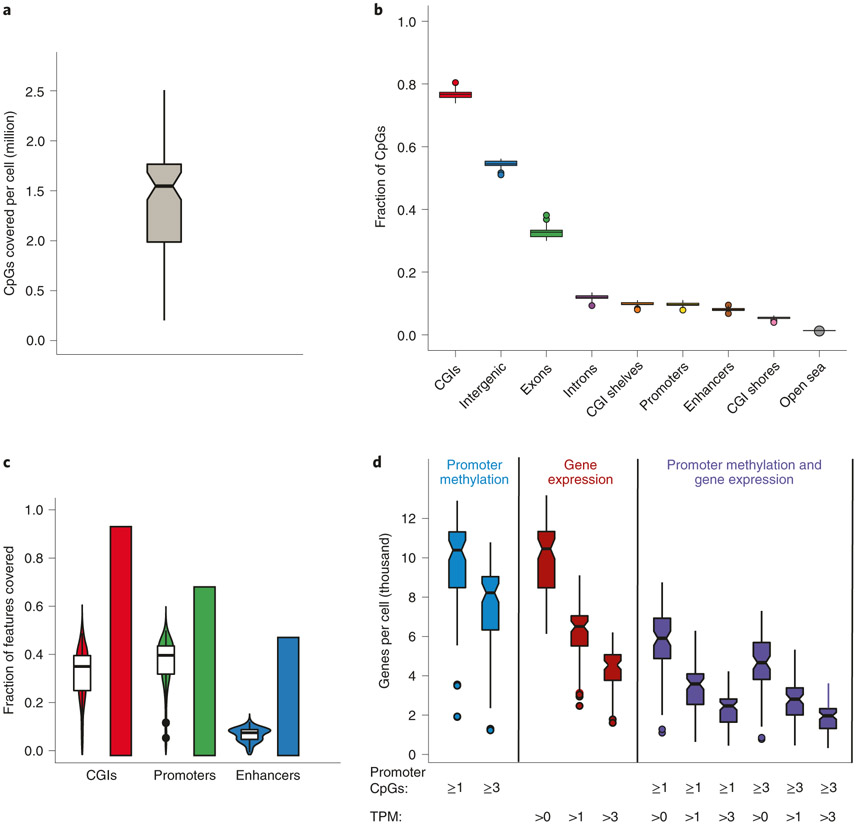
The integration of DNA methylation and transcriptional state within single cells is of broad interest. Several single-cell dual- and multi-omics approaches have been reported that enable further investigation into cellular heterogeneity, including the discovery and in-depth study of rare cell populations. Such analyses will continue to provide important mechanistic insights into the regulatory consequences of epigenetic modifications. We recently reported a new method for profiling the DNA methylome and transcriptome from the same single cells in a cancer research study. Here, we present details of the protocol and provide guidance on its utility. Our Smart-RRBS (reduced representation bisulfite sequencing) protocol combines Smart-seq2 and RRBS and entails physically separating mRNA from the genomic DNA. It generates paired epigenetic promoter and RNA-expression measurements for ~24% of protein-coding genes in a typical single cell. It also works for micro-dissected tissue samples comprising hundreds of cells. The protocol, excluding flow sorting of cells and sequencing, takes ~3 d to process up to 192 samples manually. It requires basic molecular biology expertise and laboratory equipment, including a PCR workstation with UV sterilization, a DNA fluorometer and a microfluidic electrophoresis system.


Figures

Extended Data Fig. 1 ∣
Extended Data Fig. 1 ∣. Schematic of steps involved in the workflow of the RRBS data analysis.
The figure is divided into three sections. In the operations section, each box contains a description of the data analysis step, and arrows indicate the progression through the analysis workflow. First, the user can easily run the FastQC analysis, which provides basic sequencing quality metrics, base composition and Illumina-adapter content. The rest of the workflow is developed in the Workflow Description Language format and is available on Terra, a cloud-native platform that runs in the Google cloud. Each row shows the input files that are required for each operation and the format of result reports or files that will be obtained. The last analysis steps (quality-filtering of cells, saturation plot and pseudo bulk analysis) have been described in the main text.
Extended Data Fig. 2 ∣
Extended Data Fig. 2 ∣. Process for manually dispensing a master mix to a sample plate.
This two-step technique is recommended at several steps of the protocol.
Extended Data Fig. 3 ∣
Extended Data Fig. 3 ∣. RRBS performance metrics and global CpG methylation across 80 passing cells.
Notched box plots to show the overall and inner-quartile range, median and 95% confidence interval of the number of purity filtered and fully demultiplexed RRBS reads before and after genome alignment (total and unique alignments) (a), the C-to-U bisulfite conversion rate of presumably unmethylated cytosines in non-CpG (CpH) context covered by RRBS reads (b) and the mean methylation level at all CpG sites covered in a given cell (c). d, Venn diagrams showing median and mean numbers of CpG sites covered per passing cell exclusively by reads from the large or small size fraction or covered by both. The approximate total numbers of passing read pairs in 80 passing cells from large and small size fractions were 83 million and 90 million, respectively. Aligned and uniquely aligned read numbers for each size fraction are available in the source data for this figure.
Extended Data Fig. 4 ∣
Extended Data Fig. 4 ∣. RNA-seq performance metrics across 80 passing cells.
Notched box plots to show the overall and inner-quartile range, median and 95% confidence interval of purity-filtered demultiplexed RNA-seq reads before and after alignment to the genome (total and unique alignments) by using STAR v.2.7.3a with the arguments --quantMode GeneCounts --sjdbGTFtagExonParentGene gene_name --outFilterScoreMinOverLread 0.1 --outFilterMatchNminOverLread 0.1 (a), the library size of unique reads aligning to exons (b) and the fraction of exonic reads that map to the mitochondrial genome (c).
Extended Data Fig. 5 ∣
Extended Data Fig. 5 ∣. Down-sampling and extrapolation of RRBS effort and CpG coverage.
a, The aggregate set of passing RRBS read pairs from 80 single cells was randomly down-sampled in steps from the full data (1 on the x-axis; 1.72 billion total read pairs; mean: 2.15 million per cell) to 0.01. The number of CpGs covered in each cell at each step was determined, and the corresponding saturation curves were normalized by the CpGs covered at the original full sequencing effort, interpolated and plotted as a function of the relative sequencing effort (fraction of reads). The blue dots represent the mean normalized fraction of CpGs at each step. b, The blue dots in the saturation curve are the same down-sampled data points as in a. The insert is a linear regression (R2 = 0.99999) of the actual mean normalized CpGs (blue dots) versus calculated mean normalized CpGs, assuming the saturation curve follows a Michaelis-Menten equation: (Fraction of CpGs)calc = (Fraction of reads/0.6004)/(Fraction of reads + 0.4023/0.6004), whereby 0.6004 and 0.4023 were the slope and y-intercept, respectively, of a Hanes-Woolf linearization of the Michaelis-Menten equation (R2 = 0.9999). The red dots are extrapolated mean normalized fractions of RRBS-covered CpGs. The saturation curve approaches a limit of ~1.67 on the y-axis, corresponding to a mean of 2.3 million CpGs per cell. Extrapolation to 5 on the x-axis results in 2.0 million CpGs per cell on average.
Extended Data Fig. 6 ∣
Extended Data Fig. 6 ∣. Fraction of all annotated CpG islands, promoters and enhancers covered at three or more CpGs.
Violin box plots show the distribution of the fraction of all annotated CGIs, promoters of protein-coding genes and permissive FANTOM5 enhancers in the human genome with RRBS coverage at three or more CpGs at the single-cell level. Bars indicate the fraction of these genomic features covered by RRBS reads aggregated from all 80 passing single cells.
Extended Data Fig. 7 ∣
Extended Data Fig. 7 ∣. Comparability of distinct CpG sites and CpG islands across single cells.
Shown on the left y-axes are the absolute numbers and fractions of their respective pseudo-bulk aggregate numbers of common CpGs (red) or CGIs (blue) that can be compared anywhere in the data set across the number of cells indicated on the x-axis. The absolute numbers were the CpGs or CGIs with n or more hits in a matrix of 80 cells versus all CpGs (10,532,278) or all CGIs (26,887) that were hit at least once in data aggregated from all 80 passing cells (i.e., the pseudo-bulk aggregate, which is by definition the value for comparability across n = 1 cell). The minimum coverage threshold for CGIs is one CpG. The y-axis on the right is the ratio of the fractions of comparable CGIs and CpGs.
Extended Data Fig. 8 ∣
Extended Data Fig. 8 ∣. Genes with the highest RNA expression levels in 80 passing cells.
Tick marks on the horizontal lines denote TPM calculated for each single cell. Genes are ordered top to bottom by the Mean TPM value (blue circles) across 80 single cells. The eleven most highly expressed genes are mitochondrial (MT) genes.
Extended Data Fig. 9 ∣
Extended Data Fig. 9 ∣. Expression levels of 18 genes associated with pluripotent cells.
Shown are the distribution (violin plots) and single cell values (dots) of expression levels (TPM) on a log2 scale.
Fig. 1 ∣
Fig. 1 ∣. Schematic overview of the Smart-RRBS protocol.
After deposition by flow cytometry of single cells into a 96-well plate containing lysis buffer and optional flash freezing and storage at −80 °C, poly(A)+ mRNAs are pulled down by using M-280 streptavidin beads (shown as black dots) coated with a 5′ biotinylated oligo(dT) RT primer. Genomic DNA (gDNA) in the supernatant is cleaned up on AMPure beads (shown as a red dot). After separation of mRNA from genomic DNA, single-cell RRBS and Smart-seq2 libraries are generated separately. Not counting the time it takes to sort cells into single-cell plates at the beginning (Steps 1-5) and to generate Illumina sequencing data at the end (Step 96), it takes ~3 d to carry out both branches of the Smart-RRBS protocol when Smart-seq2 and RRBS library construction steps are staggered as described in the step-by-step procedure.
Fig. 2 ∣
Fig. 2 ∣. Electrophoretic quality control.
a, Agilent bioanalyzer gel-like images of PCR-amplified cDNA derived from 11 single cells. Typical sizes range from 300 bp to 7 kb with modes between 1 and 2 kb. b, Agilent TapeStation gel-like images of 12 single-cell RNA-seq libraries. Typical Smart-seq2 libraries contain products ranging from 300 bp to 1 kb with a mode around 500 bp, including sequencing adapters. c, Bioanalyzer run of four sets of RRBS libraries after PCR amplification (Step 65). The pronounced bands represent repetitive restriction fragments from satellite sequences in the human genome. d, Final sequencing libraries QCed and quantitated on a Bioanalyzer. Lanes 1 and 2 are small and large size cuts of RRBS library pools; lane 3 is a pooled set of Smart-seq2 libraries. e, Rare examples of Smart-RRBS failures. Shown are gel-like Bioanalyzer images of RRBS libraries (lanes 1 and 2) that contained essentially nothing but PCR-amplified adapter dimers (that run as two pronounced bands), possibly because of improper cell sorting (empty wells or damaged DNA-less debris) or incomplete cell lysis preventing the release of nuclear DNA, and failed cDNA amplifications (lanes 3 and 4) caused by either improper cell sorting (empty wells, cell damage and leakage of cytoplasmic mRNA) or any other conceivable reason as described in the trouble-shooting section.
Fig. 3 ∣
Fig. 3 ∣. Quality filters for Smart-RRBS data.
Scatter plots of the two primary filters for RRBS (distinct CpGs covered over passing read pairs) and Smart-seq2 (genes detected at TPM >0 over aligned reads) for 96 single cells are shown at the top, with the quality thresholds on both axes indicated by dashed lines. The numbers of passing cells in the upper right quadrant were 84 (RRBS) and 91 (RNA-seq). The Venn diagram at the bottom illustrates the intersection of 80 cells that passed all quality filters for both assays. One cell failed both RRBS and RNA-seq QCs and is not represented in the Venn diagram.
Fig. 4 ∣
Fig. 4 ∣. Performance metrics for 80 passing cells.
a, Notched box plot showing the overall and inner-quartile range, median and 95% confidence interval of the number of unique CpG sites covered by at least one RRBS read. b, Box plots showing the fraction of CpGs covered by RRBS reads that map to the eight genome compartments indicated on the x axis. Note that a given CpG can be assigned to more than one genome compartment. Annotations of features were accessed through the annotatr package. The total number of CpG islands assigned to chromosomes in hg38 is 27,949. CpG shores are defined as 2 kb upstream/downstream from the ends of the CpG islands, and CpG shelves are defined as another 2 kb upstream/downstream of the farthest upstream/downstream limits of the CpG shores. Exons, introns and intergenic regions refer to 25,130 protein-coding genes in hg38. Promoters are 1-kb segments including and upstream of 25,130 annotated transcription start sites of the same protein-coding genes. Enhancers are the permissive enhancer annotations from the FANTOM5 dataset. c, Violin box plots showing the distribution of the fractions of all annotated CGIs, promoters of protein-coding genes and FANTOM5 enhancers in the human genome with RRBS coverage at one or more CpGs at the single-cell level. Bars indicate the fraction of these genomic features covered by RRBS reads aggregated from all 80 passing single cells. d, Notched box plots showing the number of protein-coding genes covered by RRBS at a minimum of one or three CpGs in their promoter region (left panel), detected by Smart-seq2 at TPMs >0, >1 or >3 (middle) and with both promoter methylation and gene expression data at the minimal respective thresholds indicated (right panel).

References

    1. Tang F et al. mRNA-Seq whole-transcriptome analysis of a single cell. Nat. Methods 6, 377–382 (2009). - PubMed
    1. Gawad C, Koh W & Quake SR Single-cell genome sequencing: current state of the science. Nat. Rev. Genet 17, 175–188 (2016). - PubMed
    1. Navin N et al. Tumour evolution inferred by single-cell sequencing. Nature 472, 90–94 (2011). - PMC - PubMed
    1. Lu S et al. Probing meiotic recombination and aneuploidy of single sperm cells by whole-genome sequencing. Science 338, 1627–1630 (2012). - PMC - PubMed
    1. Zong C, Lu S, Chapman AR & Xie XS Genome-wide detection of single-nucleotide and copy-number variations of a single human cell. Science 338, 1622–1626 (2012). - PMC - PubMed

Publication types

MeSH terms