. 2021 Sep;70(9):2701-2719.
doi: 10.1007/s00262-021-03001-7. Epub 2021 Jul 9.

Anti-tumor effects of RTX-240: an engineered red blood cell expressing 4-1BB ligand and interleukin-15

Affiliations

Anti-tumor effects of RTX-240: an engineered red blood cell expressing 4-1BB ligand and interleukin-15

Shannon L McArdel et al. Cancer Immunol Immunother. 2021 Sep.

Abstract

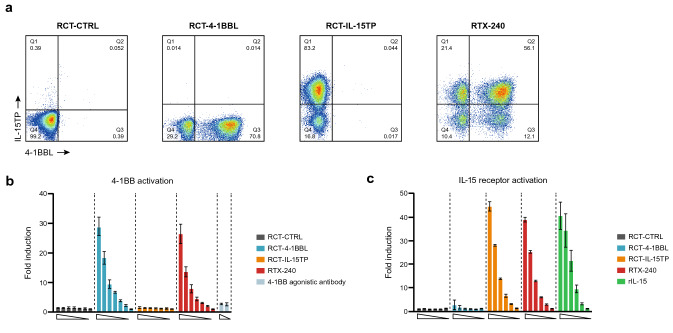
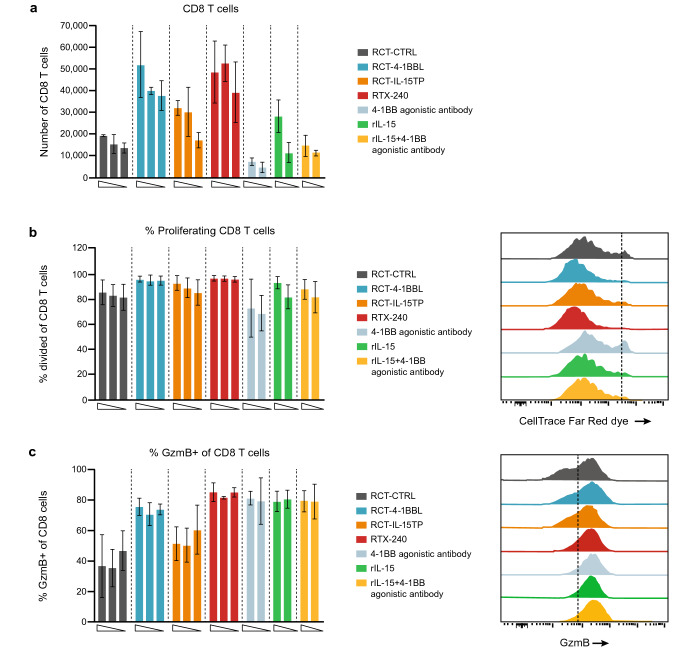
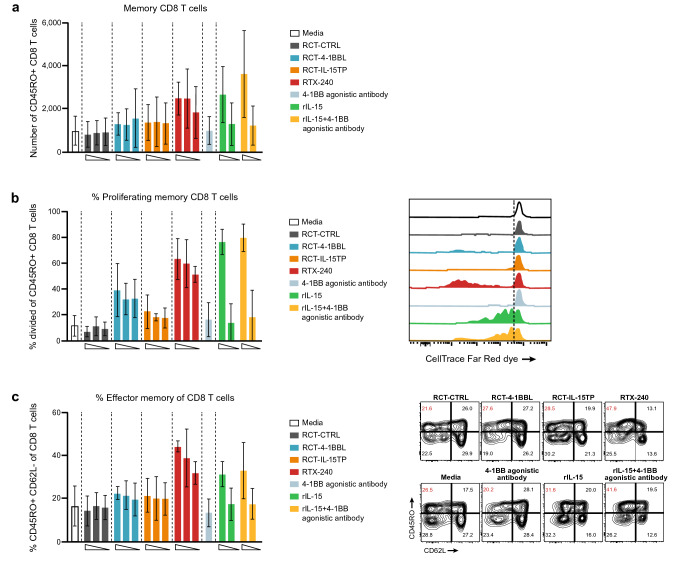
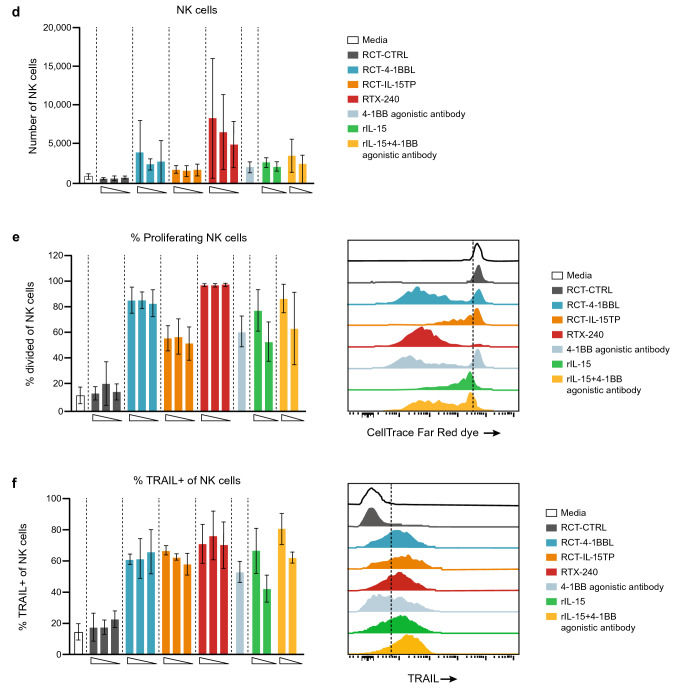
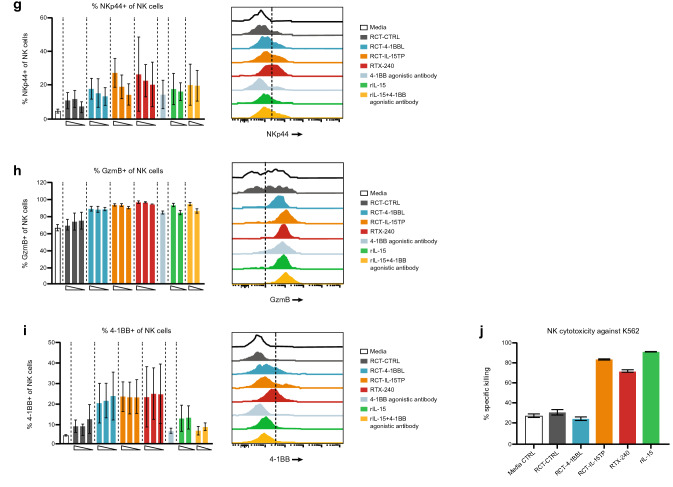
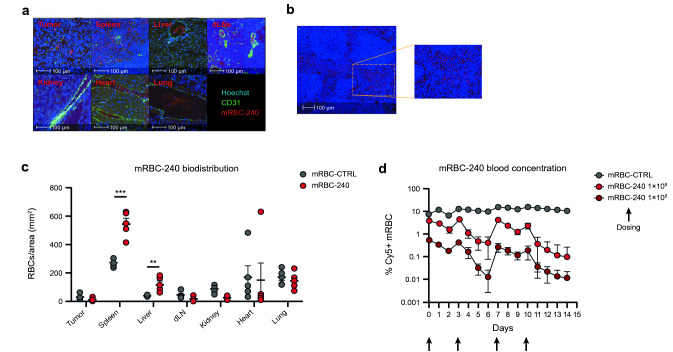
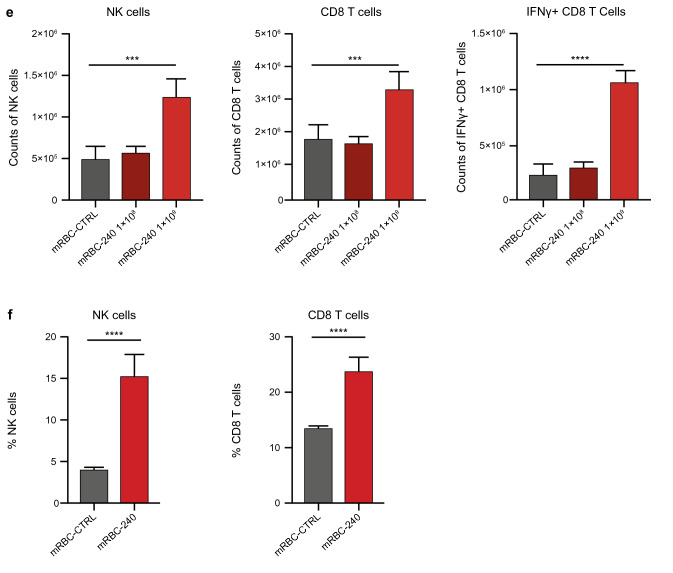
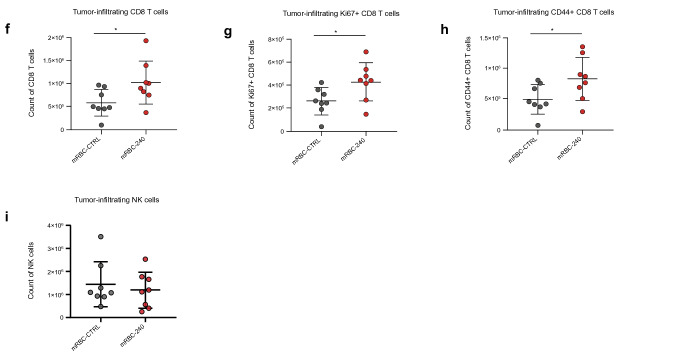
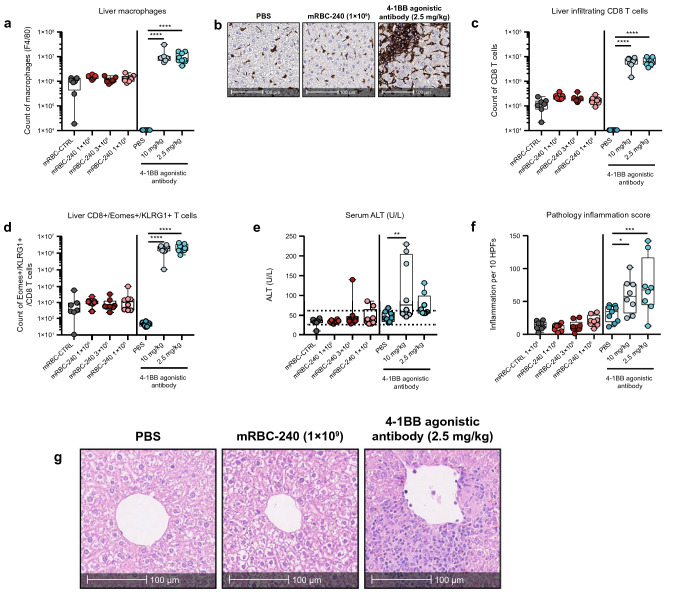
Recombinant agonists that activate co-stimulatory and cytokine receptors have shown limited clinical anticancer utility, potentially due to narrow therapeutic windows, the need for coordinated activation of co-stimulatory and cytokine pathways and the failure of agonistic antibodies to recapitulate signaling by endogenous ligands. RTX-240 is a genetically engineered red blood cell expressing 4-1BBL and IL-15/IL-15Rα fusion (IL-15TP). RTX-240 is designed to potently and simultaneously stimulate the 4-1BB and IL-15 pathways, thereby activating and expanding T cells and NK cells, while potentially offering an improved safety profile through restricted biodistribution. We assessed the ability of RTX-240 to expand and activate T cells and NK cells and evaluated the in vivo efficacy, pharmacodynamics and tolerability using murine models. Treatment of PBMCs with RTX-240 induced T cell and NK cell activation and proliferation. In vivo studies using mRBC-240, a mouse surrogate for RTX-240, revealed biodistribution predominantly to the red pulp of the spleen, leading to CD8 + T cell and NK cell expansion. mRBC-240 was efficacious in a B16-F10 melanoma model and led to increased NK cell infiltration into the lungs. mRBC-240 significantly inhibited CT26 tumor growth, in association with an increase in tumor-infiltrating proliferating and cytotoxic CD8 + T cells. mRBC-240 was tolerated and showed no evidence of hepatic injury at the highest feasible dose, compared with a 4-1BB agonistic antibody. RTX-240 promotes T cell and NK cell activity in preclinical models and shows efficacy and an improved safety profile. Based on these data, RTX-240 is now being evaluated in a clinical trial.

Keywords: CD8-Positive T-Lymphocytes; Cell engineering; Immunotherapy; Investigational therapies; Natural killer cells.


Figures

Fig. 1
Fig. 1
4-1BBL and IL-15TP on RTX-240 stimulate receptor-specific activation in reporter cells. a Representative flow cytometry plots of RTX-240 stained for 4-1BBL and IL-15TP. b Fold change in NFkB activation in 4-1BB/NFkB reporter HEK293 cells incubated with engineered RBCs or 4-1BB agonistic antibody + cross-linking antibody (10 nM and 1 nM agonist with 25 nM and 2.5 nM cross-linker, respectively) compared with media alone. c Fold change in JAK/STAT activation by IL-15 in reporter HEK-Blue-IL-2 cells incubated with engineered RBCs or recombinant (r) IL-15 (threefold dilutions from 100 pg/mL), compared with media alone. Bars indicate SD of 2–3 technical replicates. IL-15TP, trans-presented interleukin 15; RBC, red blood cell; SD, standard deviation
Fig. 2
Fig. 2
Co-stimulation of human T cells in vitro. PBMCs were labeled with CTFR and incubated with anti-CD3 (0.5 μg/mL) and the indicated treatments for 5 days, then analyzed by flow cytometry for: a CD8 + T cell number, b CD8 + T cell proliferation (percentage of cells that went through at least one division) and Granzyme B expression on CD8 + T cells c. Bars indicate SD of 3 biological replicates. Flow plots are representative data from one donor. CTFR, CellTrace Far Red dye; GzmB, Granzyme B; IL-15TP, trans-presented interleukin 15; PBMC, peripheral blood mononuclear cell; rIL-15, recombinant IL-15; SD, standard deviation
Fig. 3
Fig. 3
Direct activation of CD8 + T cells and NK cells in vitro. (ai) PBMCs were labeled with CTFR and incubated with the indicated treatments for 8 days, then analyzed by flow cytometry for: a memory CD8 + T cell numbers; b memory CD8 + T cell proliferation (percentage of cells that went through at least one division); c CD8 + effector memory differentiation; d NK cell numbers; e NK cell proliferation (percentage of cells that went through at least one division); fi expression of the following molecules on NK cells: f TRAIL, g NKp44, h Granzyme B and i 4-1BB. j Purified NK cells were incubated in vitro overnight with the indicated treatments, then incubated with labeled K562 target cells for 4 h. Target cell killing was measured by flow cytometry. Bars indicate ai SD of 3 biological replicates j or SD of 3 technical replicates. Flow plots are representative data from one donor. CTFR, CellTrace Far Red dye; GzmB, Granzyme B; IL-15TP, trans-presented interleukin-15; NK, natural killer; PBMC, peripheral blood mononuclear cell; rIL-15, recombinant IL-15; SD, standard deviation
Fig. 3
Fig. 3
Direct activation of CD8 + T cells and NK cells in vitro. (ai) PBMCs were labeled with CTFR and incubated with the indicated treatments for 8 days, then analyzed by flow cytometry for: a memory CD8 + T cell numbers; b memory CD8 + T cell proliferation (percentage of cells that went through at least one division); c CD8 + effector memory differentiation; d NK cell numbers; e NK cell proliferation (percentage of cells that went through at least one division); fi expression of the following molecules on NK cells: f TRAIL, g NKp44, h Granzyme B and i 4-1BB. j Purified NK cells were incubated in vitro overnight with the indicated treatments, then incubated with labeled K562 target cells for 4 h. Target cell killing was measured by flow cytometry. Bars indicate ai SD of 3 biological replicates j or SD of 3 technical replicates. Flow plots are representative data from one donor. CTFR, CellTrace Far Red dye; GzmB, Granzyme B; IL-15TP, trans-presented interleukin-15; NK, natural killer; PBMC, peripheral blood mononuclear cell; rIL-15, recombinant IL-15; SD, standard deviation
Fig. 4
Fig. 4
mRBC-240 biodistribution, PK and PD. a Representative images of mRBC-240 in different tissues (tumor, spleen, liver, draining lymph nodes, lung, kidney, and heart). mRBC-240 cells were labeled with CTFR prior to injection (red channel). Blood vessels were identified by CD31 staining (green channel) and nucleated cells were detected using Hoechst staining (blue channel). b Representative images of mRBC-240 in the red pulp of the spleen. c mRBC-240 biodistribution: quantification of the density (cells per mm2) of mRBC-240 and mRBC-CTRL in different organs 24 h following a single IV dose (n = 5). Data presented ± SEM **p < 0.01, ***p < 0.001, comparing mRBC-240 versus mRBC-CTRL. All comparisons were analyzed by t test. d PK of mRBC-240: concentration of mRBC-240 in the blood was assessed. Blood was collected 4 h post the first dose and each day thereafter and the percentage of Cy5-labeled mRBC-CTRL (1 × 109) or mRBC-240 (1 × 109 or 1 × 108) in circulation was assessed by flow cytometry (n = 4 mice per group). e PD of mRBC-240 in the spleen of non-tumor-bearing mice: counts of total NK cells, CD8 + T cells and IFNγ + CD8 + T cells were analyzed by flow cytometry in the spleen on day 14 (n = 4 mice per group). f PD of mRBC-240 in the spleen of tumor-bearing mice (B16-F10): frequencies of NK cells and CD8 + T cells were analyzed by flow cytometry in the spleen on day 12 (n = 5 mice per group). Bars indicate SD of biological replicates. Comparisons were analyzed by a one-way ANOVA or unpaired T test and compared with mRBC-CTRL group and showing as **p < 0.01, ***p < 0.001, ****p < 0.0001. CTFR, CellTrace Far Red dye; IFNγ, interferon-γ; IV, intravenous; mRBC, mouse red blood cell; NK, natural killer; PD, pharmacodynamics; PK, pharmacokinetics; SD, standard deviation; SEM, standard error of the mean
Fig. 4
Fig. 4
mRBC-240 biodistribution, PK and PD. a Representative images of mRBC-240 in different tissues (tumor, spleen, liver, draining lymph nodes, lung, kidney, and heart). mRBC-240 cells were labeled with CTFR prior to injection (red channel). Blood vessels were identified by CD31 staining (green channel) and nucleated cells were detected using Hoechst staining (blue channel). b Representative images of mRBC-240 in the red pulp of the spleen. c mRBC-240 biodistribution: quantification of the density (cells per mm2) of mRBC-240 and mRBC-CTRL in different organs 24 h following a single IV dose (n = 5). Data presented ± SEM **p < 0.01, ***p < 0.001, comparing mRBC-240 versus mRBC-CTRL. All comparisons were analyzed by t test. d PK of mRBC-240: concentration of mRBC-240 in the blood was assessed. Blood was collected 4 h post the first dose and each day thereafter and the percentage of Cy5-labeled mRBC-CTRL (1 × 109) or mRBC-240 (1 × 109 or 1 × 108) in circulation was assessed by flow cytometry (n = 4 mice per group). e PD of mRBC-240 in the spleen of non-tumor-bearing mice: counts of total NK cells, CD8 + T cells and IFNγ + CD8 + T cells were analyzed by flow cytometry in the spleen on day 14 (n = 4 mice per group). f PD of mRBC-240 in the spleen of tumor-bearing mice (B16-F10): frequencies of NK cells and CD8 + T cells were analyzed by flow cytometry in the spleen on day 12 (n = 5 mice per group). Bars indicate SD of biological replicates. Comparisons were analyzed by a one-way ANOVA or unpaired T test and compared with mRBC-CTRL group and showing as **p < 0.01, ***p < 0.001, ****p < 0.0001. CTFR, CellTrace Far Red dye; IFNγ, interferon-γ; IV, intravenous; mRBC, mouse red blood cell; NK, natural killer; PD, pharmacodynamics; PK, pharmacokinetics; SD, standard deviation; SEM, standard error of the mean
Fig. 5
Fig. 5
mRBC-240 promotes tumor control in B16-F10 and CT26 models. a Lung metastases enumeration in C57BL/6 mice inoculated IV with B16-F10 tumor cells. Analysis performed on day 14 (n = 8 mice/group). The frequency of b NK cells (NK1.1 +) and c terminally differentiated NK cells (NK1.1 + CD11b + CD27-KLRG1 +) and d CD8 + T cells in the lung were analyzed by flow cytometry. Data presented ± SD and comparisons analyzed by one-way ANOVA *p < 0.05, **p < 0.01, ***p < 0.001, ****p < 0.0001. e Tumor growth curves for CT26 tumor model in BALB/c mice. Data presented ± SEM ****p < 0.0001, comparisons were analyzed by two-way ANOVA. The numbers of f tumor-infiltrating CD8 + T cells, g proliferating (Ki67 +) CD8 + T cells and h activated (CD44 +) CD8 + T cells as well as i tumor-infiltrating NK cells were analyzed by flow cytometry on day 11 (n = 8 mice per group). Data presented ± SD *p < 0.05. Comparisons were analyzed by unpaired T test. IL-15TP, trans-presented interleukin 15; IV, intravenous; mRBC, mouse red blood cell; NK, natural killer; rIL-15, recombinant IL-15; SD, standard deviation; SEM, standard error of the mean
Fig. 5
Fig. 5
mRBC-240 promotes tumor control in B16-F10 and CT26 models. a Lung metastases enumeration in C57BL/6 mice inoculated IV with B16-F10 tumor cells. Analysis performed on day 14 (n = 8 mice/group). The frequency of b NK cells (NK1.1 +) and c terminally differentiated NK cells (NK1.1 + CD11b + CD27-KLRG1 +) and d CD8 + T cells in the lung were analyzed by flow cytometry. Data presented ± SD and comparisons analyzed by one-way ANOVA *p < 0.05, **p < 0.01, ***p < 0.001, ****p < 0.0001. e Tumor growth curves for CT26 tumor model in BALB/c mice. Data presented ± SEM ****p < 0.0001, comparisons were analyzed by two-way ANOVA. The numbers of f tumor-infiltrating CD8 + T cells, g proliferating (Ki67 +) CD8 + T cells and h activated (CD44 +) CD8 + T cells as well as i tumor-infiltrating NK cells were analyzed by flow cytometry on day 11 (n = 8 mice per group). Data presented ± SD *p < 0.05. Comparisons were analyzed by unpaired T test. IL-15TP, trans-presented interleukin 15; IV, intravenous; mRBC, mouse red blood cell; NK, natural killer; rIL-15, recombinant IL-15; SD, standard deviation; SEM, standard error of the mean
Fig. 6
Fig. 6
mRBC-240 is tolerated in mice. a Quantification of liver macrophages (F4/80 +). b Representative images of IHC staining of macrophages (F4/80) from selected mice. c Quantification of liver-infiltrating CD8 + T cells and d liver-infiltrating cytotoxic CD8 + T cells (CD8 + /Eomes + /KLRG1 +). Quantification was performed on liver samples of C57BL/6 wild-type mice by flow cytometry on day 18 following 4 doses of either mRBC-240 (1 × 109, 3 × 108, or 1 × 108), mRBC-CTRL, 4-1BB agonistic antibody (10 mg/kg or 2.5 mg/kg) (n = 8 mice/group) or PBS. e ALT liver enzyme levels (U/L) in serum on day 18. f Inflammation scoring performed on H&E stained liver sections. g Representative images of H&E staining of liver sections from selected mice. All comparisons were analyzed by a one-way ANOVA and compared with control groups and showing as *p < 0.05, **p < 0.01, ***p < 0.001, ****p < 0.0001. ALT, alanine aminotransferase; IHC, immunohistochemistry; H&E, hematoxylin and eosin; mRBC, mouse red blood cell; PBS, phosphate-buffered saline

References

    1. Darvin P, Toor SM, Nair VS, Elkord E. Immune checkpoint inhibitors: recent progress and potential biomarkers. Exp Mol Med. 2018;50:1–11. doi: 10.1038/s12276-018-0191-1. - DOI - PMC - PubMed
    1. Chavez JC, Bachmeier C, Kharfan-Dabaja MA. CAR T-cell therapy for B-cell lymphomas: clinical trial results of available products. Ther Adv Hematol. 2019;10:1–20. doi: 10.1177/2040620719841581. - DOI - PMC - PubMed
    1. Alexander W. The Checkpoint immunotherapy revolution. Pharm Ther. 2016;43:185–191. - PMC - PubMed
    1. Bonifant CL, Jackson HJ, Brentjens RJ, Curran KJ. Toxicity and management in CAR T-cell therapy. Mol Ther. 2016;3:16011. doi: 10.1038/mto.2016.11. - DOI - PMC - PubMed
    1. Li Y, Sun R (2018) Tumor immunotherapy: New aspects of natural killer cells. Chin J Cancer Res 30:173–196. 10.21147/j.issn.1000-9604.2018.02.02 - PMC - PubMed

MeSH terms