. 2021 Oct;529(15):3513-3532.
doi: 10.1002/cne.25208. Epub 2021 Jul 16.

Characterization of Tbr2-expressing retinal ganglion cells

Affiliations

Characterization of Tbr2-expressing retinal ganglion cells

Ching-Kang Chen et al. J Comp Neurol. 2021 Oct.

Abstract

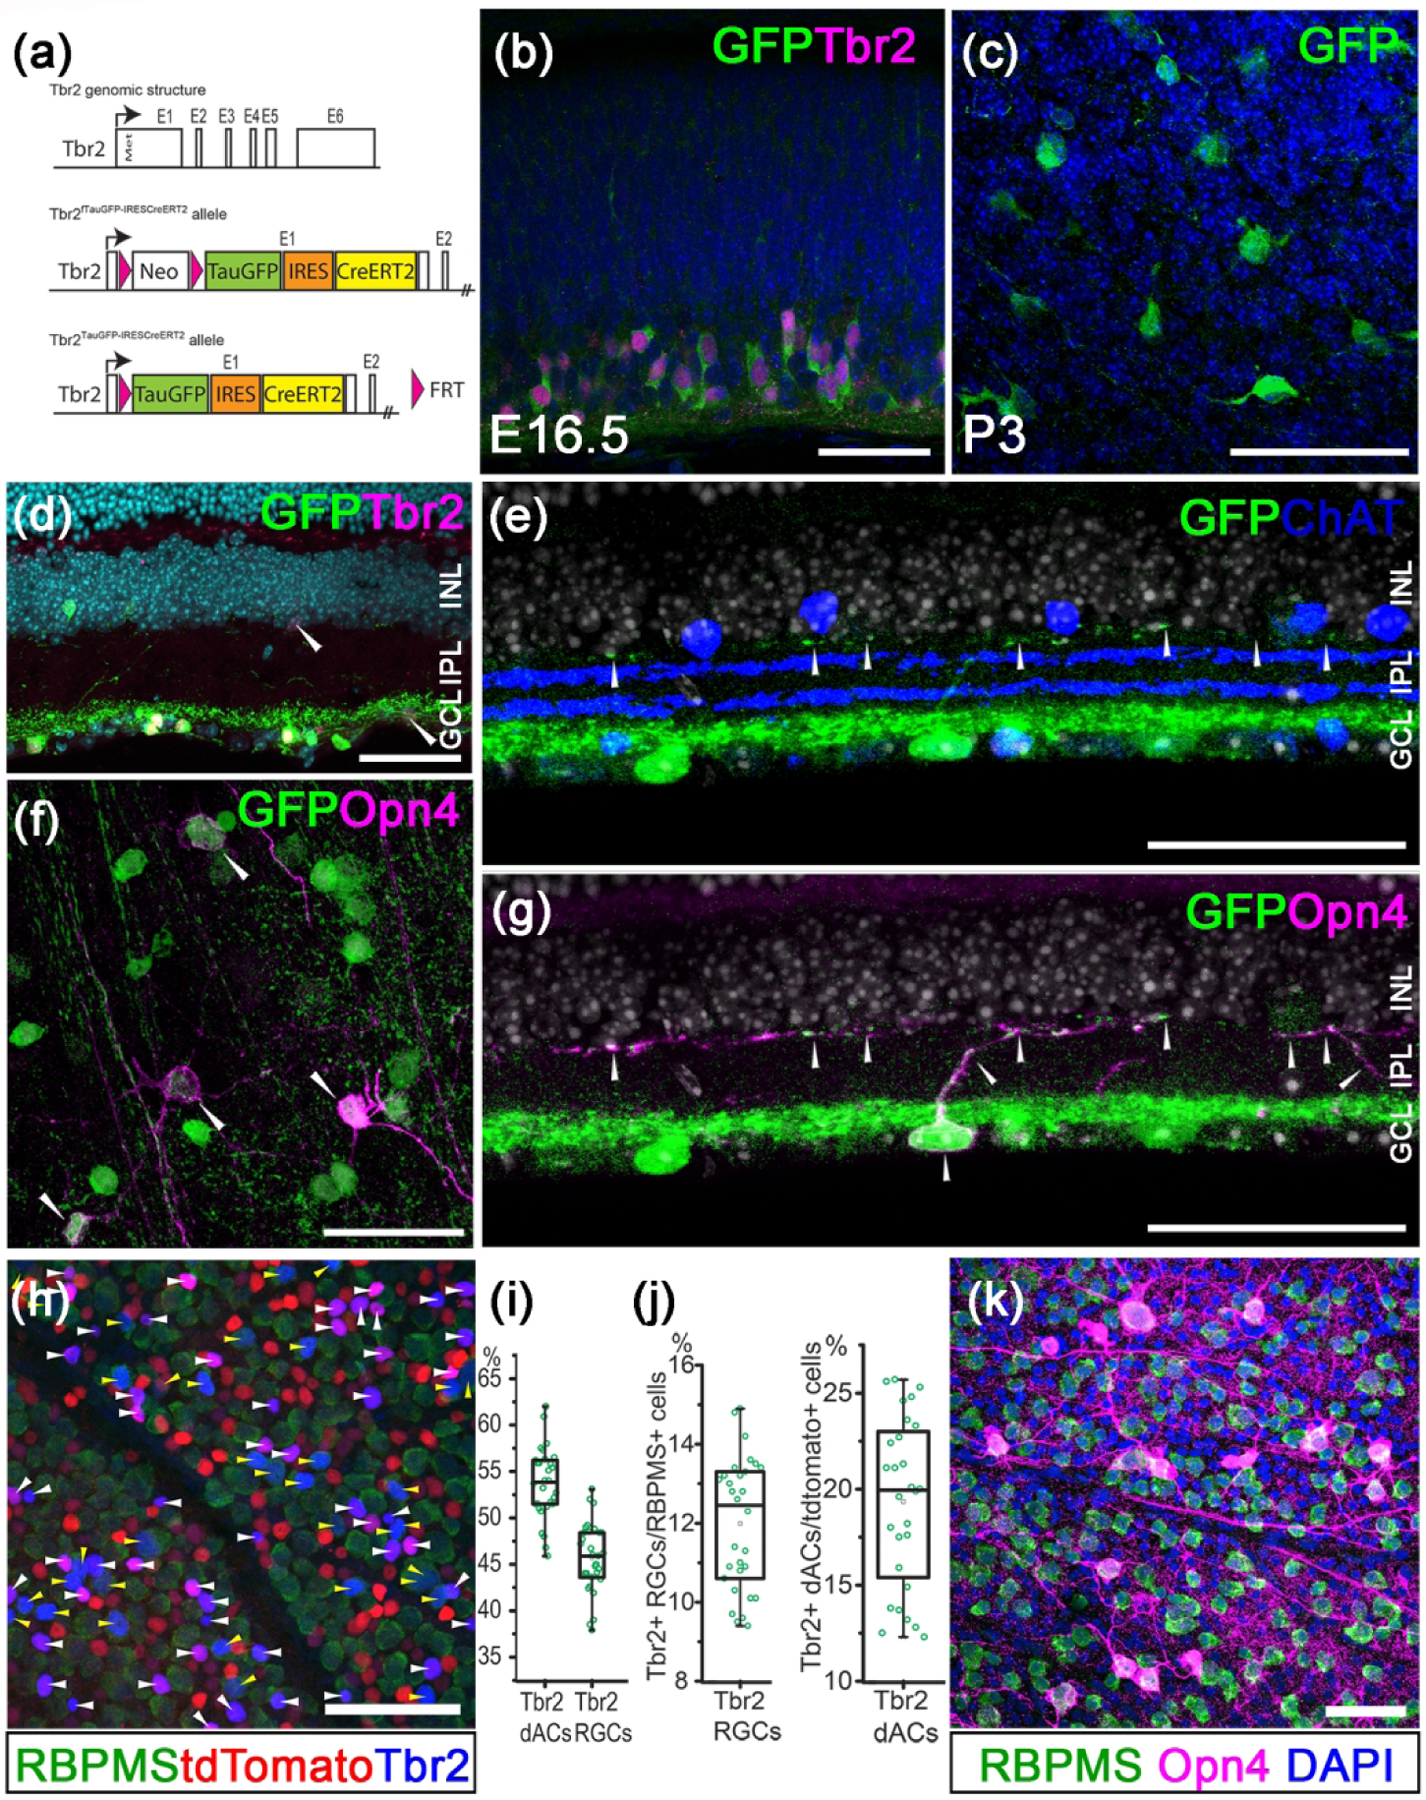
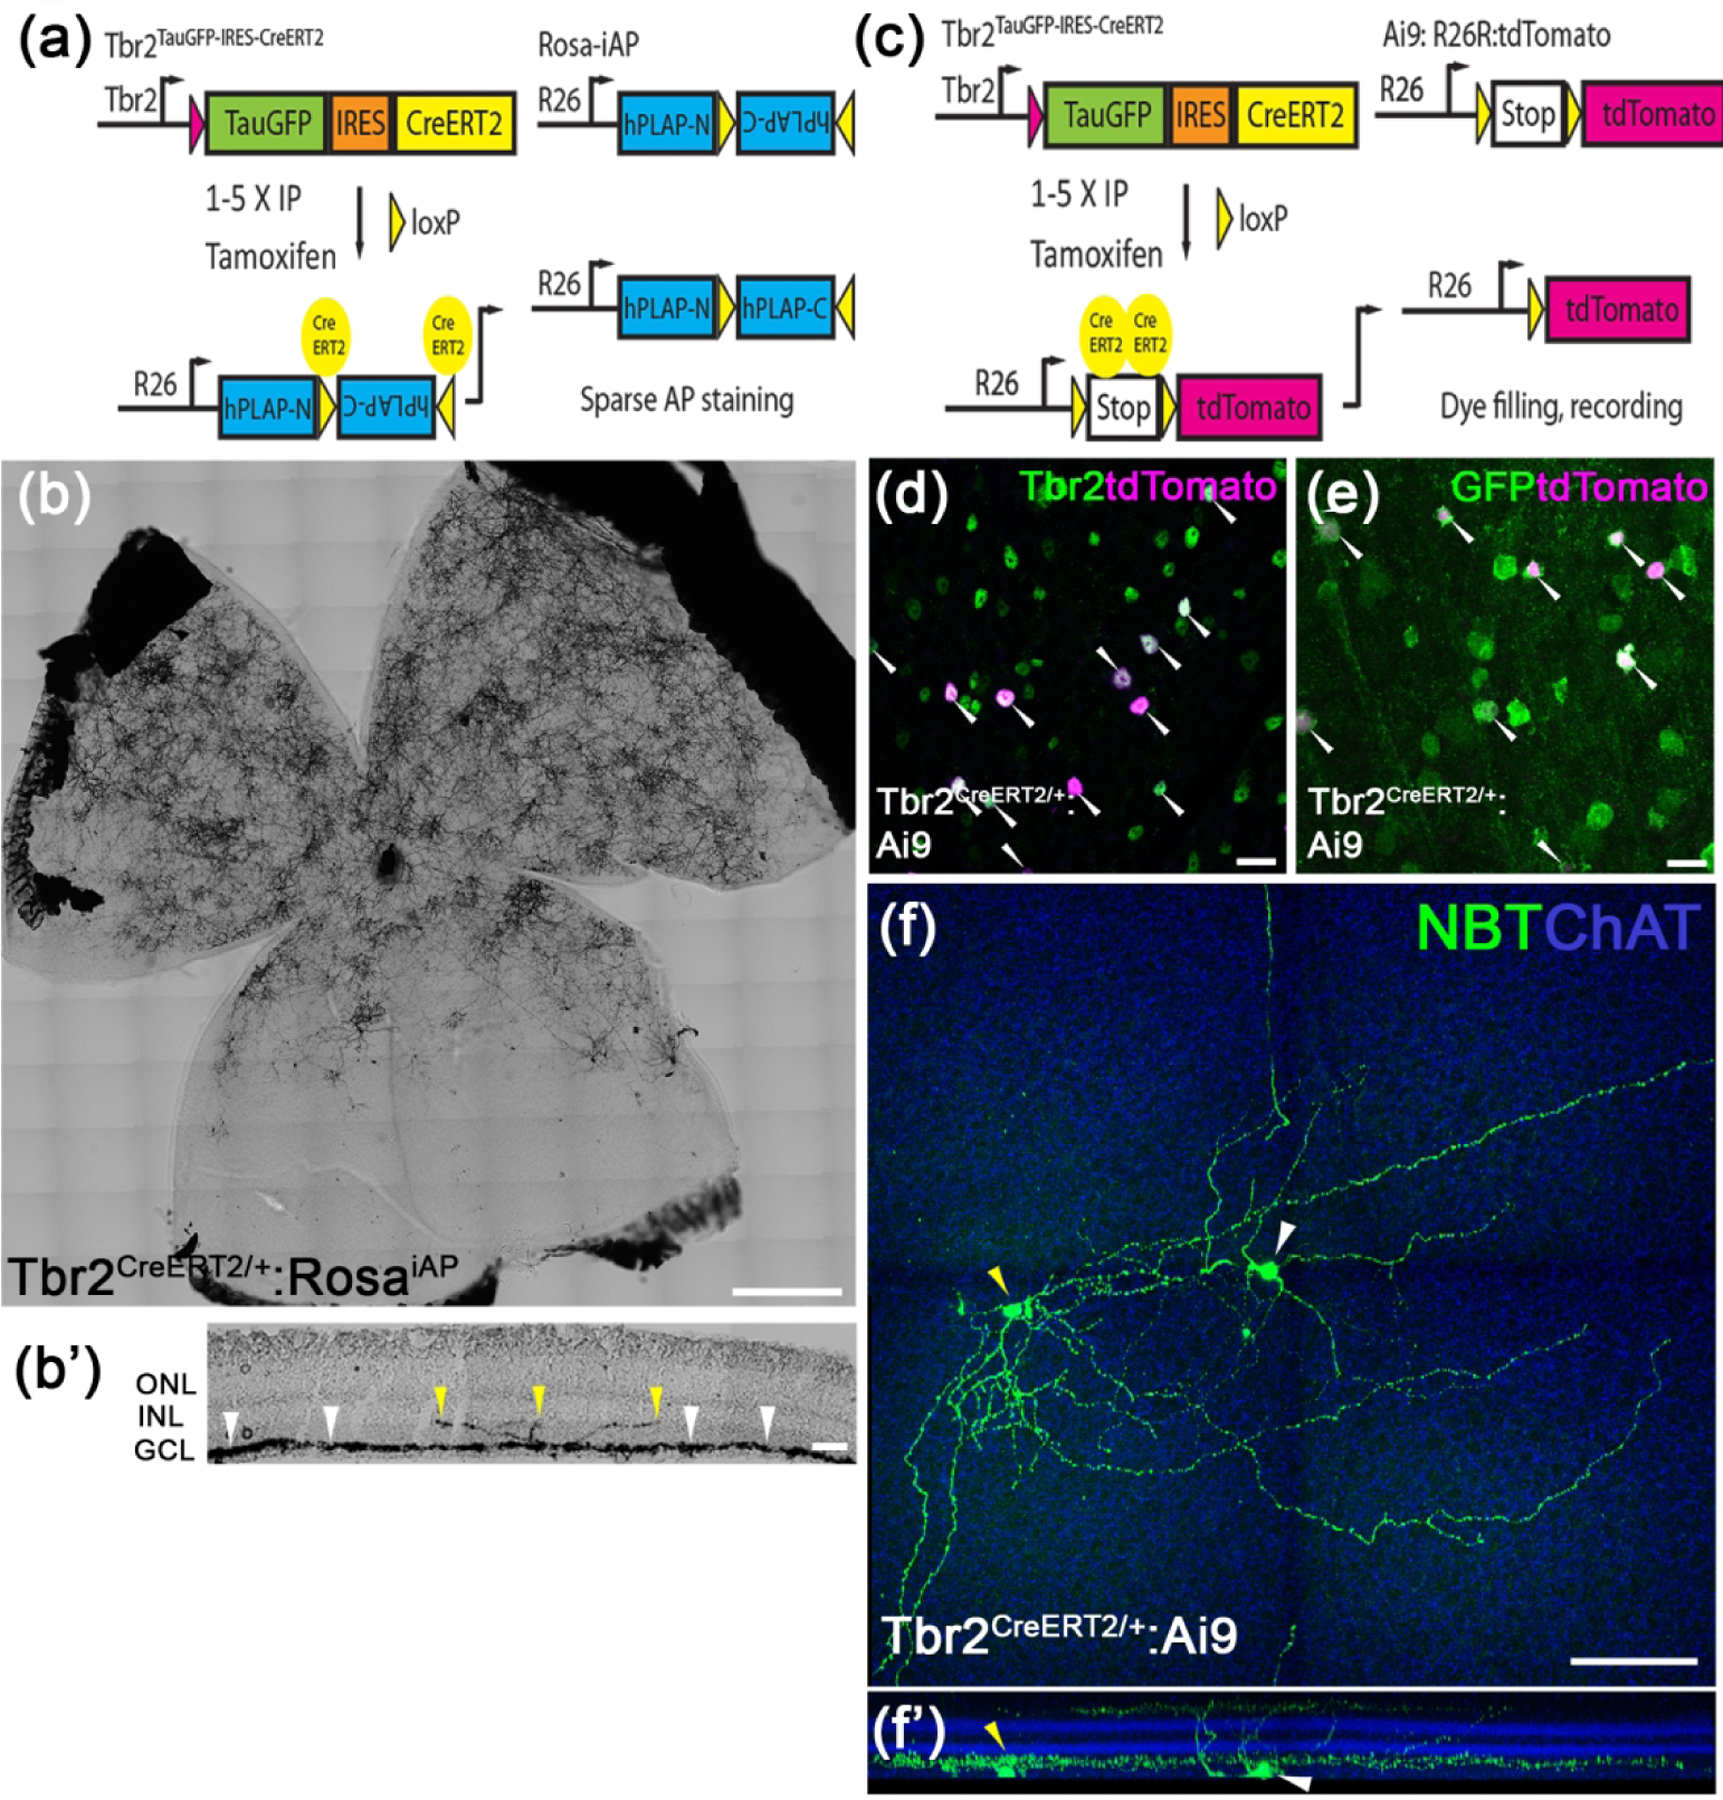
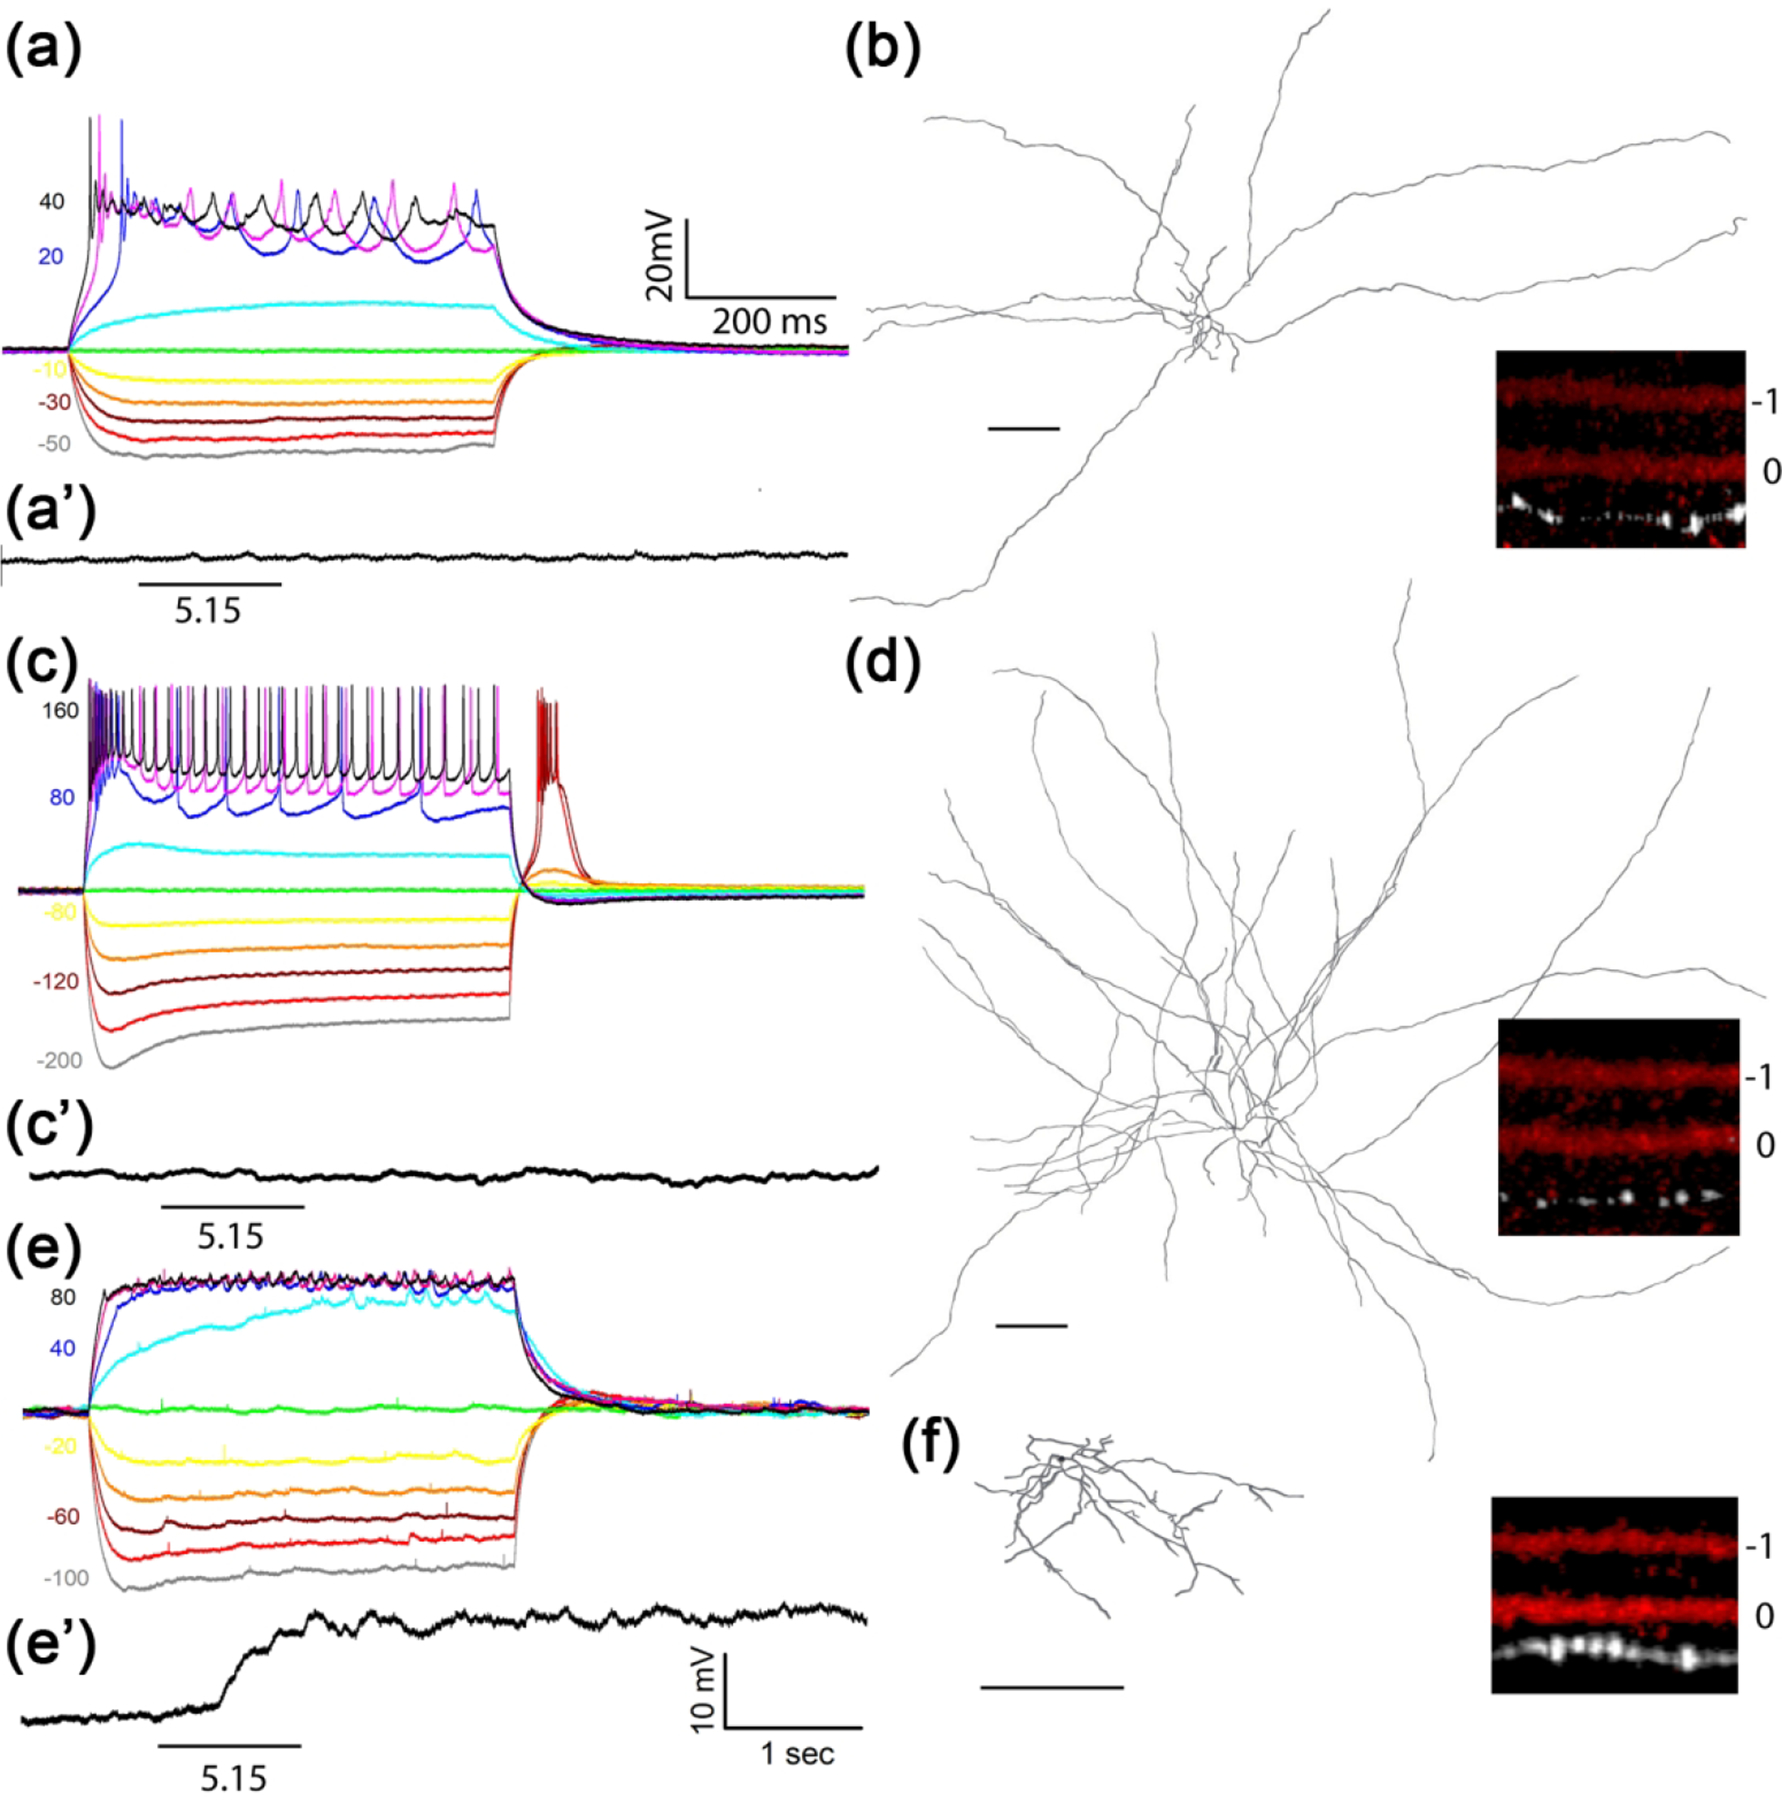
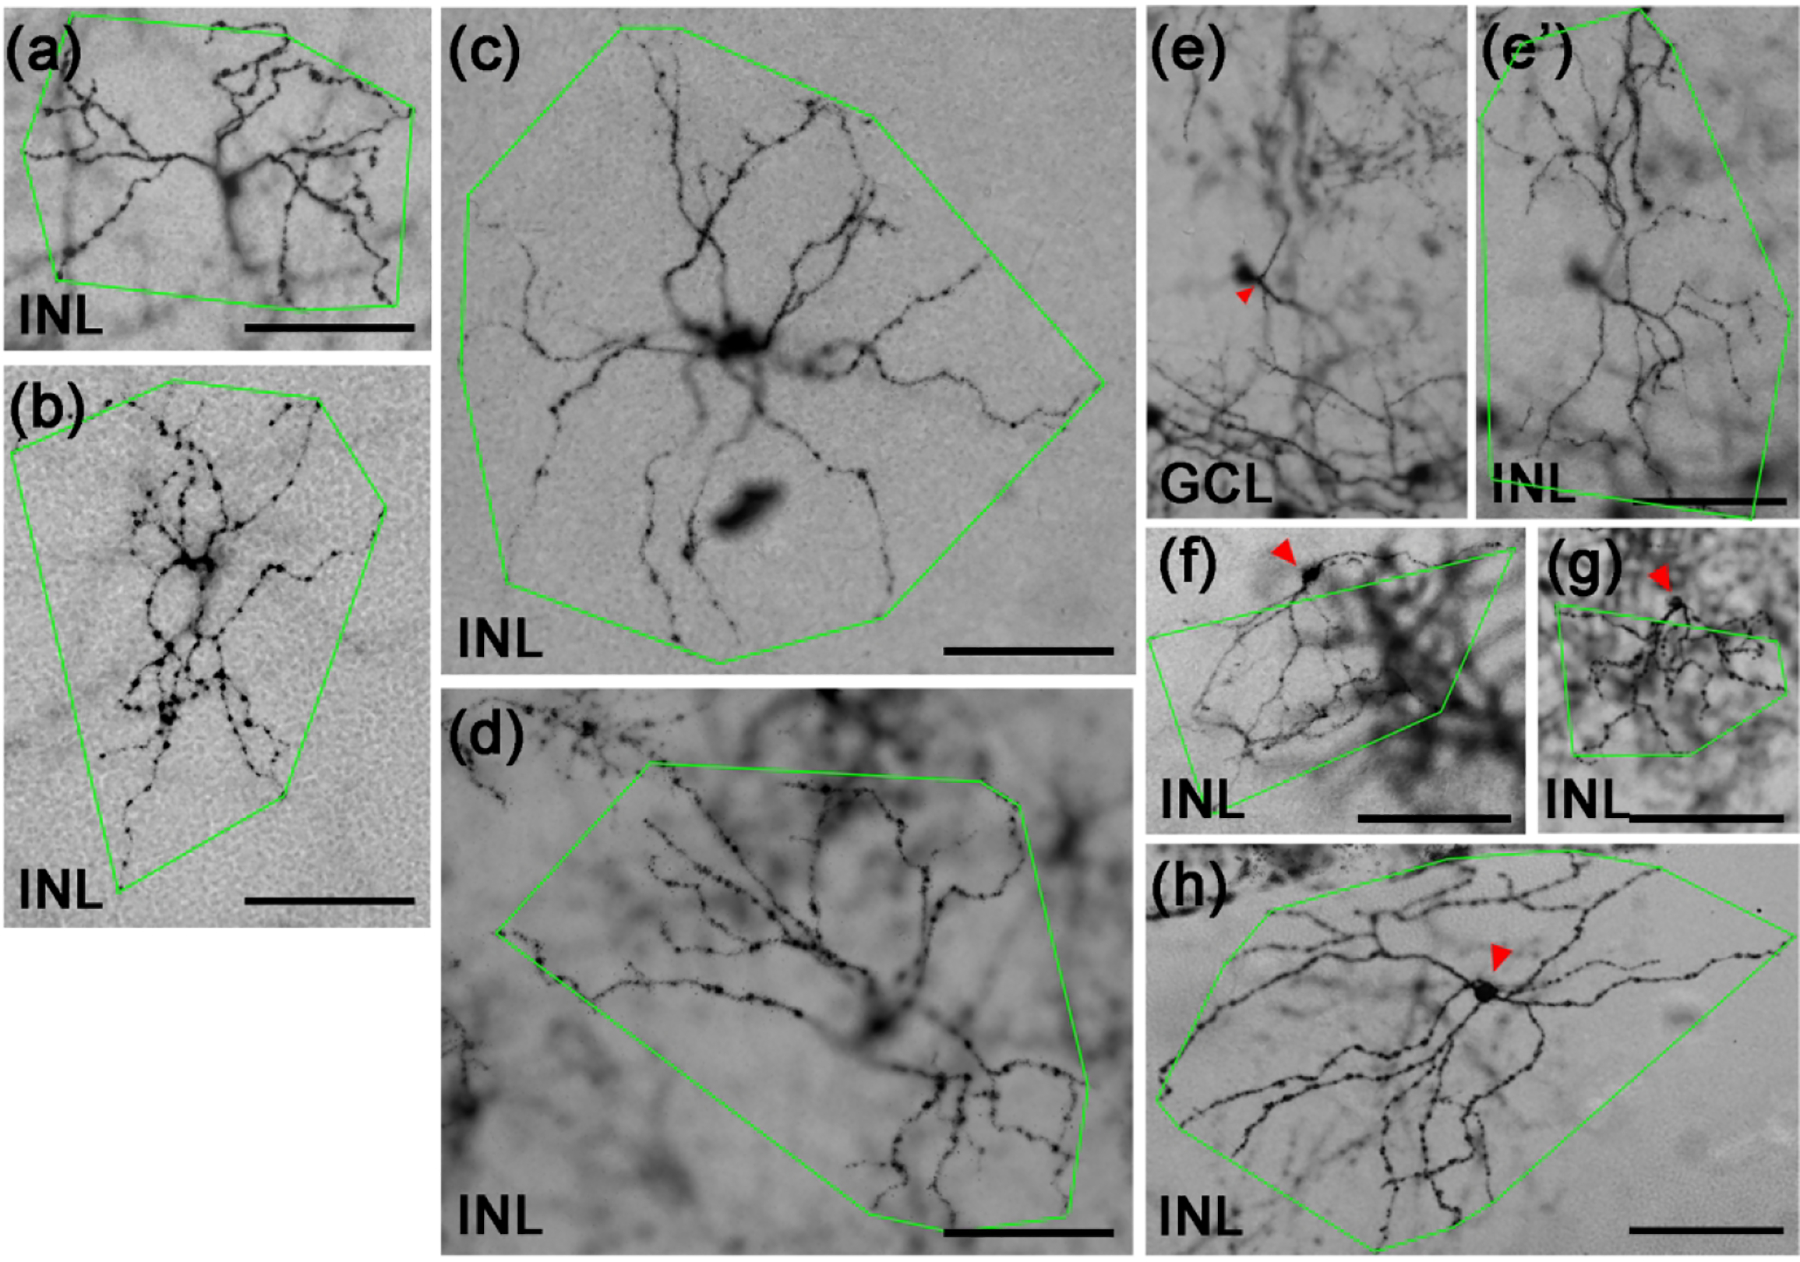
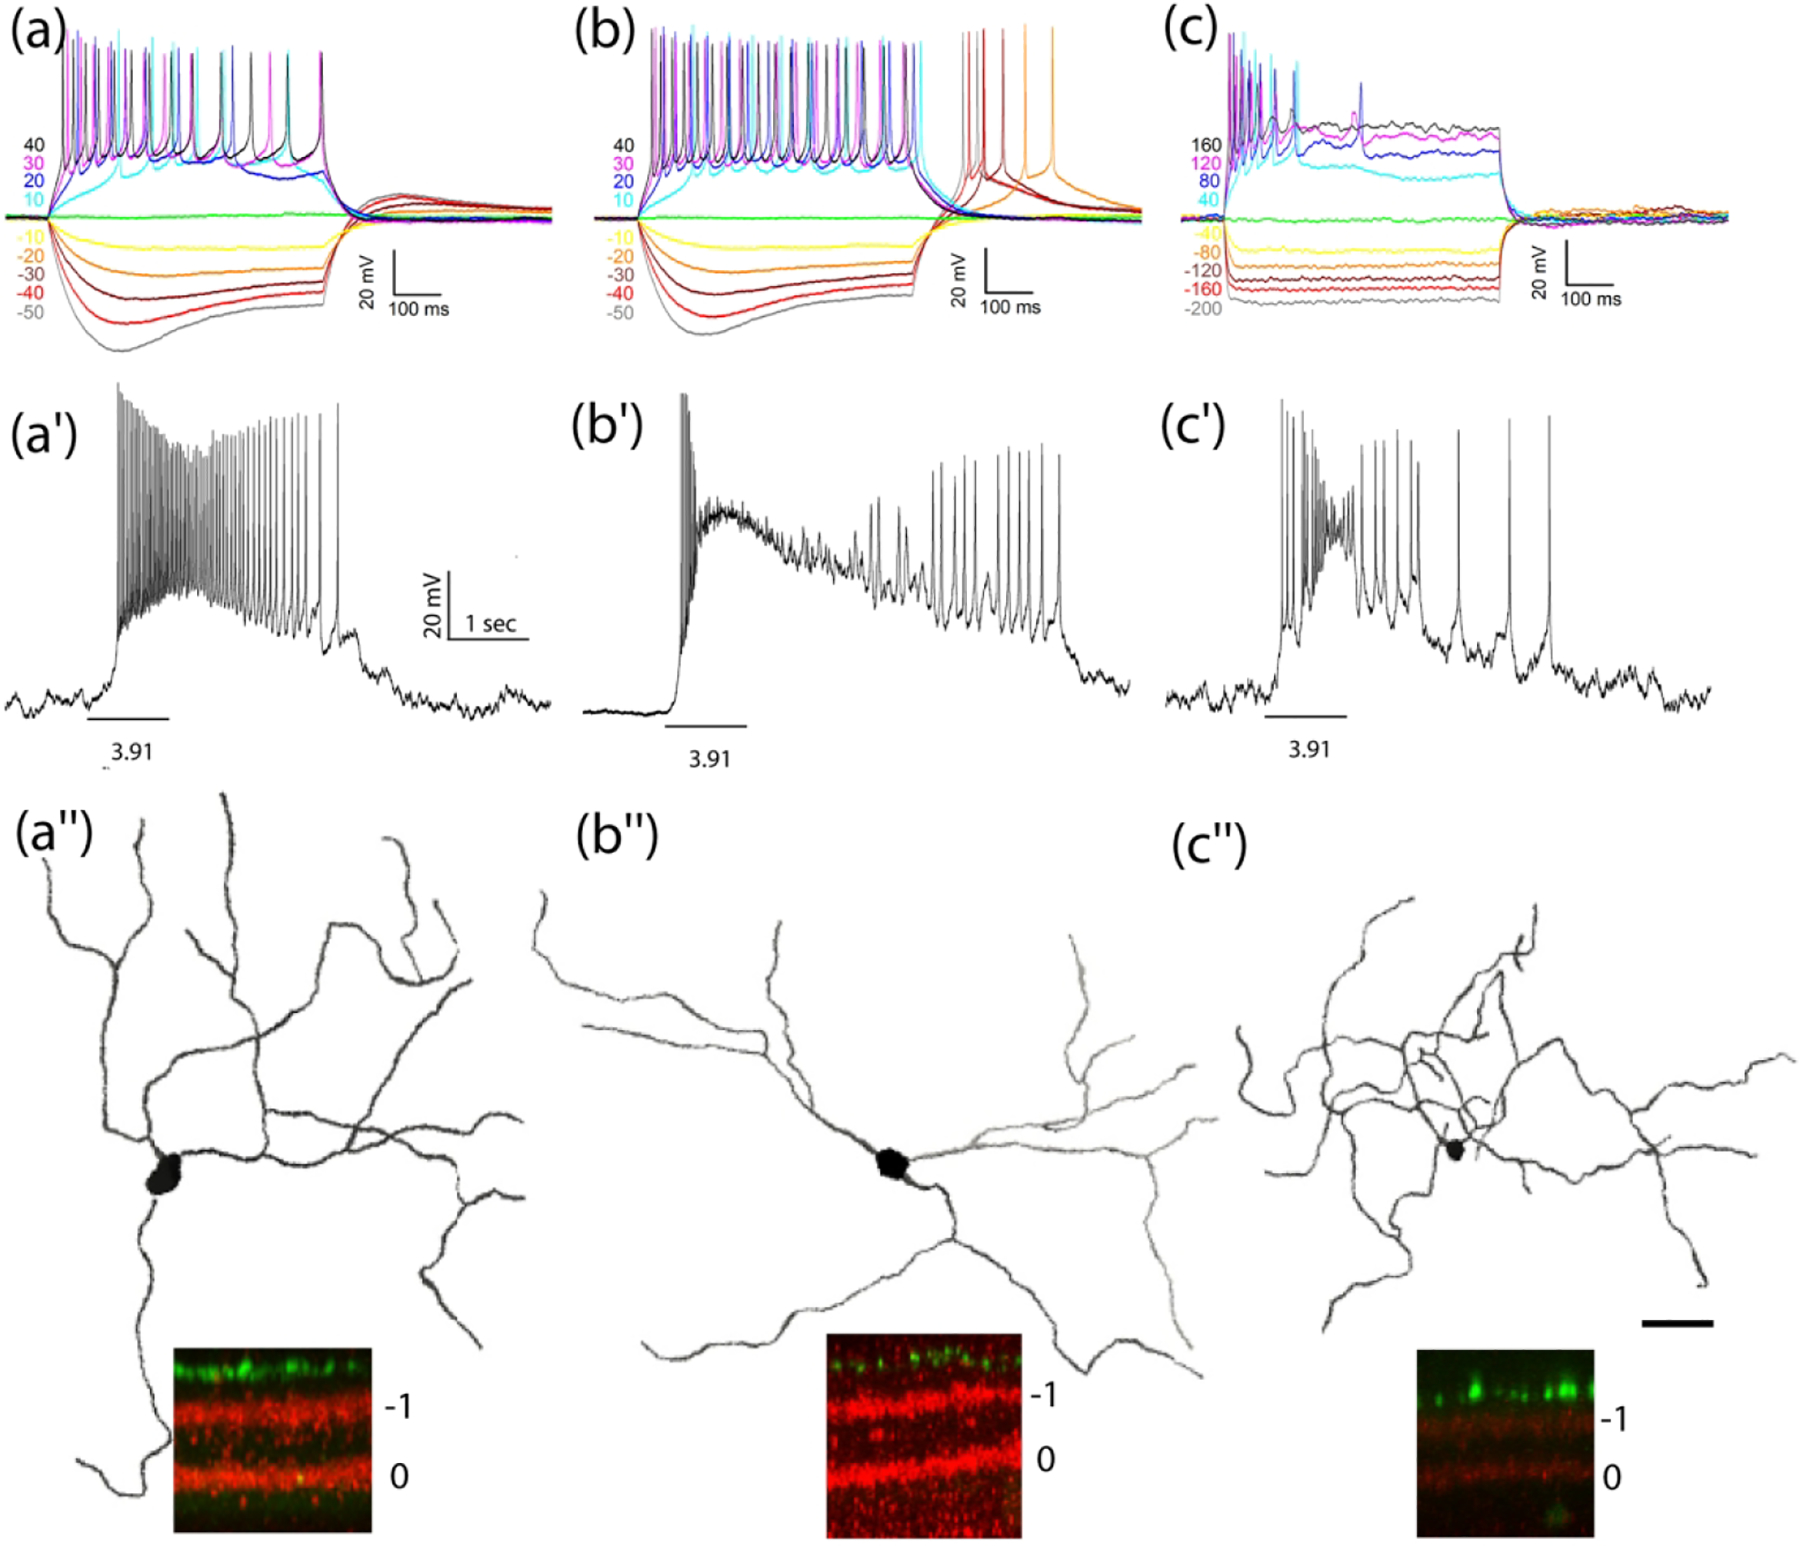
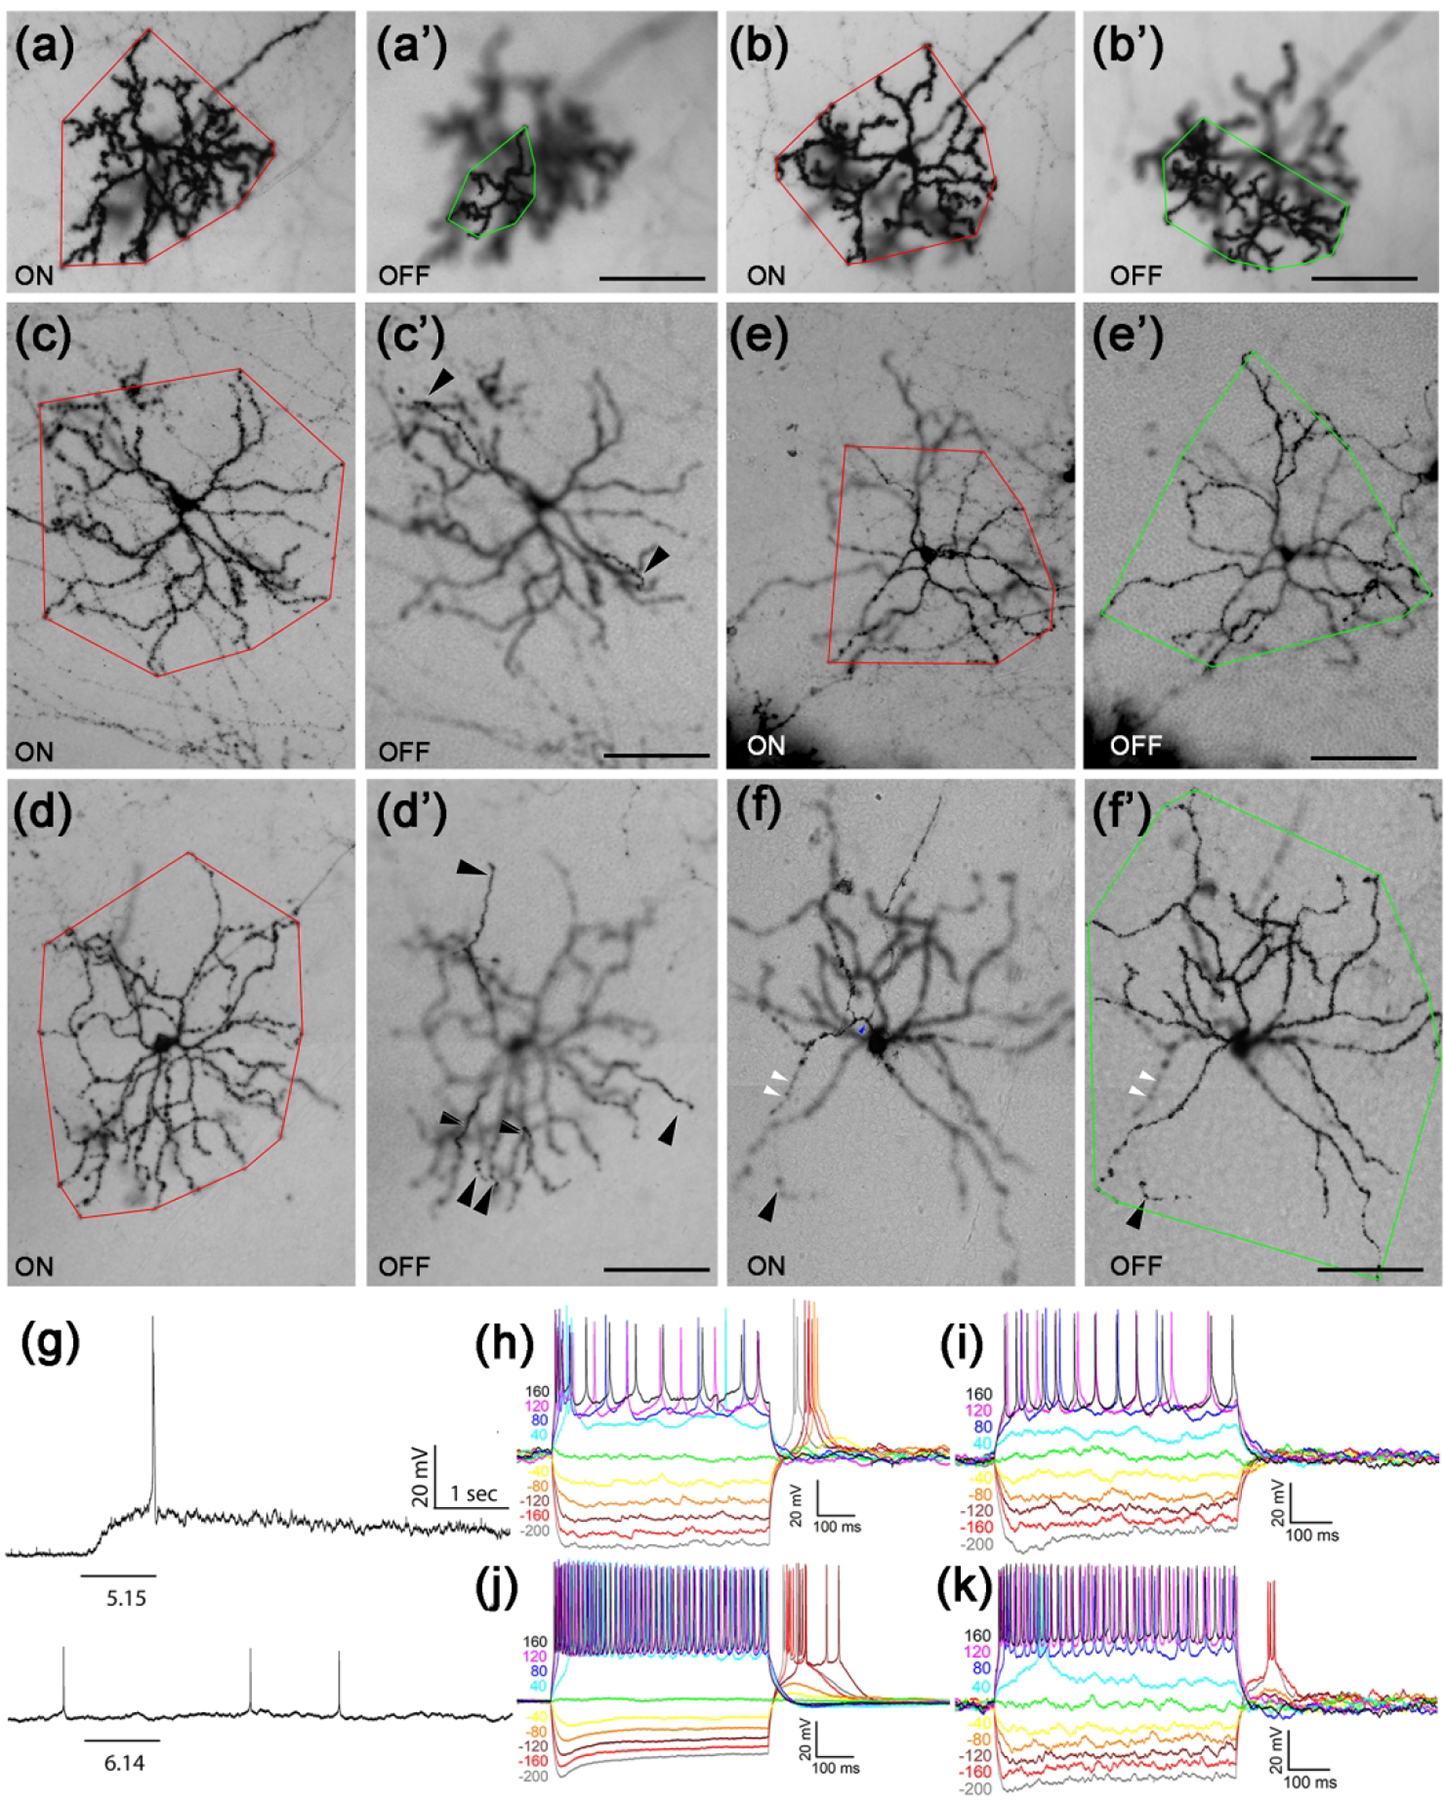
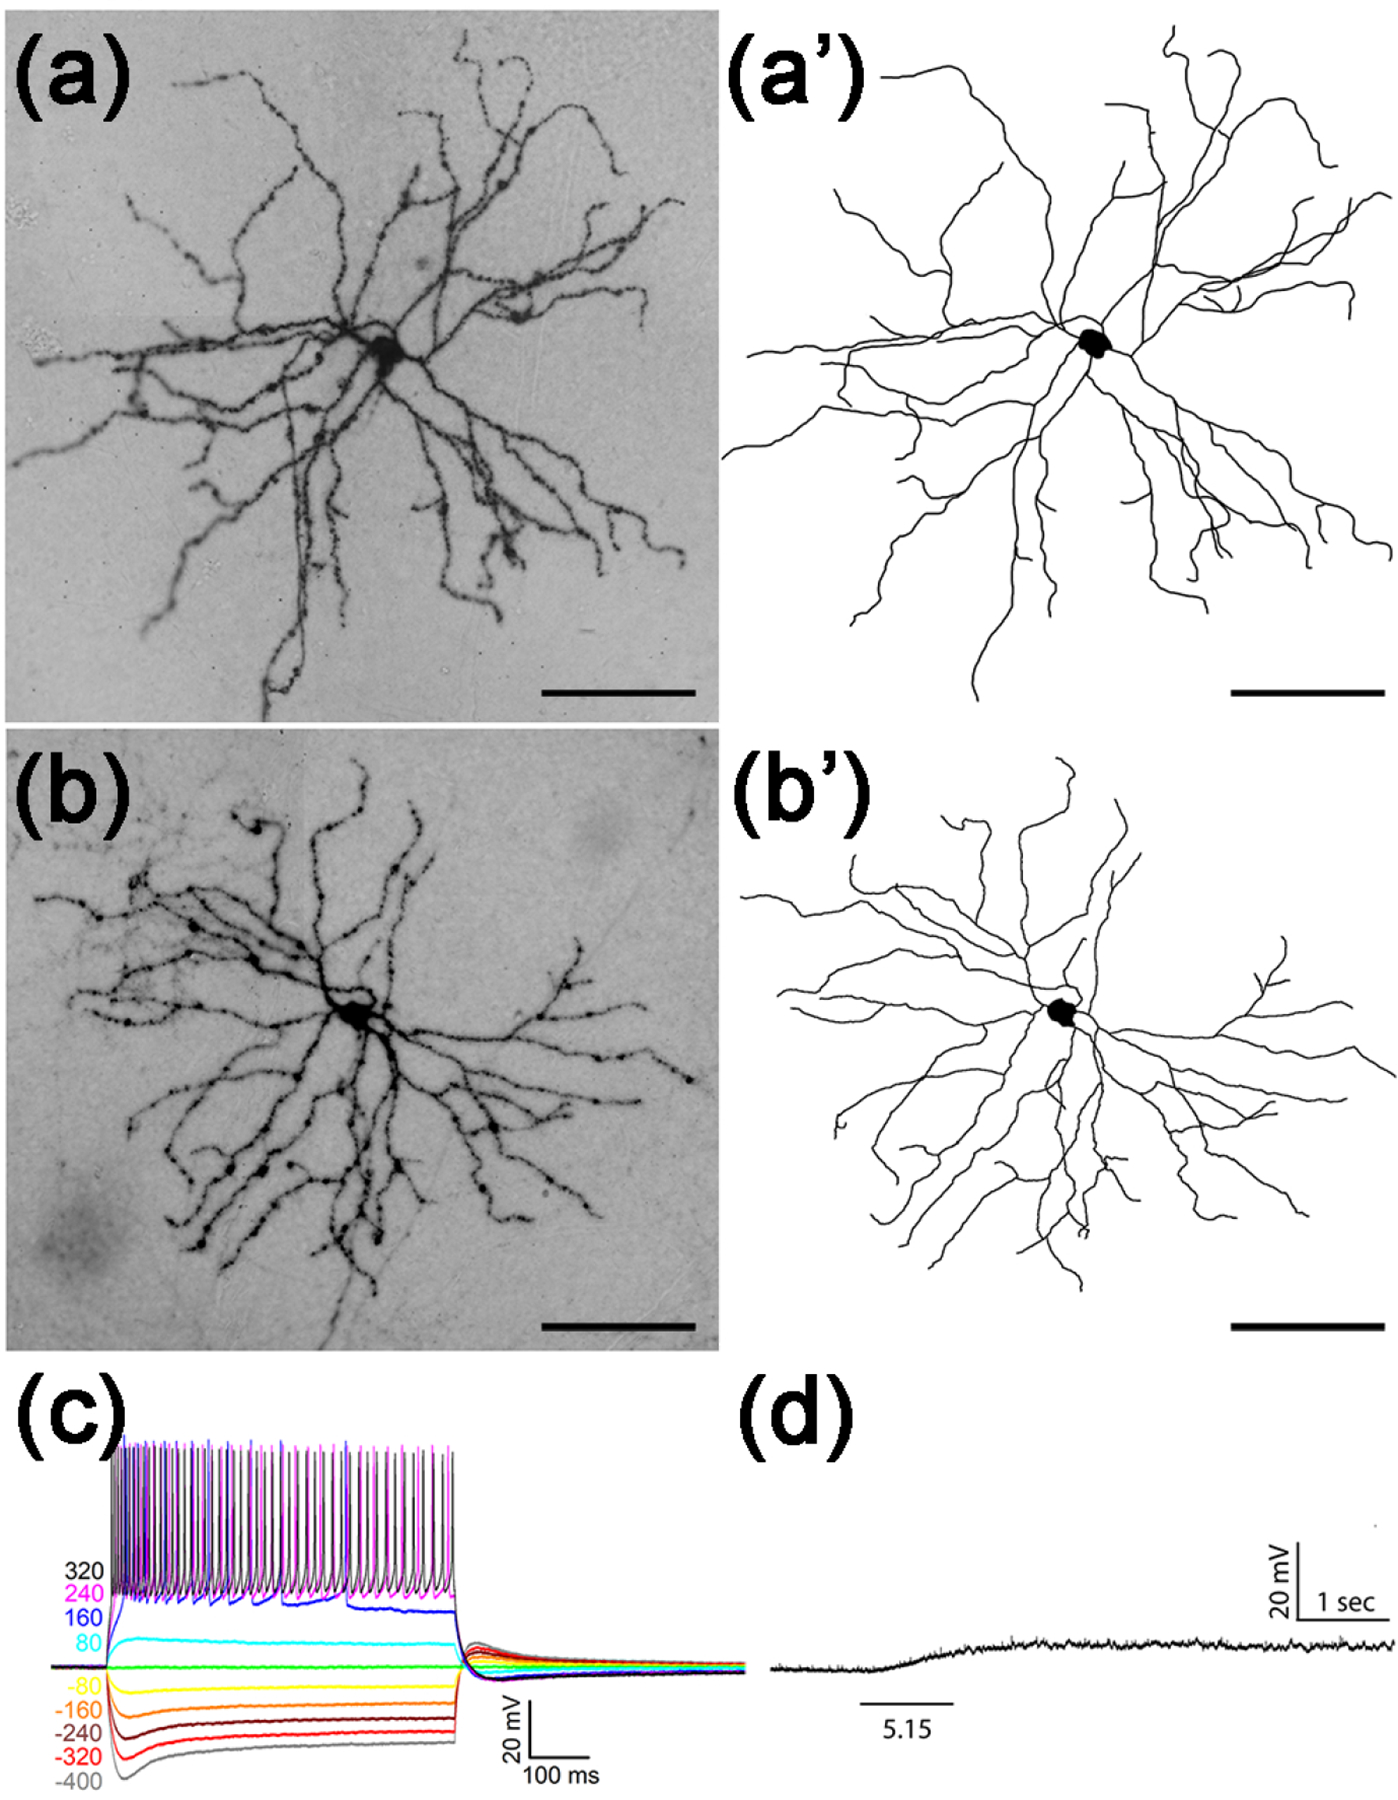
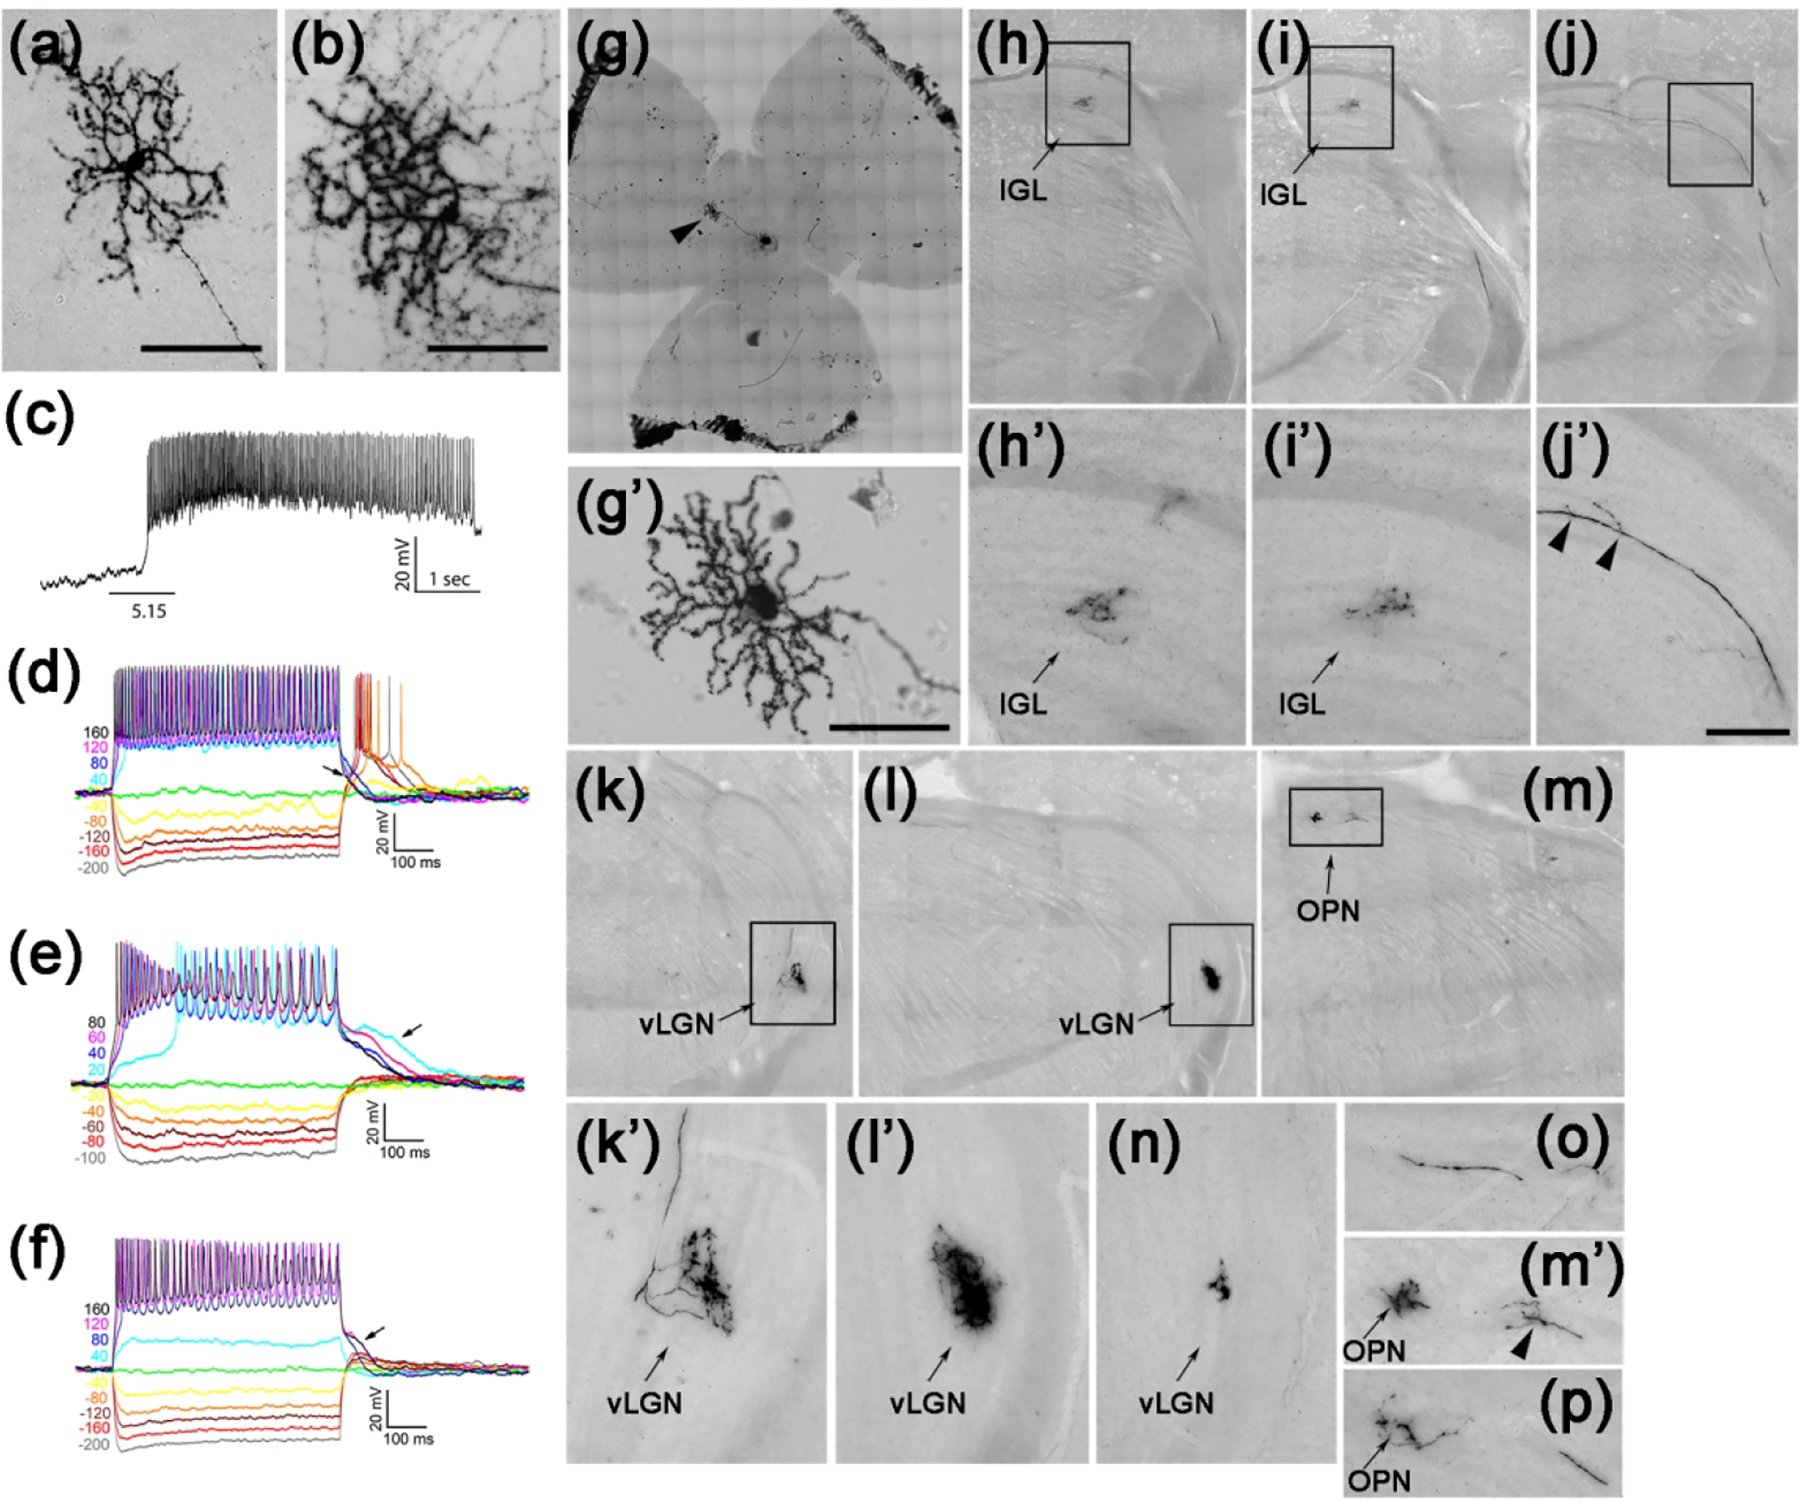
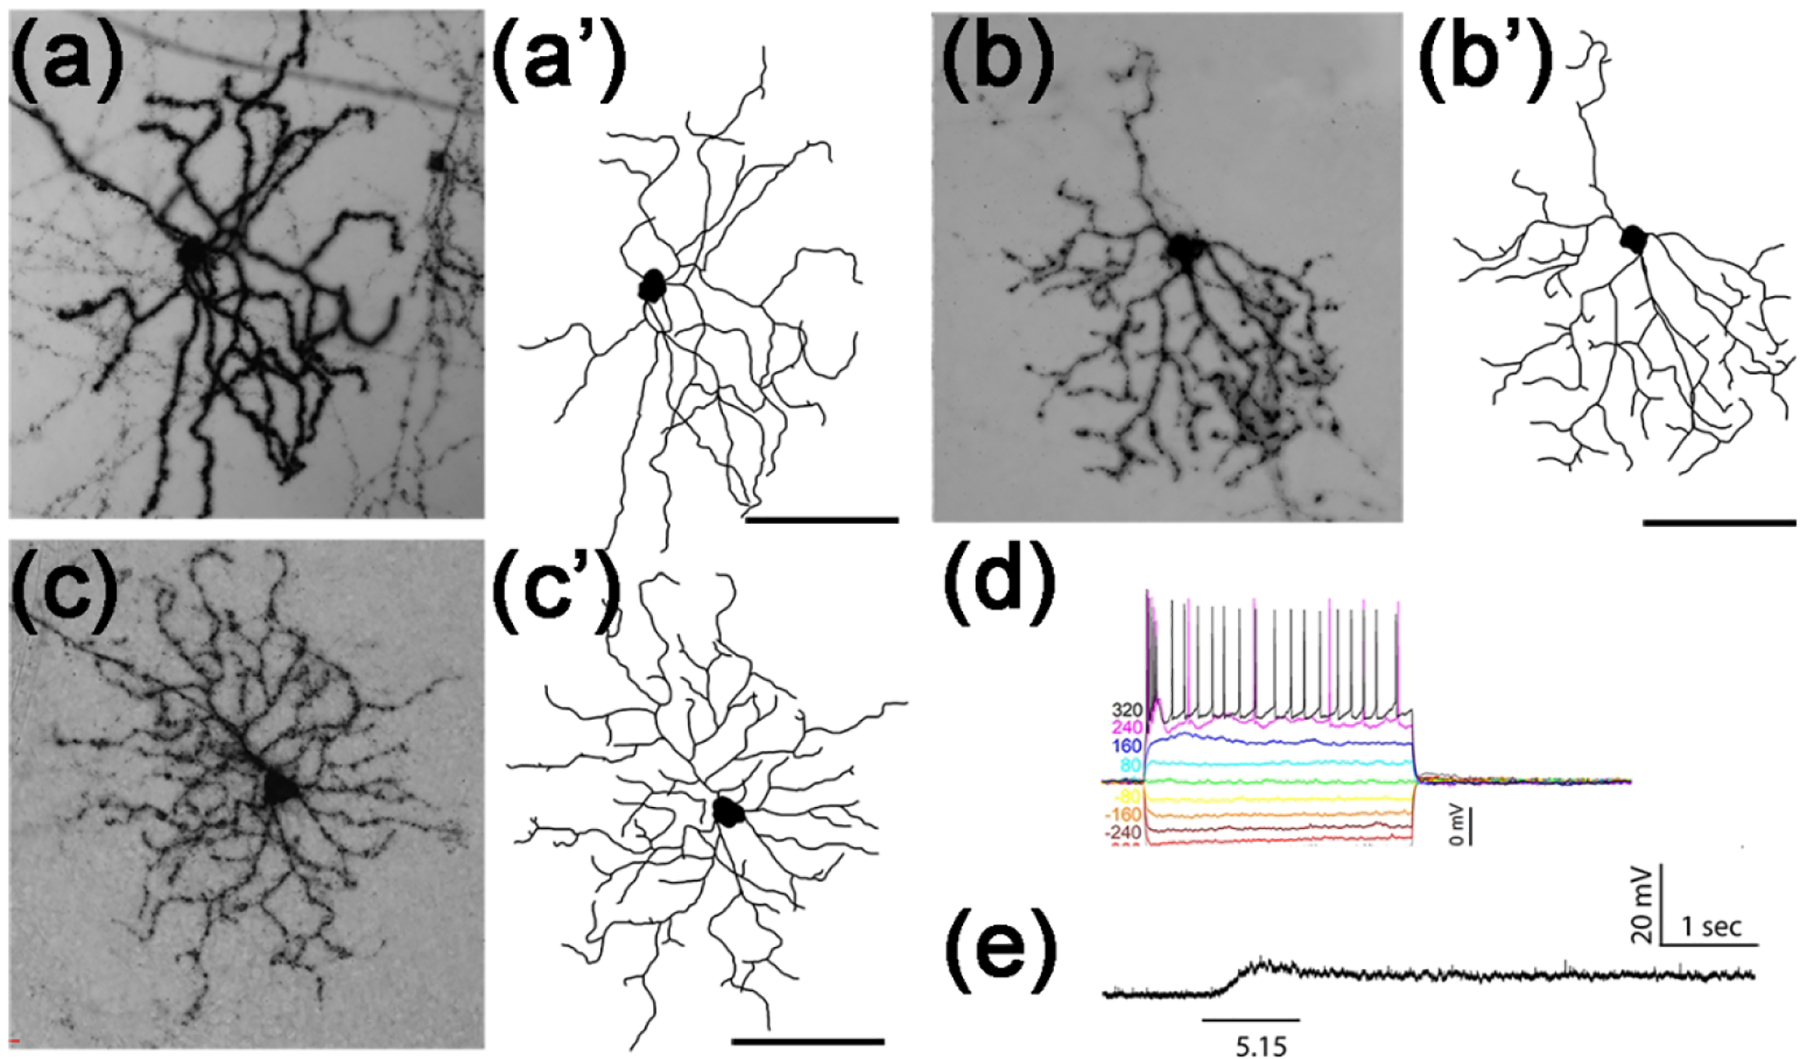
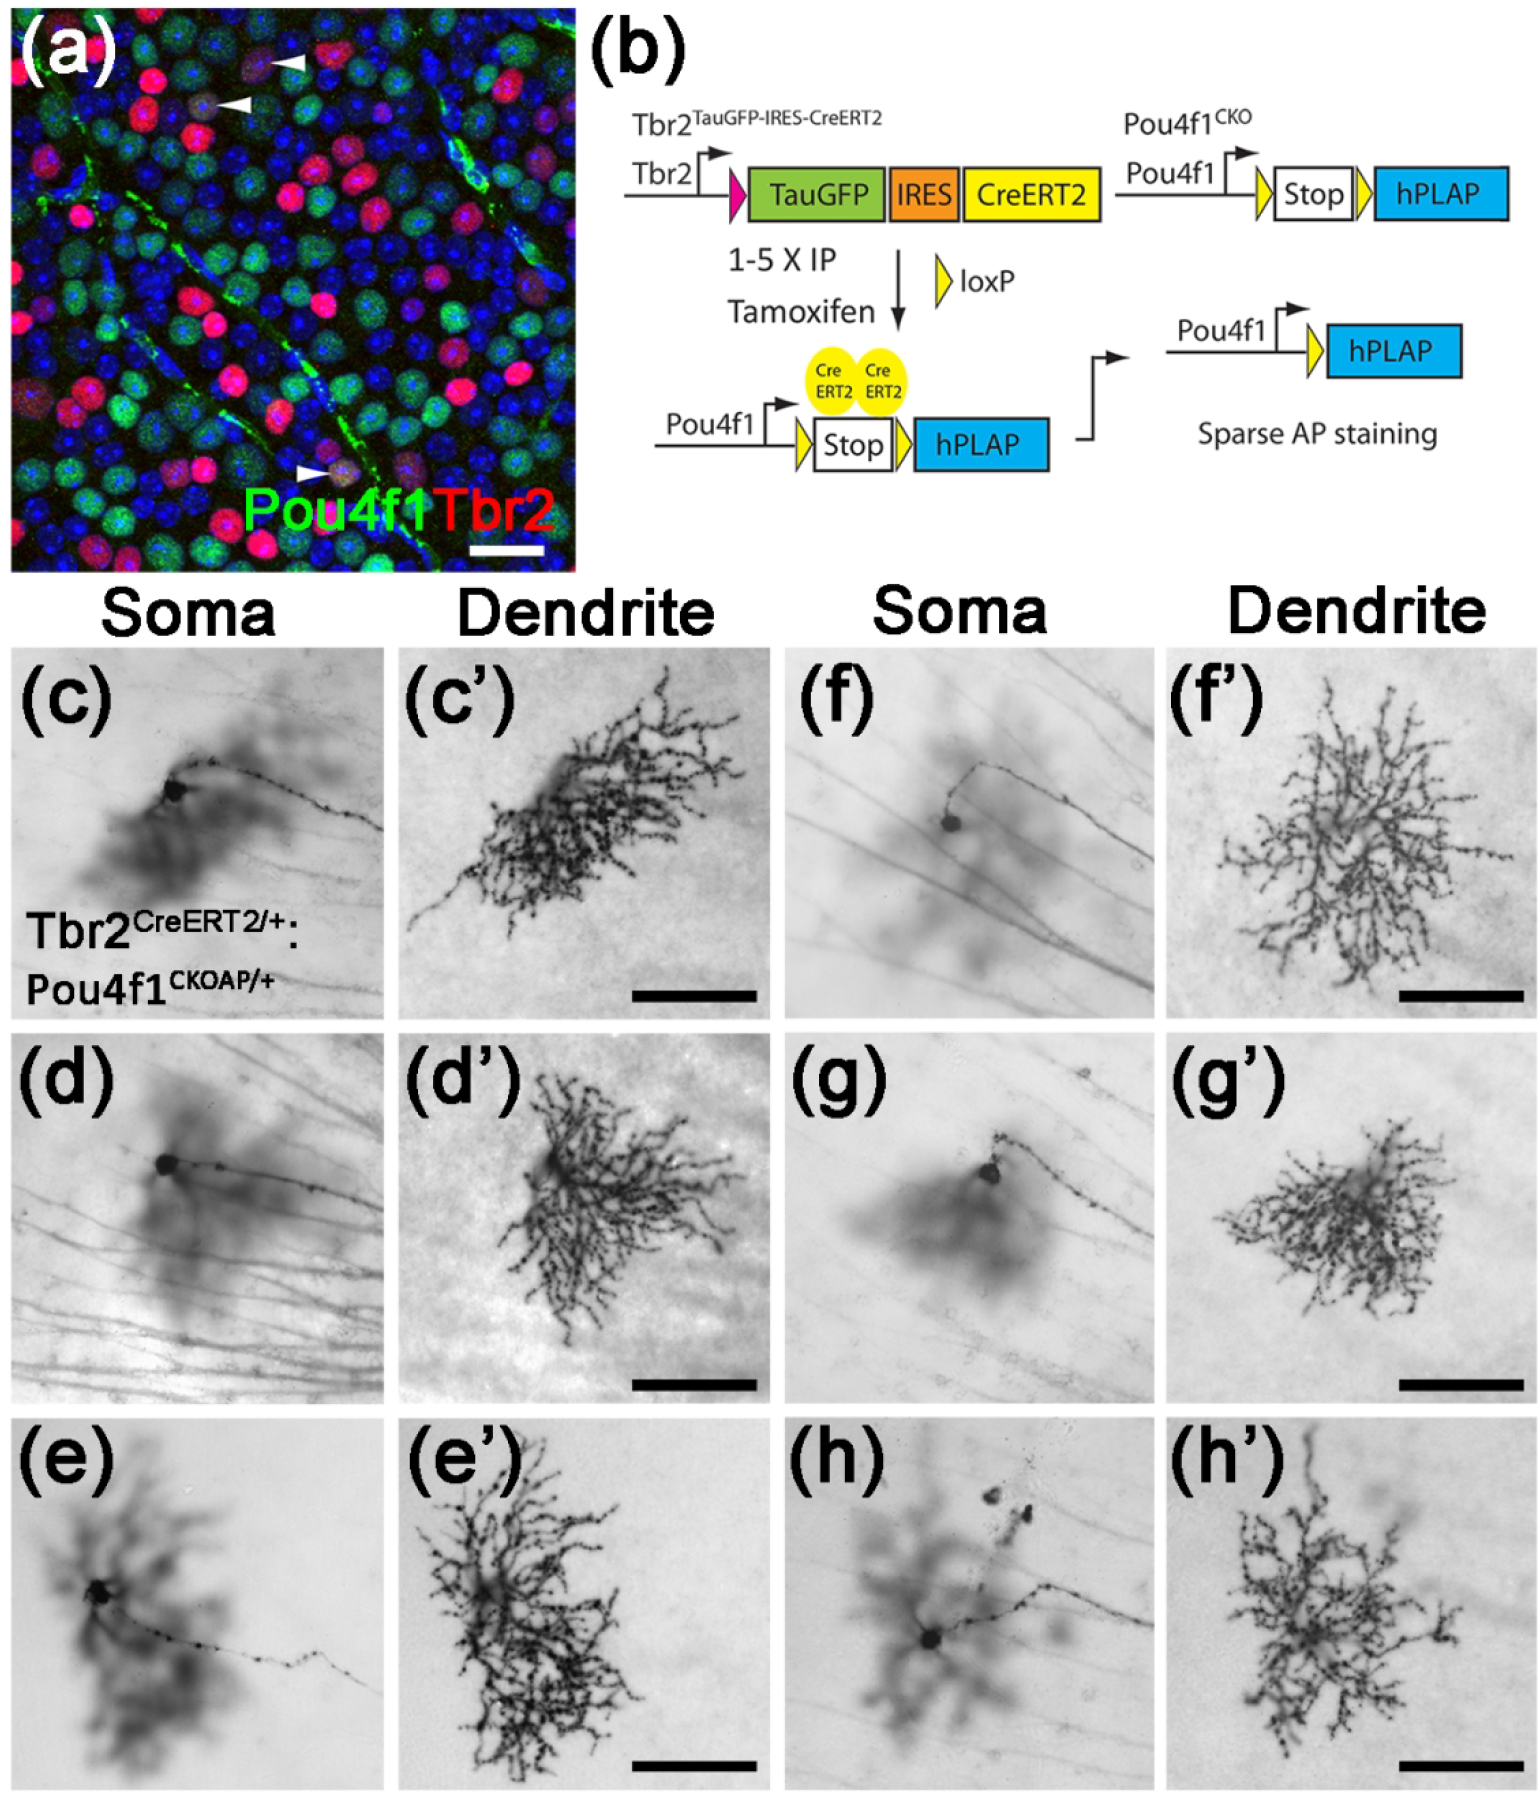
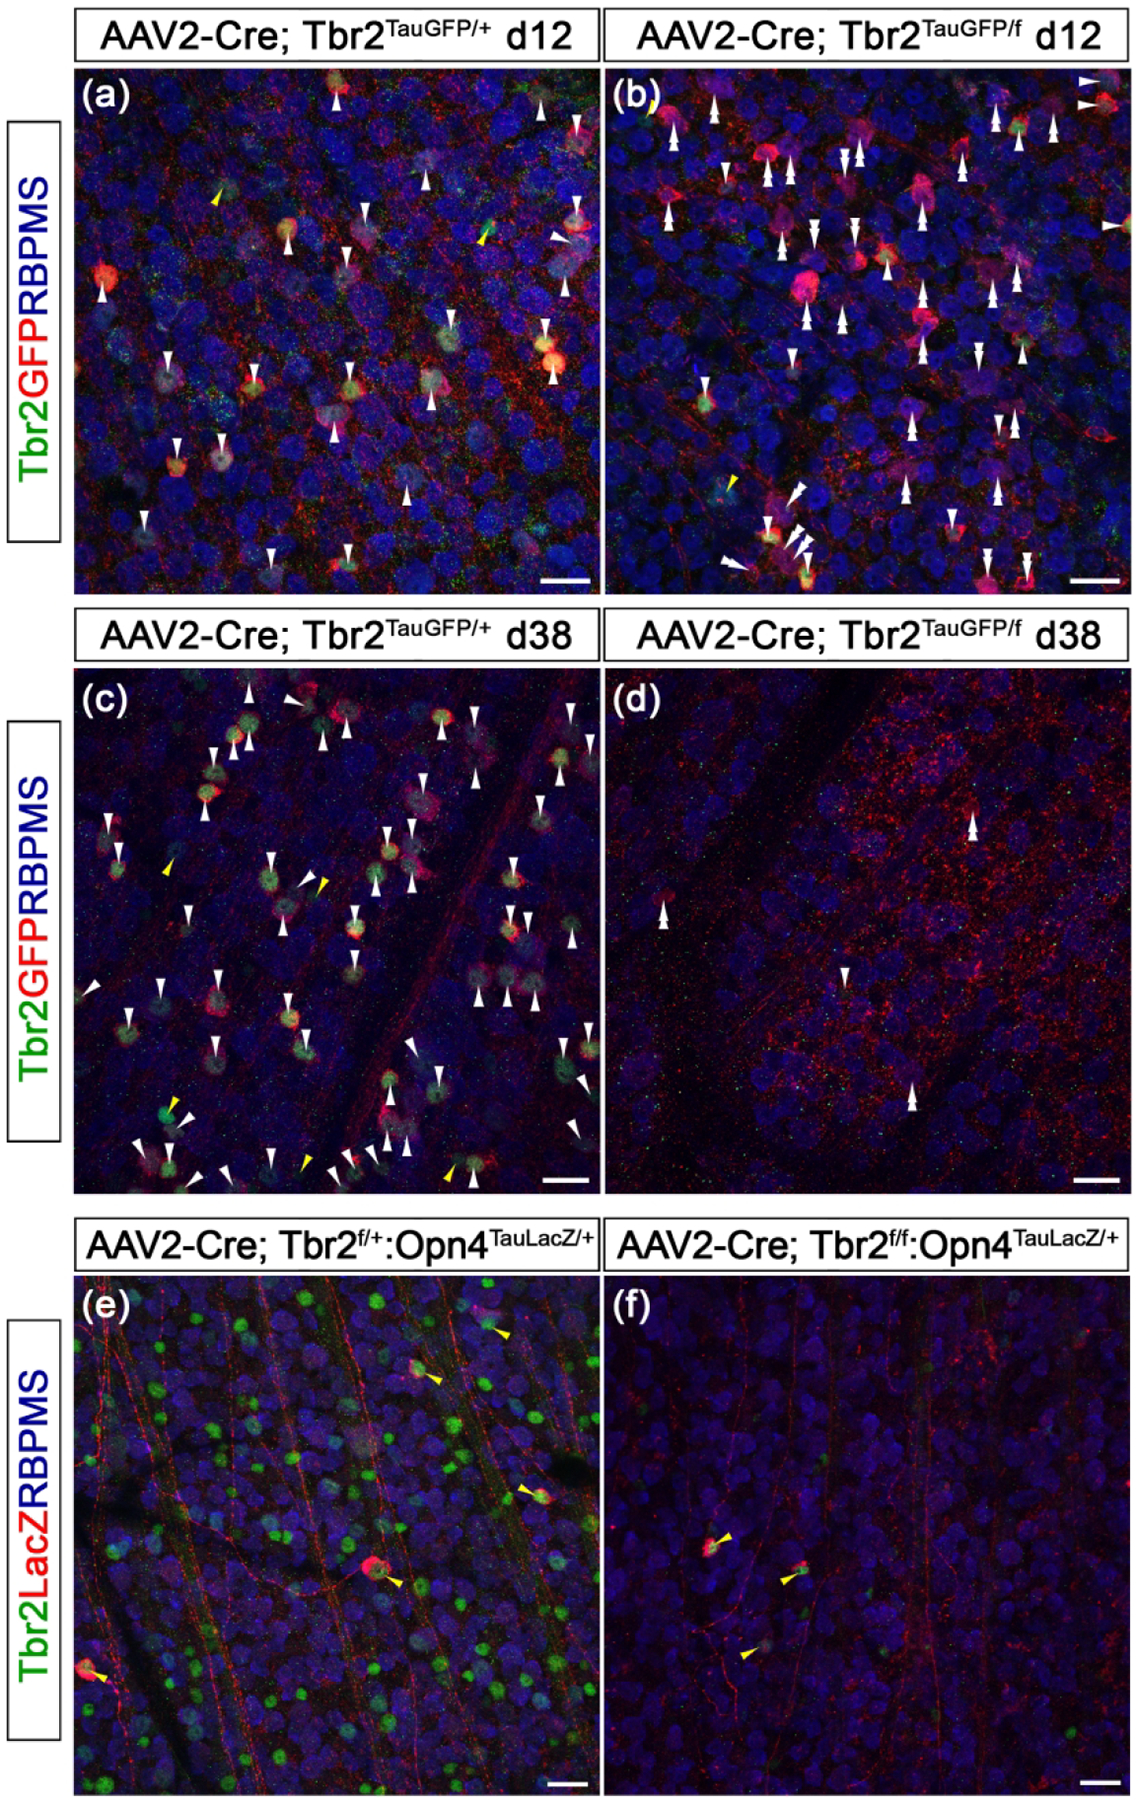
The mammalian retina contains more than 40 retinal ganglion cell (RGC) subtypes based on their unique morphologies, functions, and molecular profiles. Among them, intrinsically photosensitive RGCs (ipRGCs) are the first specified RGC type emerging from a common retinal progenitor pool during development. Previous work has shown that T-box transcription factor T-brain 2 (Tbr2) is essential for the formation and maintenance of ipRGCs, and that Tbr2-expressing RGCs activate Opn4 expression upon native ipRGC ablation, suggesting that Tbr2+ RGCs contain a reservoir for ipRGCs. However, the identity of Tbr2+ RGCs has not been fully vetted. Here, using genetic sparse labeling and single cell recording, we showed that Tbr2-expressing retinal neurons include RGCs and a subset of GABAergic displaced amacrine cells (dACs). Most Tbr2+ RGCs are intrinsically photosensitive and morphologically resemble native ipRGCs with identical retinofugal projections. Tbr2+ RGCs also include a unique and rare Pou4f1-expressing OFF RGC subtype. Using a loss-of-function strategy, we have further demonstrated that Tbr2 is essential for the survival of these RGCs and dACs, as well as maintaining the expression of Opn4. These data set a strong foundation to study how Tbr2 regulates ipRGC development and survival, as well as the expression of molecular machinery regulating intrinsic photosensitivity.

Keywords: Opn4; Tbr2; displaced amacrine cells; intrinsically photosensitive retinal ganglion cells.


Conflict of interest statement

Declaration of Interest

The authors declare no competing interest.

Figures

Figure 1.
Figure 1.. Tracing Tbr2-expressing retinal neurons.
(a) Genomic structure of Tbr2 locus and the engineered allele in the Tbr2TauGFP-IRESCreERT2 mouse. (b) Double immunofluorescent staining showing Tbr2 expression (magenta) in Tbr2-driven GFP+ cells (green) in an E16.5 Tbr2TauGFP retinal section. (c) Representative immunofluorescent image showing Tbr2-driven GFP+ cells (green) in a P3 Tbr2TauGFP retinal flatmount. (d) Immunofluorescent image showing Tbr2 expression (magenta) in Tbr2-driven GFP+ cells (green) in a Tbr2TauGFP retinal section. (e) Fluorescent image of a Tbr2TauGFP retinal section showing dense Tbr2-driven GFP signal (green) in ON sub-laminae below the cholinergic ChAT bands (blue) in IPL. Note that GFP signal is separated from the ON ChAT band. (f) Representative co-immunofluorescent image showing melanopsin expression (magenta) in Tbr2-driven GFP+ cells (green) in a P30 Tbr2TauGFP retinal flatmount. (g) Double immunofluorescent staining showing melanopsin expression (magenta) in Tbr2-driven GFP+ cells (green). (h) Co-immunofluorescent staining on a Slc32a1Cre:Ai9 retinal flatmount showing Tbr2 expression (blue) with RBPMS+ RGCs (yellow arrowheads) or tdTomato+ RBPMS dACs (white arrowheads). (i) Relative abundance of Tbr2+ RGCs and dACs described in G. (j) Relative abundance of Tbr2+ RGCs within the entire RGC population (left) and Tbr2+ dACs within the entire dAC population. (k) Co-immunofluorescent staining on a WT retinal flatmount showing melanopsin expression (magenta) with RBPMS+ RGCs (green). ChAT: cholinergic acetyltransferase. GCL: ganglion cell layer. INL: inner nuclear layer. IPL: inner plexiform layer. Scale bars: 50 μm (b-k).
Figure 2.
Figure 2.. Identification of Tbr2+ RGCs and dACs.
(a) The genetic sparse labeling system in the Tbr2CreERT2:RosaiAP mouse line. (b, b’) Representative AP staining from a flat-mounted P30 Tbr2CreERT2:RosaiAP retina showing intense AP+ Tbr2-expressing retinal neurons (b) and the location where their terminal dendrites stratify in IPL (b’). (c) The fluorescent labeling system of Tbr2+ neurons in the Tbr2CreERT2:Ai9 mouse line. (d, e) Co-immunofluorescent staining on a Tbr2CreERT2/+:Ai9 retinal flatmount showing tdTomato expression (magenta, white arrowheads) with Tbr2 (green) (d) or Tbr2-driven GFP (e). (f, f’) Representative images showing the morphology of a Tbr2-expressing displaced amacrine cell (yellow arrowhead) and a nearby RGC (white arrowhead) revealed by filled neurobiotin (f) and the location where their terminal dendrites stratify in reference to ChAT bands in IPL (f’). NBT: neurobiotin. ChAT: cholinergic acetyltransferase. Scale bars: 500 μm (b), 20 μm (d, e), 100 μm (f).
Figure 3.
Figure 3.. Characterization of Tbr2+ dACs.
Representative intrinsic membrane property (IMP) profiles (a, c, e), intrinsic light sensitivity (a’, c’, e’), dendritic structure (b, d, f) and IPL stratification levels (insects) of three Tbr2+-dACs. Membrane potential changes in response to 600 msec current injections of varying amplitude and polarity are shown at left. (a, b) Tbr2+-dAC1, not intrinsically photosensitive (a’), is the most frequently encountered type (65%) with a relatively high input resistance (a) and characterized by asymmetric short and long dendrites (b) stratifying to 0.75 ± 0.04 IPL position in reference to designated ON-ChAT position at 0 and OFF-ChAT position at −1 (inset). (c, d) Tbr2+dAC2 (31%) has the lowest input resistance (c) and is not intrinsically photosensitive (c’) with many radiating long dendrites that span the retina (d) and stratify to 0.77 ± 0.07 IPL position (inset). Note the larger currents required to elicit similar amplitude changes in the Tbr2+-dAC2. (e, f) Tbr2+-dAC3 is a rarely encountered (4%) mediumfield dAC with discernable IMP (e) and apparent intrinsic photosensitivity (e’) with closer stratification level to ON-ChAT band at 0.50 ± 0.12 (inset). Intrinsic photosensitivity was tested under 1-sec light step of 5.15 log R*/rod/sec. Scale bar: 200 μm.
Figure 4.
Figure 4.. M1-like Tbr2+ RGCs.
(a-h) Representative brightfield images of AP-stained Tbr2CreERT2/+:RosaiAP/+ retinal flatmounts. Images were focused on the terminal dendrites located in between INL/IPL boundary (labeled as INL) except in (e) where the focus was on the soma in the ganglion cell layer. The green polygons represent the terminal dendritic arbor. The red arrowhead in E indicates the single primary dendrite of this RGC. Three representative displaced M1-like RGCs (f-h) with somata located in INL (pointed by red arrowheads) were also shown. GCL: ganglion cell layer. INL: inner nuclear layer. IPL: inner plexiform layer. Scale bars: 100 μm (a-h).
Figure 5.
Figure 5.. IMP and intrinsic photosensitivity of M1-like Tbr2+ RGCs.
(a-c) Representative IMP profiles: M1n (a), M1r (b), M1s (c), intrinsic photosensitivity (a’-c’) to 1-sec light step of indicated intensity in log R*/rod/sec, and dendritic morphology and stratification patterns (a“-c”) from three M1-like Tbr2+ RGC subtypes. See Table 1 for detailed morphometric analysis which reveals no significant difference between the three except that the M1s subtype has a significantly lower input resistance than the other two. Scale bar: 50 μm.
Figure 6.
Figure 6.. Bistratified Tbr2+ RGCs.
(a-f’) Representative AP-stained images of M6-like (a-b’) and various types of M3-like (c-f’) Tbr2+ RGCs from Tbr2CreERT2/+:RosaiAP/+ retinal flatmounts. Images were focused on the ON (a-f) or OFF (a’-f’) IPL sub-lamina.. Red polygons represent the terminal dendritic arbor in the ON-layer, while the green polygons represent those in the OFF-layer. The white arrowheads indicate the sparse terminal dendrites in the ON layer, and the black arrowheads indicat those in the OFF-layer. (g) Representative M3- (upper) and M6-like (lower) Tbr2+ RGC instrinsic photoresponses to 1-sec light step of indicated intensity in log R*/rod/sec. (h-k) Representative and diverse IMP profiles associated with the bistratified Tbr2+ RGCs. The M6 subtype has a distinguishable IMP profile (k) from the M3 subtypes (h-j). Scale bars: 100 μm (a’-f’).
Figure 7.
Figure 7.. Large M4-like Tbr2+ RGCs.
(a-b) Representative images of AP-stained M4-like Tbr2+ RGCs from Tbr2CreERT2/+:RosaiAP/+ retinal flatmounts. (a’-b’) Neuronal tracing of the ministacked images shown in A-B. (c-d) Stereotypic IMP profile (c) and representative intrinsic photoresponse of a M4-like Tbr2+ RGC to 1-sec light step of indicated intensity in log R*/rod/sec. (d). Scale bars: 100 μm (a-b’).
Figure 8.
Figure 8.. Small M5-like Tbr2+ RGCs.
(a-b) Representative AP-stained images of M5-like Tbr2+ RGCs from Tbr2CreERT2/+:RosaiAP/+ retinal flatmounts. (c) Representative intrinsic photoresponse to 1-sec 5.15 log R*/rod/sec light step. (d-f) Representative and diverse IMP profiles of M5-like Tbr2+ RGCs. Note the characteristic return delay to the baseline following positive current injections (arrows). (g-g’) Retina with a single M5-like Tbr2+ RGC. (h-p) AP-stained brain sections showing multiple axonal projections of the M5-like RGC shown in g’ in several different regions in the brain. (h’-m’) Enlarged images of the bracketed regions in H to M, respectively. IGL: inter-geniculate leaflet. OPN: olivary pretectal nuclei. vLGN: ventral lateral geniculate nuclei. INL: inner nuclear layer. Scale bars: 100 μm (a, b, g’).
Figure 9.
Figure 9.. M2-like Tbr2+ RGCs.
(a-c) Representative AP-stained images of 3 M2-like Tbr2+ RGCs from Tbr2CreERT2/+:RosaiAP/+ retinal flatmounts. (a’-c’) Corresponding tracing of ministacked images shown in A to C. (d) Representative stereotypic IMP profile of M2-like Tbr2+ RGCs. Note the quick return to baseline and the absence of regenerative changes following large current injections. (e) Representative intrinsic response to 1-sec light step of indicated intensity in log R*/rod/sec. Scale bars: 100 μm (q’-c’).
Figure 10.
Figure 10.. OFF-layer stratified Tbr2+Pou4f1+ RGCs.
(a) Fluorescent image of a representative wild-type retinal flatmount showing Tbr2 expression (red) with Pou4f1-expressing (green) RGCs (white arrowheads). (b) The genetic sparse labeling system in the Tbr2CreERT2:Pou4f1CKO mouse line for brightfield identification of this cell type by AP staining. (c-h’) Representative brightfield AP-stained images of the Tbr2+Pou4f1+ RGCs. Scale bars: 100 μm (c’-h’). AP: alkaline phosphatase.
Fig. 11.
Fig. 11.. Retinofugal projections of Tbr2+ RGCs in Tbr2CreERT2/+:RosaiAP mice.
(a-g) AP-stained brightfield images showing projections of Tbr2+ RGCs into SCN (a), IGL, vLGN, dLGN, LD (b), OPN and MPT (c), SC (d-e), pSON (f), LDH (g1-g2), and LHb (h). dLGN: dorsal lateral geniculate nuclei. IGL: inter-geniculate leaflet. LD: lateral dorsal nucleus. LDH: lateral hypothalamus. LHb: lateral habenula. OPN: olivary pretectal nuclei. pSON: peri-supraoptic nucleus SC: superior colliculus. SCN: suprachiasmatic nuclei. SO: stratum opticum. u/lSGS: upper/lower stratum griseum superficiale. vLGN: ventral lateral geniculate nuclei.
Figure 12.
Figure 12.. Tbr2 is essential for maintaining ipRGC survival and Opn4 expression.
(a-d) Fluorescent images of Tbr2, GFP, and RBPMS on Tbr2TauGFP/+ retinas (a, c) and Tbr2TauGFP/fx (b, d) that was treated with AAV2-Cre. Retinas were isolated 12 days (a, b) or 38 days (c, d) post-injection. (e-f) Co-immunofluorescent staining of Tbr2, LacZ, and RBPMS on Tbr2fx/+:Opn4TaulacZ (e) or Tbr2fx/fx:Opn4TaulacZ (f) retinas. Retinas were isolated 14 days post-injection. Scale bars: 20 μm.

References

    1. Arnold SJ, Huang GJ, Cheung AF, Era T, Nishikawa S, Bikoff EK, … Groszer M (2008). The T-box transcription factor Eomes/Tbr2 regulates neurogenesis in the cortical subventricular zone. Genes Dev, 22(18), 2479–2484. doi:10.1101/gad.475408 - DOI - PMC - PubMed
    1. Badea TC, Cahill H, Ecker J, Hattar S, & Nathans J (2009). Distinct roles of transcription factors brn3a and brn3b in controlling the development, morphology, and function of retinal ganglion cells. Neuron, 61(6), 852–864. doi:10.1016/j.neuron.2009.01.020 - DOI - PMC - PubMed
    1. Badea TC, Hua ZL, Smallwood PM, Williams J, Rotolo T, Ye X, & Nathans J (2009). New mouse lines for the analysis of neuronal morphology using CreER(T)/loxP-directed sparse labeling. PLoS One, 4(11), e7859. doi:10.1371/journal.pone.0007859 - DOI - PMC - PubMed
    1. Badea TC, & Nathans J (2004). Quantitative analysis of neuronal morphologies in the mouse retina visualized by using a genetically directed reporter. J Comp Neurol, 480(4), 331–351. doi:10.1002/cne.20304 - DOI - PubMed
    1. Badea TC, & Nathans J (2011). Morphologies of mouse retinal ganglion cells expressing transcription factors Brn3a, Brn3b, and Brn3c: analysis of wild type and mutant cells using genetically-directed sparse labeling. Vision Res, 51(2), 269–279. doi:10.1016/j.visres.2010.08.039 - DOI - PMC - PubMed

Publication types