. 2021 Aug 19;81(16):3275-3293.e12.
doi: 10.1016/j.molcel.2021.06.017. Epub 2021 Jul 9.

An mTORC1-GRASP55 signaling axis controls unconventional secretion to reshape the extracellular proteome upon stress

Affiliations

An mTORC1-GRASP55 signaling axis controls unconventional secretion to reshape the extracellular proteome upon stress

Julian Nüchel et al. Mol Cell. .

Abstract

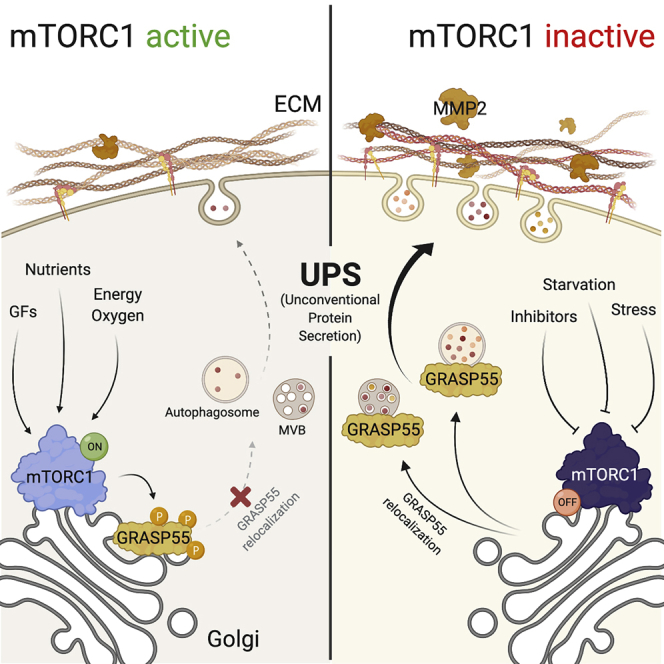
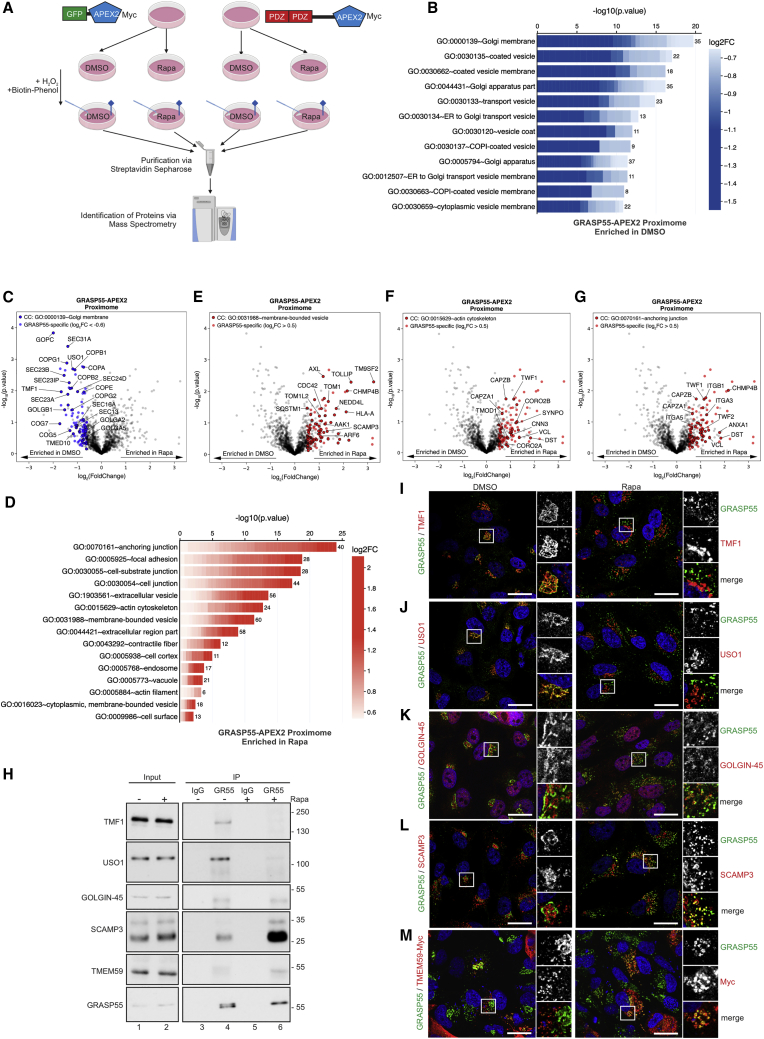
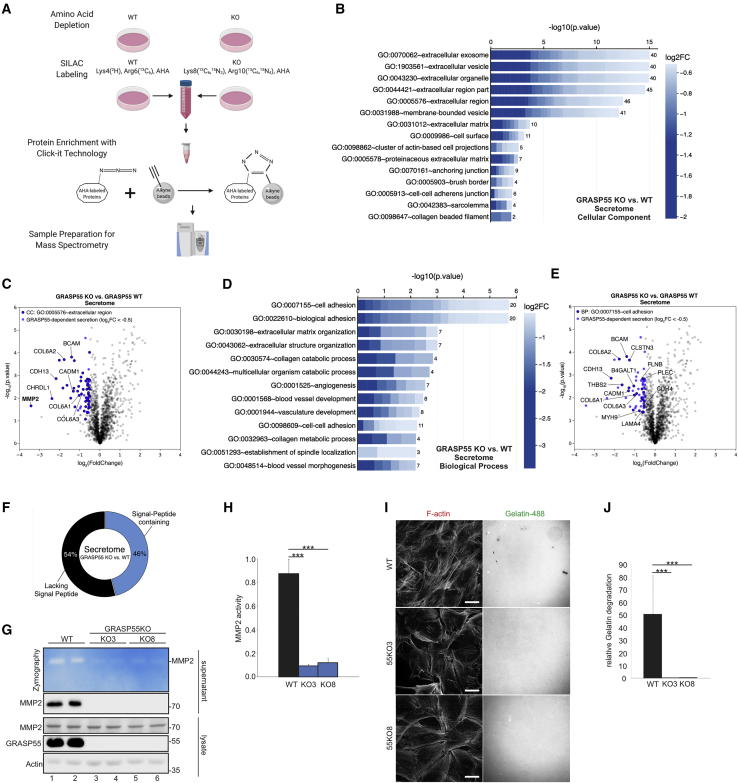
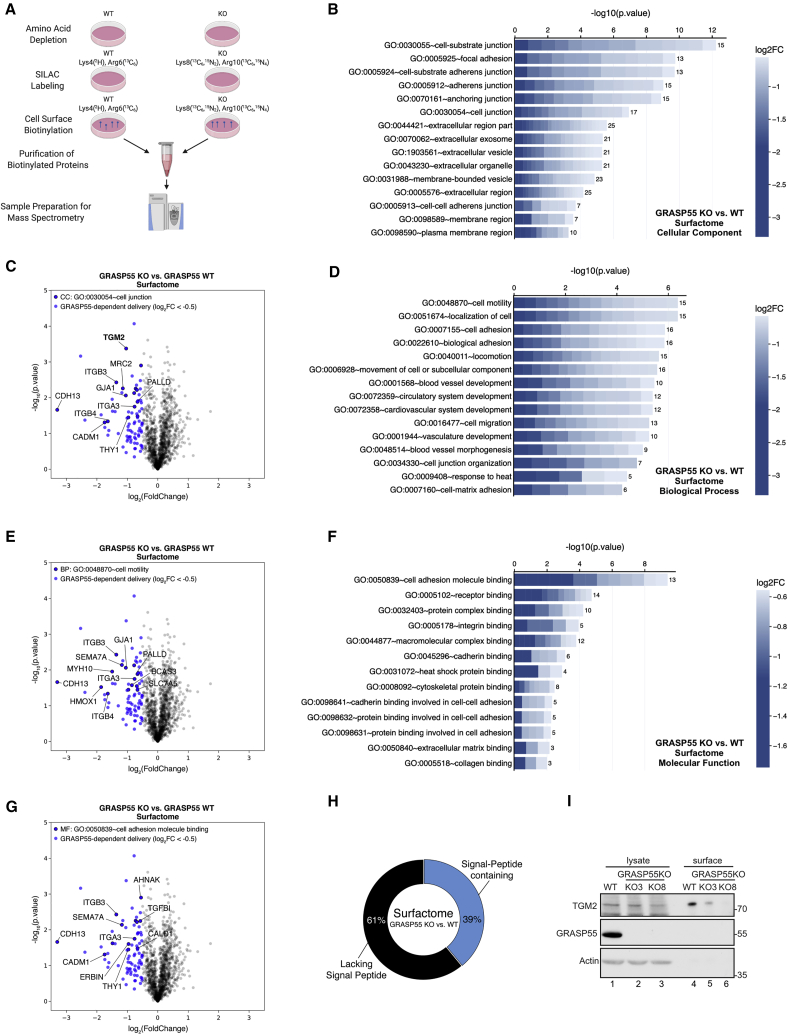
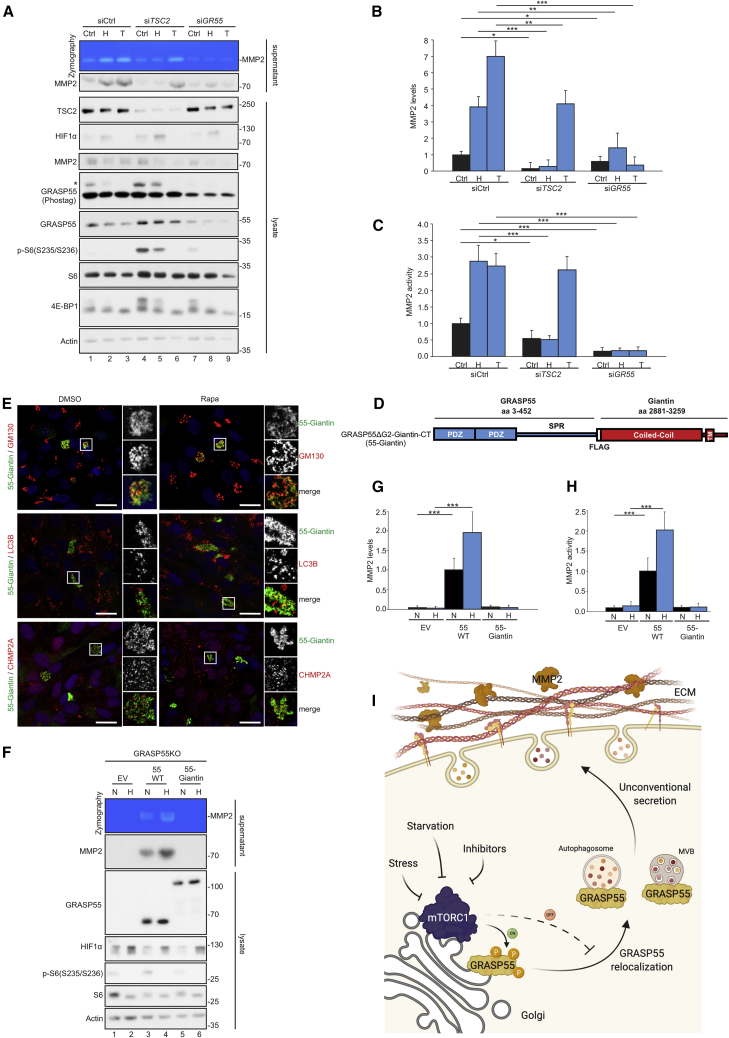
Cells communicate with their environment via surface proteins and secreted factors. Unconventional protein secretion (UPS) is an evolutionarily conserved process, via which distinct cargo proteins are secreted upon stress. Most UPS types depend upon the Golgi-associated GRASP55 protein. However, its regulation and biological role remain poorly understood. Here, we show that the mechanistic target of rapamycin complex 1 (mTORC1) directly phosphorylates GRASP55 to maintain its Golgi localization, thus revealing a physiological role for mTORC1 at this organelle. Stimuli that inhibit mTORC1 cause GRASP55 dephosphorylation and relocalization to UPS compartments. Through multiple, unbiased, proteomic analyses, we identify numerous cargoes that follow this unconventional secretory route to reshape the cellular secretome and surfactome. Using MMP2 secretion as a proxy for UPS, we provide important insights on its regulation and physiological role. Collectively, our findings reveal the mTORC1-GRASP55 signaling hub as the integration point in stress signaling upstream of UPS and as a key coordinator of the cellular adaptation to stress.

Keywords: ECM; GORASP2; GRASP55; Golgi; MMP2; Rapamycin; Tuberous Sclerosis Complex (TSC); cellular stress response; mTORC1; unconventional protein secretion (UPS).


Conflict of interest statement

Declaration of interests The authors declare no competing interests.

Figures

None
Graphical abstract
Figure 1
Figure 1
mTORC1 activity regulates GRASP55 phosphorylation and localization (A and Β) Immunoblots with lysates from WI-26 cells treated with media or inhibitors as shown, using indicated antibodies. GRASP55 phosphorylation analyzed with Phos-tag gels. Asterisk indicates p-GRASP55. Quantification of GRASP55 phosphorylation is shown in (B). (C–H) Colocalization analysis of GRASP55 with GM130 (Golgi) (C and D), LC3B (autophagosomes) (E and F), and CHMP2A (MVBs) (G and H) in WI-26 cells. Quantification of colocalization is shown in (D), (F), and (H). Scale bars: 10 μm. (I–L) Same as in (C)–(H), but using immuno-EM for GRASP55 (10 nm gold) and the Golgi 58K protein, LC3B, or CHMP2A (5 nm gold) (I). Scale bars: 200 nm. Quantification of gold particles for GRASP55 and markers shown per Golgi stack (J), autophagosome (K), or MVB (L). Data in graphs shown as mean ± SD. p < 0.05, ∗∗∗p < 0.005. See also Figures S1–S3.
Figure 2
Figure 2
Aberrant mTORC1 activation in TSC2 KO cells prevents dephosphorylation and relocalization of GRASP55 upon stress (A and B) Immunoblots with lysates from WT or TSC2 KO WI-26 cells treated with −AA medium or rapamycin (Rapa) using the indicated antibodies. GRASP55 phosphorylation analyzed with Phos-tag gels. Asterisk indicates p-GRASP55. Quantification of GRASP55 phosphorylation is shown in (B). (C–H) Colocalization analysis of GRASP55 with the GM130 (C), LC3B (E), and CHMP2A (G) organelle markers in WT and TSC2 KO WI-26 cells, treated as in (A). Quantification of colocalization is shown in (D), (F), and (H). Scale bars: 5 μm. Data in graphs shown as mean ± SD. p < 0.05, ∗∗∗p < 0.005. See also Figure S4.
Figure 3
Figure 3
Direct GRASP55 phosphorylation by mTOR at the Golgi controls its localization (A and B) Immunoblots from WI-26 cells cultured in AA-containing media (+AA), treated with AA-starvation media (−AA), or first starved for 2 h and then re-supplemented with +AA media (AA readdition) using the indicated antibodies. GRASP55 phosphorylation analyzed with Phos-tag gels. Asterisk indicates p-GRASP55. Quantification of GRASP55 phosphorylation is shown in (B). (C) In vitro mTORC1 kinase assay with GST-GRASP55, GST-4E-BP1 (positive control), or GST (negative control) ± Torin. Substrate phosphorylation detected by autoradiography. Equal loading shown by Coomassie staining. Number sign (#) indicates immunoglobulin G (IgG) bands. (D) Immuno-EM for endogenous GRASP55 (10-nm gold particles) and mTOR (5-nm gold particles) in WI-26 cells showing colocalization at the Golgi. Scale bar: 200 nm. (E) Phosphorylation of GRASP55 (55), GRASP65 (65) and chimeric proteins (55–65, 65–55) analyzed with Phos-tag gels in reconstituted GRASP55 KO WI-26 cells ± Rapa. Asterisks indicate phosphorylated proteins. Total protein levels analyzed by immunoblotting as indicated. (F and G) Phosphorylation of WT or mutant GRASP55 (5TA, T264A) analyzed with Phos-tag gels in reconstituted GRASP55 KO WI-26 cells ± Rapa. Asterisk indicates p-GRASP55 (G). Schematic representation of GRASP55 showing the residues mutated in 5TA is shown in (F). (H and I) As in (G), but for GRASP55 colocalization with GM130 and LC3B. Data in (B) are shown as mean ± SD. p < 0.05, ∗∗∗p < 0.005. See also Figure S5.
Figure 4
Figure 4
The mTORC1-dependent GRASP55 proximome (A) Experimental outline of the APEX2-based GRASP55 proximome assay (details in text). (B) CC GO analysis using proteins enriched in the GRASP55 proximome in DMSO-treated WI-26 cells. The color of each box represents fold change values for each protein in rapamycin- versus DMSO-treated cells. The number of proteins in the selected dataset for each term is shown on the right side of each bar. (C) Volcano plot showing all proteins identified in the GRASP55 proximome experiment (gray dots). Proteins used in (B) are shown in blue. Proteins within this subset that belong to the CC GO term “Golgi membrane” are shown with black outline. (D) As in (B), but for proteins enriched in the GRASP55 proximome in rapamycin-treated cells. (E–G) Volcano plots as in (C), but for proteins used in (D) (red dots). Proteins that belong to the CC GO terms “membrane-bounded vesicle” (E), “actin cytoskeleton” (F), or “anchoring junction” (G) are shown with black outline. (H) CoIP experiments in WI-26 cells ± Rapa confirm interaction of GRASP55 with selected proteins from the proximome assays. (I–M) Colocalization analysis of GRASP55 with TMF1 (I), USO1 (J), GOLGIN-45 (K), SCAMP3 (L), and TMEM59-Myc (M) in WI-26 cells ± Rapa. Scale bars: 10 μm. See also Figure S6 and Tables S1, S2, and S3.
Figure 5
Figure 5
The GRASP55-dependent secretome (A) Experimental outline of the SILAC-based GRASP55-dependent secretome assay in WI-26 cells (details in text). (B) CC GO term analysis reveals an enrichment of extracellular-region-related terms among the GRASP55-dependent secretome proteins. Cell plot labeled as in Figure 4B. (C) Volcano plot showing all proteins identified in the GRASP55-dependent secretome (gray dots). Proteins used for the GO analysis in (B) are shown in blue. Proteins within this subset that belong to the CC GO term “extracellular region part” are shown with black outline. (D) BP GO term analysis reveals enrichment of cell-adhesion-related terms among the GRASP55-dependent secretome proteins. Cell plot labeled as in Figure 4B. (E) Volcano plot showing proteins as in (C), but with outlined dots corresponding to the BP GO term “cell adhesion.” (F) Percentage of proteins in the GRASP55-dependent secretome that contain or lack a signal peptide. (G and H) MMP2 activity and secretion assayed in the supernatant of WT and GRASP55 KO WI-26 cells (2 lanes/genotype) by zymography and immunoblotting, respectively (G). Intracellular MMP2, GRASP55, and actin are used as controls. Quantification of MMP2 activity is shown in (H). (I and J) Fluorescent gelatin degradation assay with WT and GRASP55 KO WI-26 cells. Degraded gelatin is shown as black spots. F-actin staining used as cytoskeleton marker. Quantification of relative gelatin degradation is shown in (J). Scale bars: 10 μm. Data in (H) and (J) are shown as mean ± SD. ∗∗∗p < 0.005. See also Figure S6 and Tables S4 and S5.
Figure 6
Figure 6
The GRASP55-dependent surfactome (A) Experimental outline of the SILAC-based GRASP55-dependent surfactome assay in WI-26 cells (details in text). (B) CC GO term analysis reveals enrichment of cell-junction-related terms among the GRASP55-dependent surfactome proteins. Cell plot labeled as in Figure 4B. (C) Volcano plot showing all proteins identified in the GRASP55-dependent surfactome (gray dots). Proteins used in (B) are shown in blue. Proteins within this subset that belong to the CC GO term “cell junction” are shown in blue with black outline. (D) BP GO term analysis reveals enrichment of cell-motility-related terms among the GRASP55-dependent surfactome proteins. Cell plot labeled as in Figure 4B. (E) Volcano plot showing proteins as in (C), but with outlined blue dots corresponding to the BP GO term “cell motility.” (F) MF GO term analysis reveals enrichment of cell-adhesion-molecule-binding-related terms among the GRASP55-dependent surfactome proteins. Cell plot labeled as in Figure 4B. (G) Volcano plot showing proteins as in (C), but with outlined blue dots corresponding to the MF GO term “cell adhesion molecule binding.” (H) Percentage of proteins in the GRASP55-dependent surfactome that contain or lack a signal peptide. (I) TGM2 levels at the cell surface tested by surface protein biotinylation assays and immunoblotting in WT and GRASP55 KO WI-26 cells. Intracellular TGM2, GRASP55, and actin are used as controls. See also Tables S6 and S7.
Figure 7
Figure 7
mTORC1 regulates MMP2 secretion and activity at the extracellular space via GRASP55 relocalization (A–C) Zymography assay for MMP2 activity and immunoblotting for MMP2 levels in the supernatant of control (siCtrl), TSC2 (siTSC2), or GRASP55 (siGR55) knockdown WI-26 cells, treated in basal conditions (Ctrl), hypoxia (H), or with torin (T). Control intracellular proteins were analyzed with indicated antibodies. GRASP55 phosphorylation was analyzed with Phos-tag gels (A). Quantification of MMP2 secretion is shown in (B), and MMP2 activity is shown in (C). (D) Schematic representation of the GRASP55ΔG2-Giantin-CT fusion protein (55-Giantin). The C-terminal coiled-coil and the TM of Giantin are shown. (E) Colocalization of 55-Giantin with GM130, LC3B, and CHMP2A in WI-26 cells ± Rapa. (F–H) Zymography assay for MMP2 activity in the supernatant of cells expressing WT GRASP55 (55 WT), 55-Giantin, or transfected with empty vector (EV) in normoxia (N) or hypoxia (H). Levels of secreted MMP2 and control proteins in cells analyzed by immunoblotting (F). Quantification of MMP2 secretion is shown in (G), and MMP2 activity is shown in (H). (I) Working model for the role of mTORC1 and GRASP55 relocalization in UPS. See main text for details. Created with https://biorender.com. Data in graphs are shown as mean ± SD. p < 0.05, ∗∗p < 0.01, ∗∗∗p < 0.005. See also Figure S7.

Comment in

References

    1. Ahat E., Li J., Wang Y. New Insights Into the Golgi Stacking Proteins. Front. Cell Dev. Biol. 2019;7:131. - PMC - PubMed
    1. Ahmed A.R., Owens R.J., Stubbs C.D., Parker A.W., Hitchman R., Yadav R.B., Dumoux M., Hawes C., Botchway S.W. Direct imaging of the recruitment and phosphorylation of S6K1 in the mTORC1 pathway in living cells. Sci. Rep. 2019;9:3408. - PMC - PubMed
    1. Angarola B., Ferguson S.M. Weak membrane interactions allow Rheb to activate mTORC1 signaling without major lysosome enrichment. Mol. Biol. Cell. 2019;30:2750–2760. - PMC - PubMed
    1. Barr F.A. A novel Rab6-interacting domain defines a family of Golgi-targeted coiled-coil proteins. Curr. Biol. 1999;9:381–384. - PubMed
    1. Barr F.A., Puype M., Vandekerckhove J., Warren G. GRASP65, a protein involved in the stacking of Golgi cisternae. Cell. 1997;91:253–262. - PubMed

Publication types

MeSH terms