. 2021 Nov;161(5):1584-1600.
doi: 10.1053/j.gastro.2021.06.045. Epub 2021 Jul 8.

Metabolic Rewiring by Loss of Sirt5 Promotes Kras-Induced Pancreatic Cancer Progression

Affiliations

Metabolic Rewiring by Loss of Sirt5 Promotes Kras-Induced Pancreatic Cancer Progression

Tuo Hu et al. Gastroenterology. 2021 Nov.

Abstract

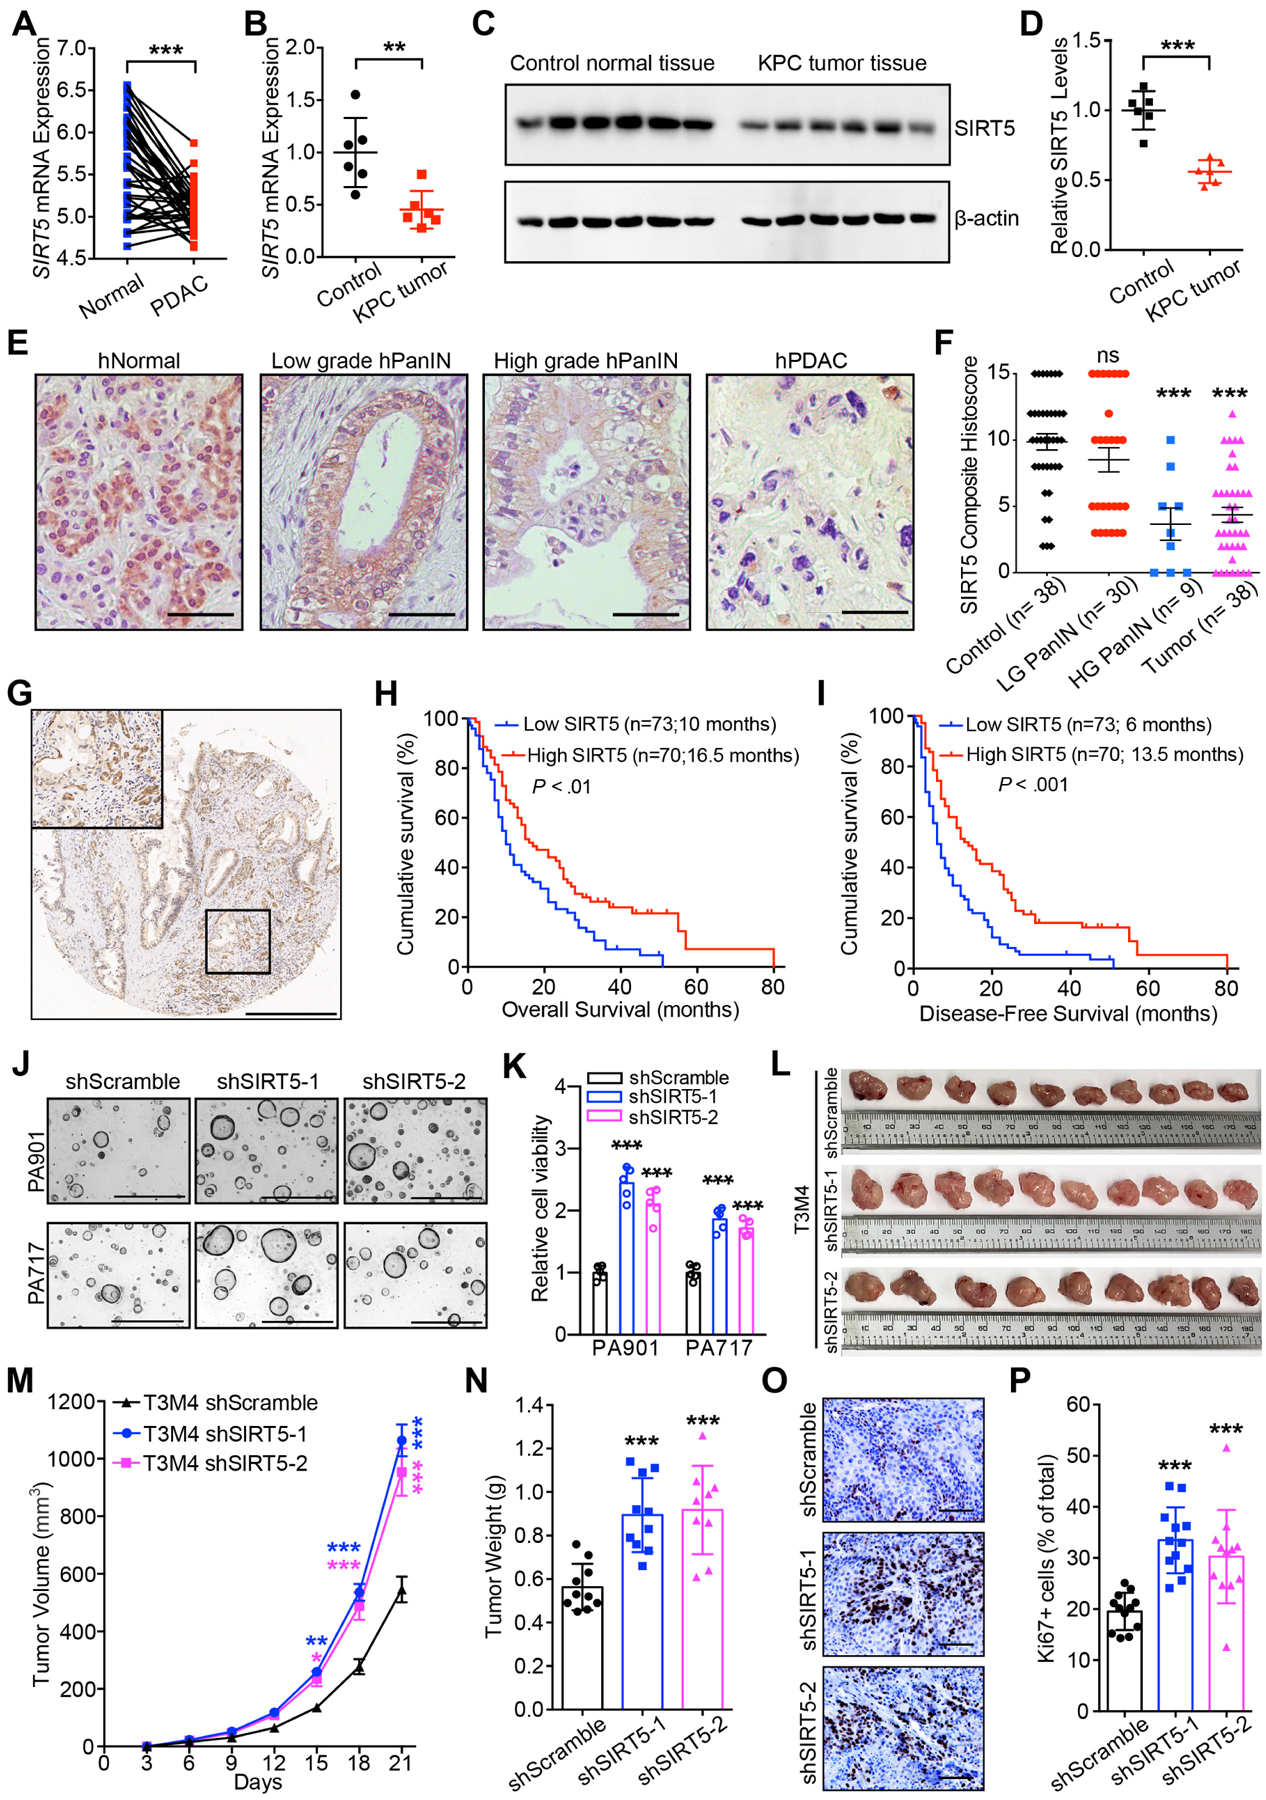
Background & aims: SIRT5 plays pleiotropic roles via post-translational modifications, serving as a tumor suppressor, or an oncogene, in different tumors. However, the role SIRT5 plays in the initiation and progression of pancreatic ductal adenocarcinoma (PDAC) remains unknown.

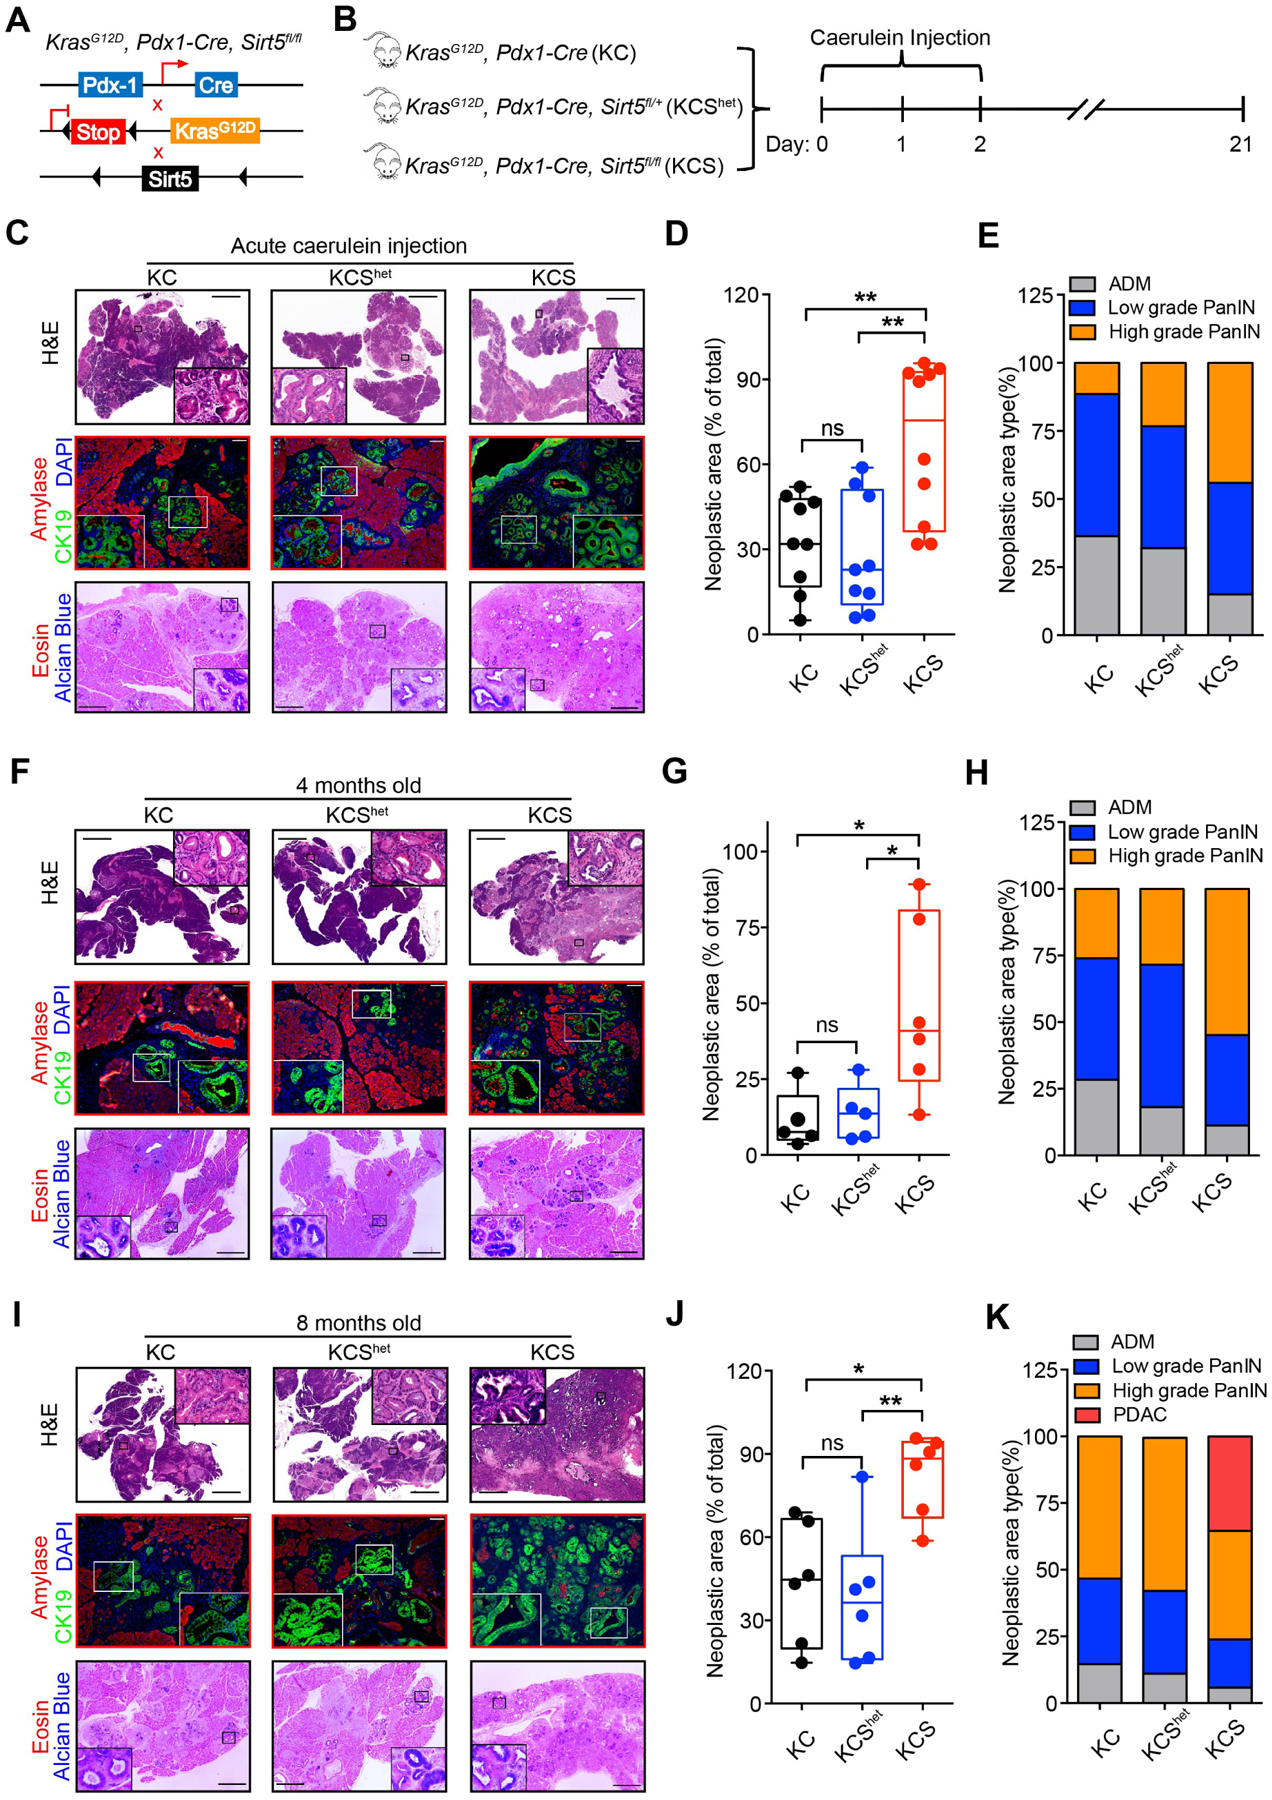
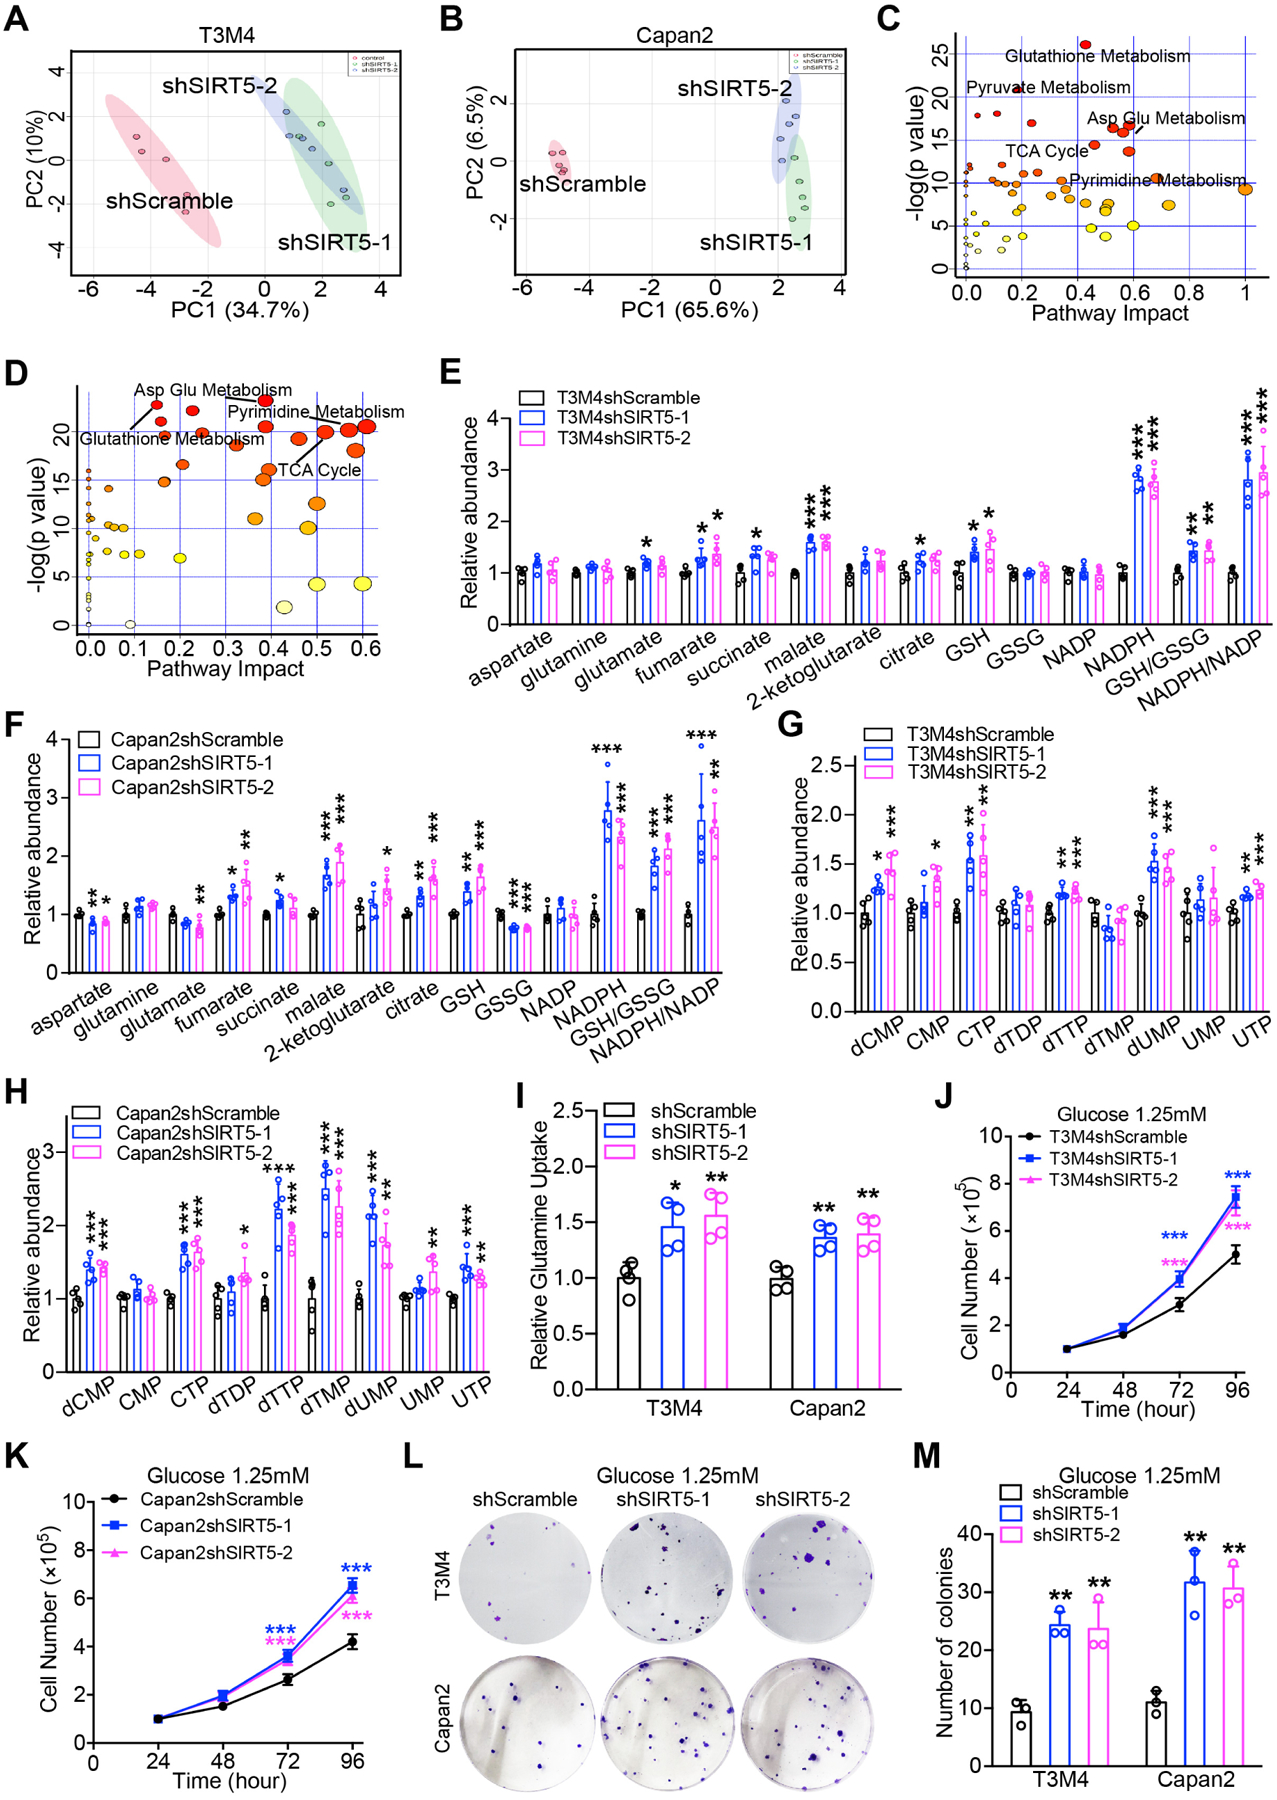
Methods: Published datasets and tissue arrays with SIRT5 staining were used to investigate the clinical relevance of SIRT5 in PDAC. Furthermore, to define the role of SIRT5 in the carcinogenesis of PDAC, we generated autochthonous mouse models with conditional Sirt5 knockout. Moreover, to examine the mechanistic role of SIRT5 in PDAC carcinogenesis, SIRT5 was knocked down in PDAC cell lines and organoids, followed by metabolomics and proteomics studies. A novel SIRT5 activator was used for therapeutic studies in organoids and patient-derived xenografts.

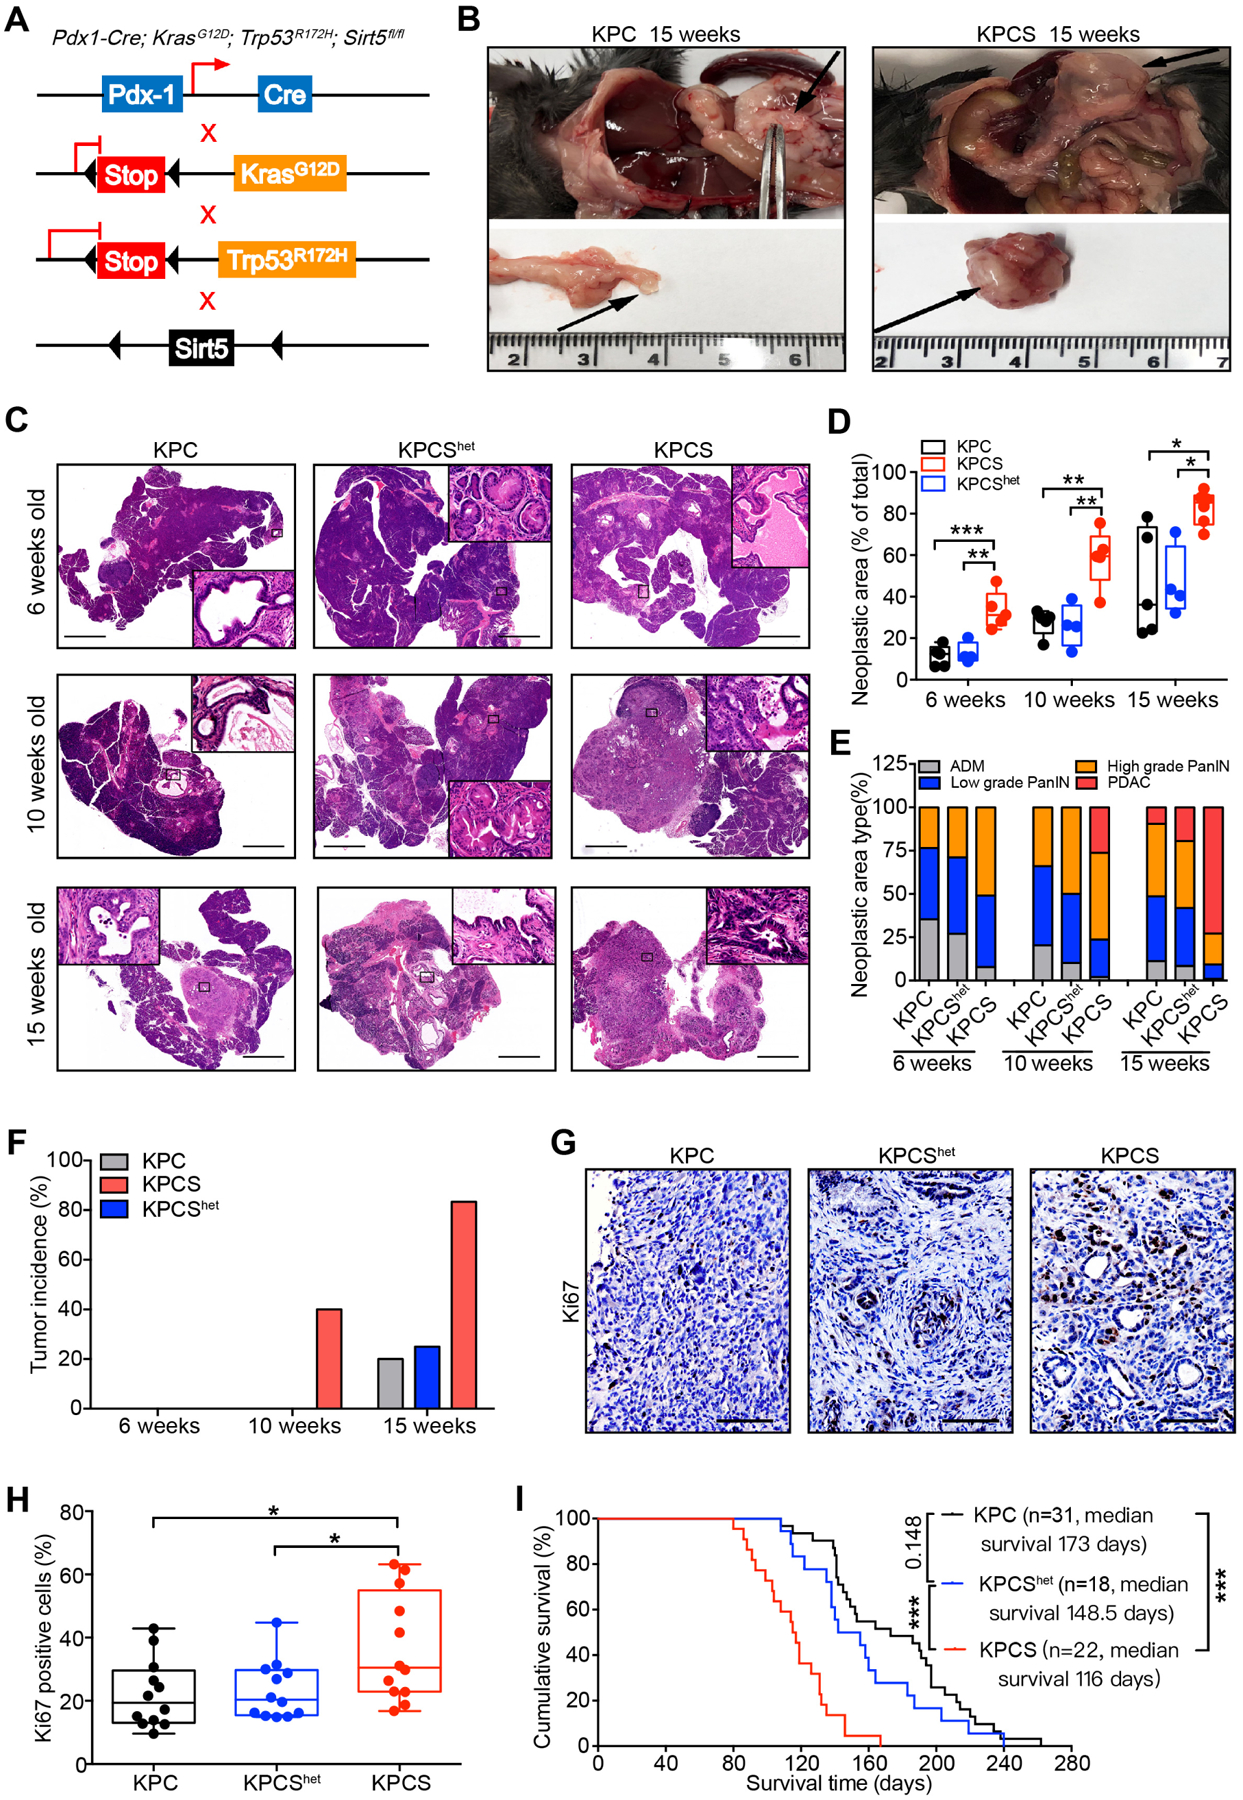
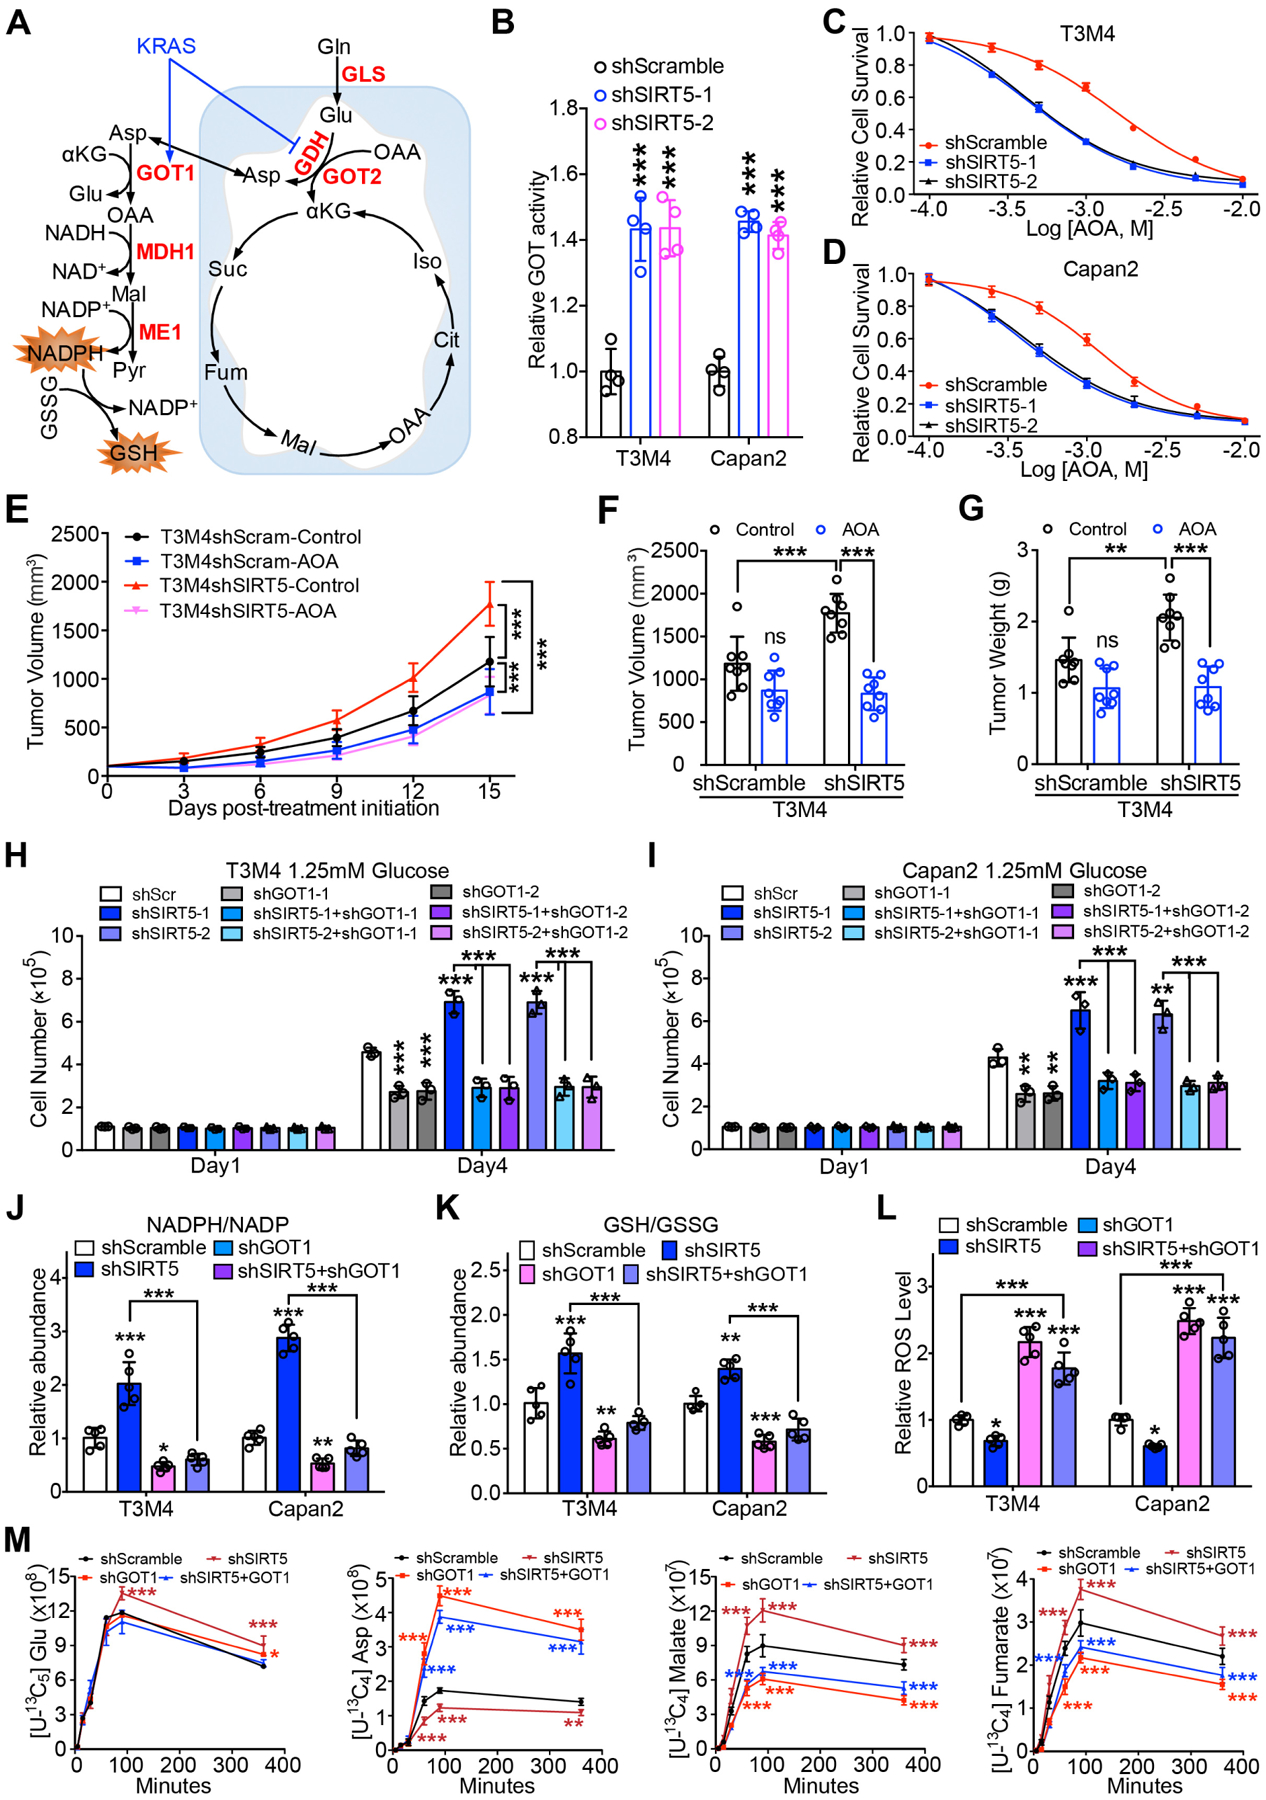
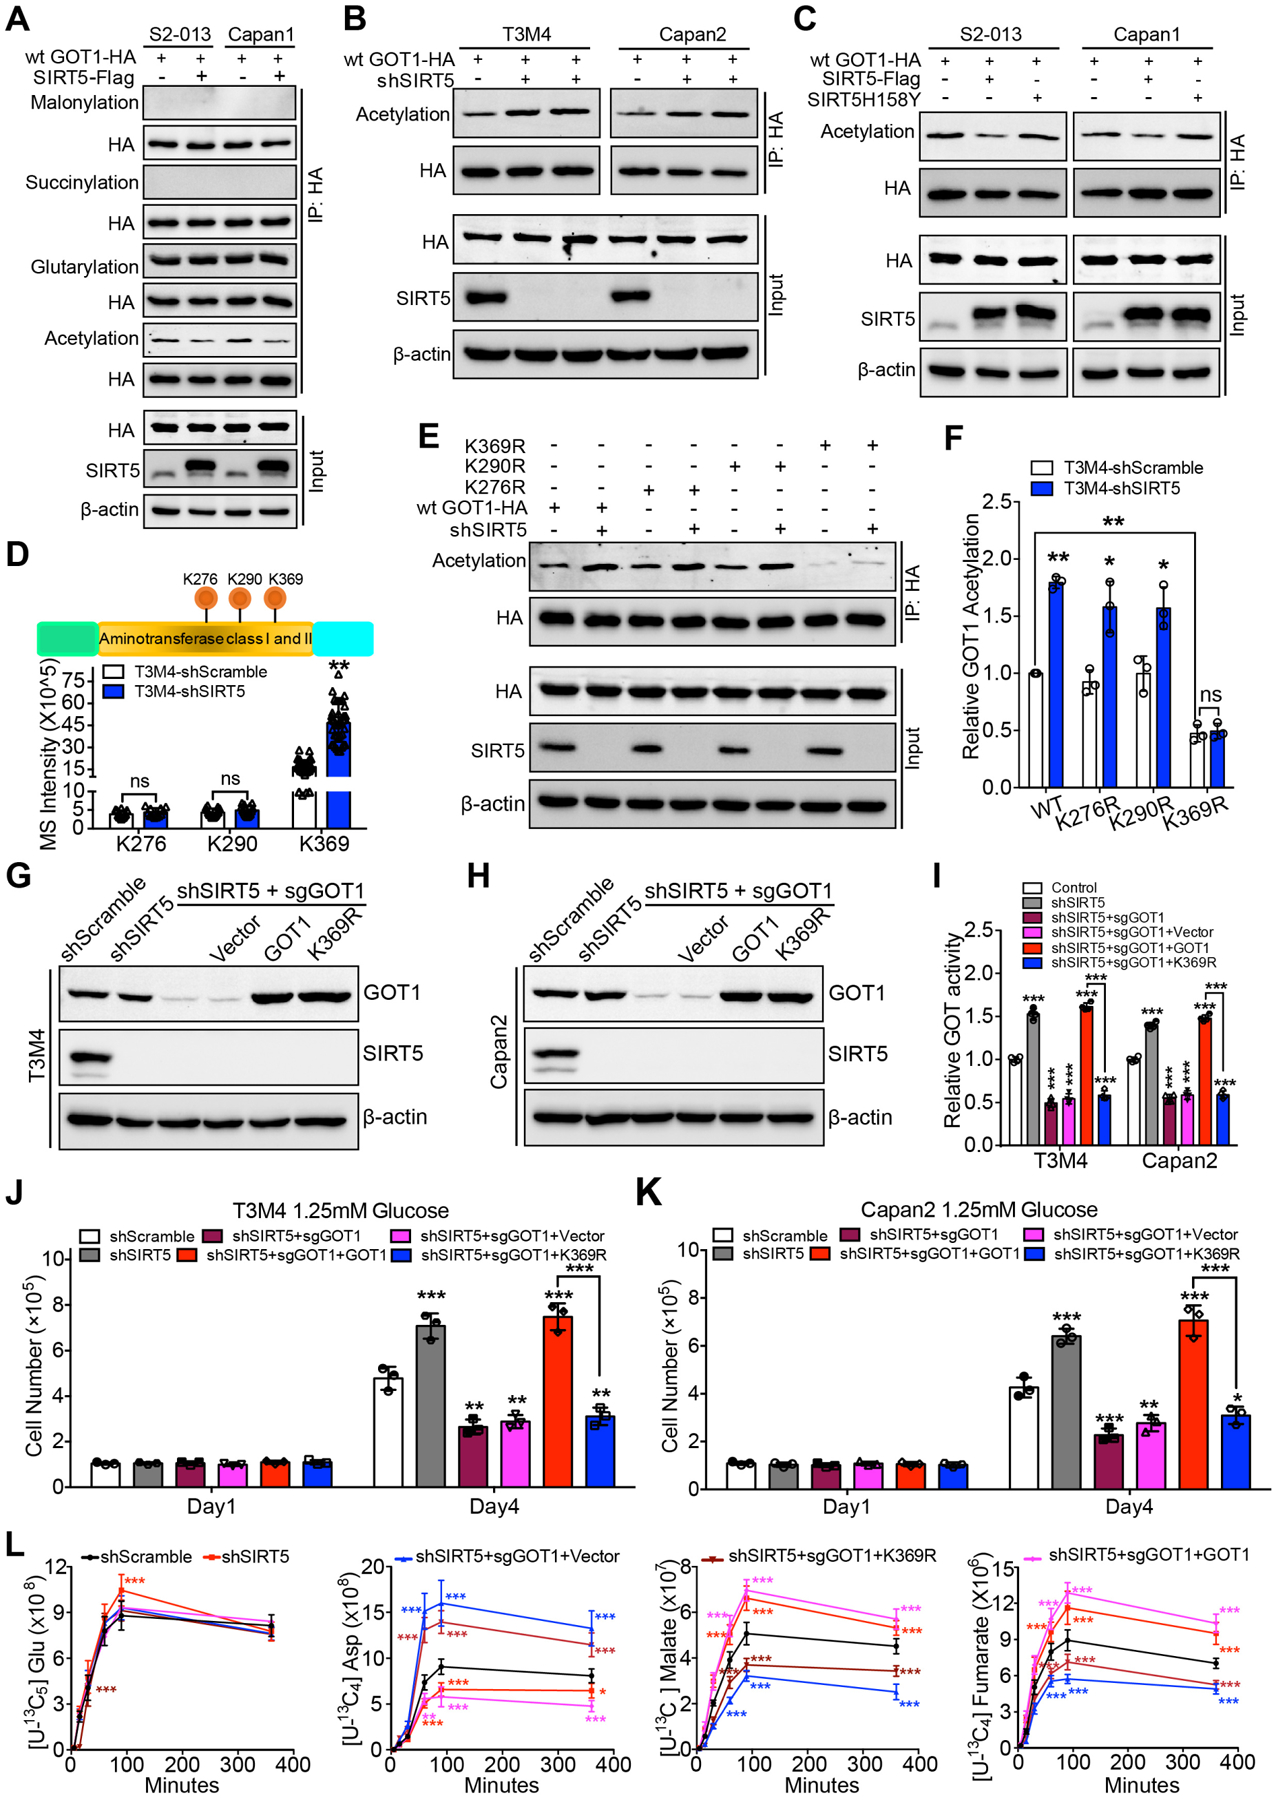
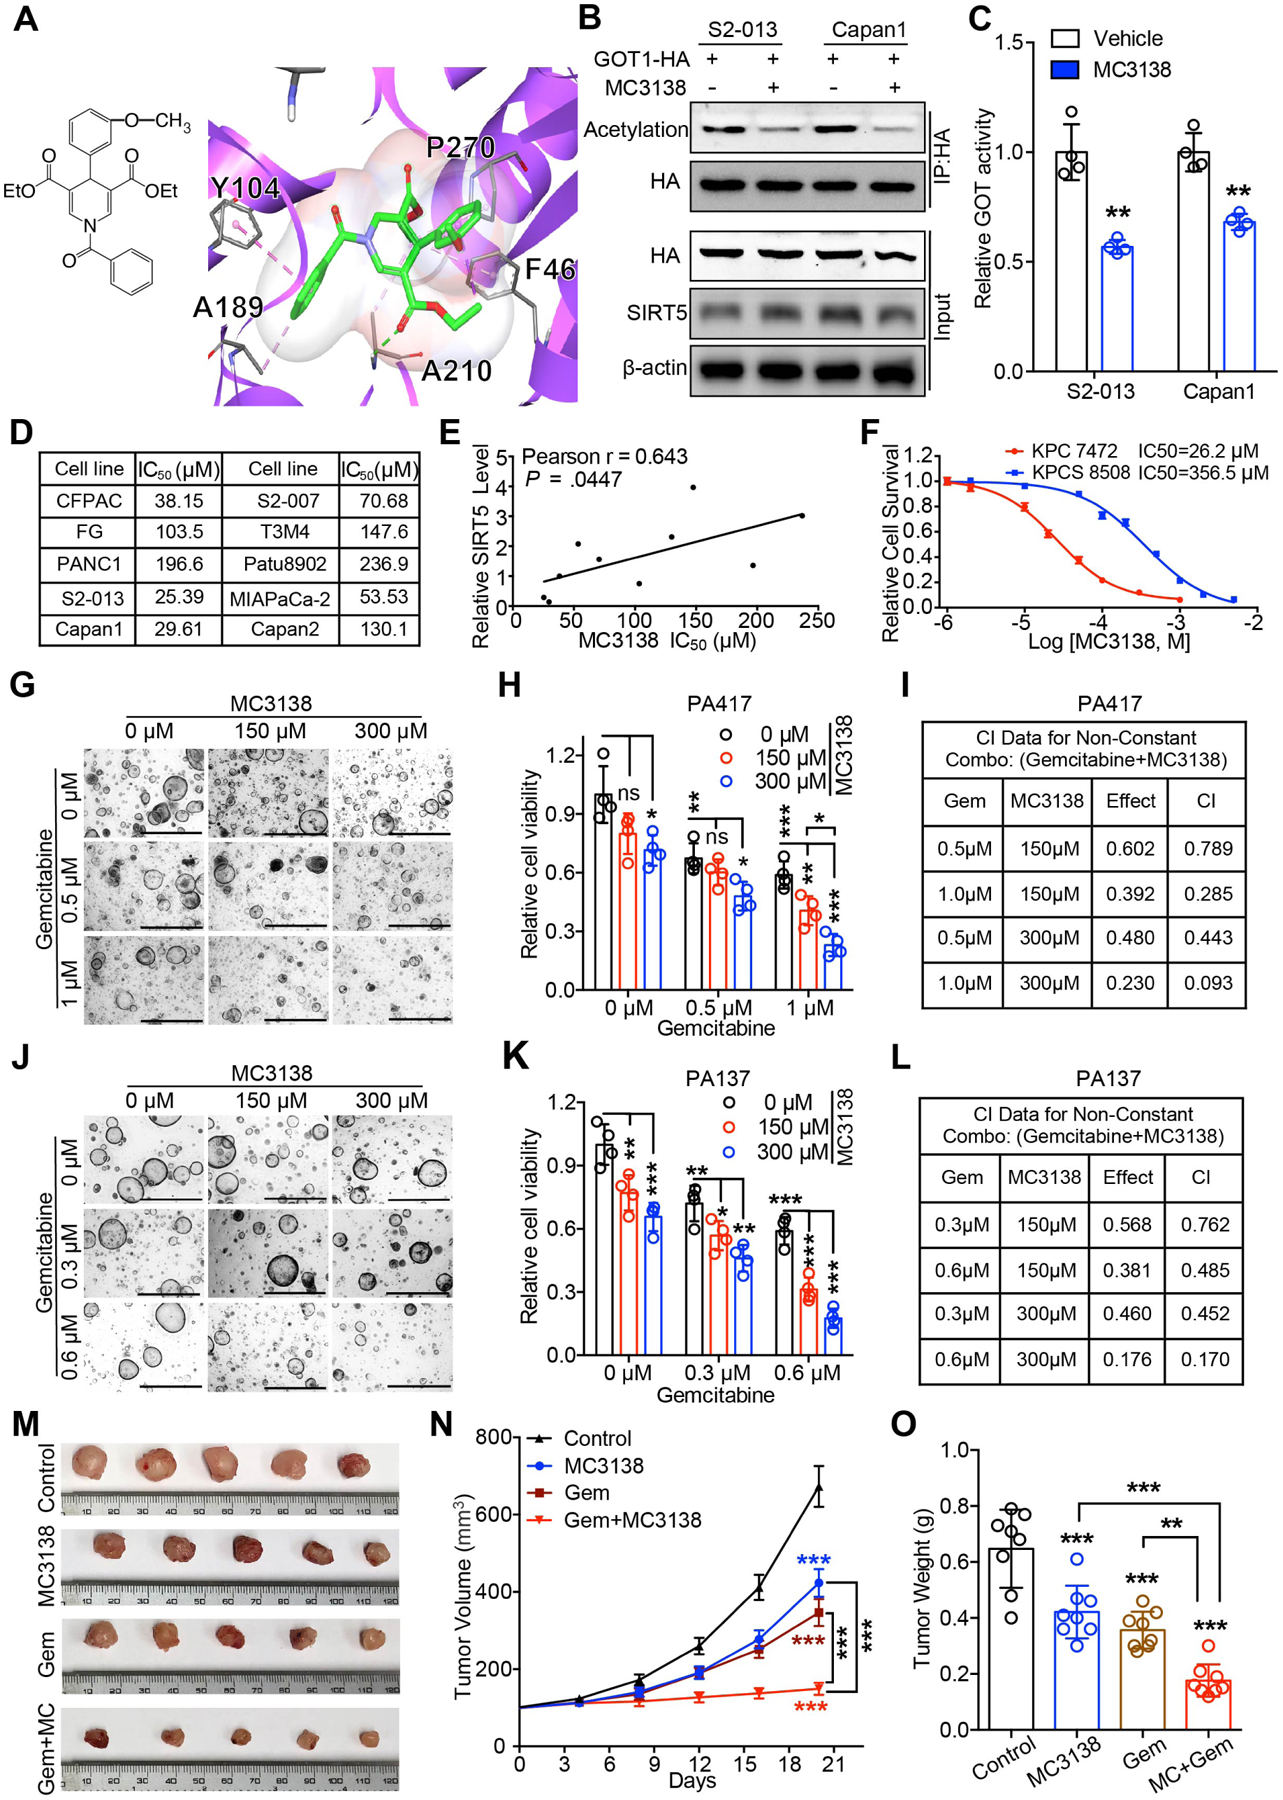
Results: SIRT5 expression negatively regulated tumor cell proliferation and correlated with a favorable prognosis in patients with PDAC. Genetic ablation of Sirt5 in PDAC mouse models promoted acinar-to-ductal metaplasia, precursor lesions, and pancreatic tumorigenesis, resulting in poor survival. Mechanistically, SIRT5 loss enhanced glutamine and glutathione metabolism via acetylation-mediated activation of GOT1. A selective SIRT5 activator, MC3138, phenocopied the effects of SIRT5 overexpression and exhibited antitumor effects on human PDAC cells. MC3138 also diminished nucleotide pools, sensitizing human PDAC cell lines, organoids, and patient-derived xenografts to gemcitabine.

Conclusions: Collectively, we identify SIRT5 as a key tumor suppressor in PDAC, whose loss promotes tumorigenesis through increased noncanonic use of glutamine via GOT1, and that SIRT5 activation is a novel therapeutic strategy to target PDAC.

Keywords: GOT1; Glutamine Metabolism; Glutathione Metabolism; Pancreatic Cancer; SIRT5.


Conflict of interest statement

Conflict of Interest: The authors declare no conflict of interest

Figures

Figure 1.
Figure 1.
SIRT5 downregulation in PDAC correlates with disease progression, poor survival outcomes, and enhanced tumor cell growth. (A). SIRT5 mRNA levels in pancreatic cancer tissues and the paired adjacent normal tissues from GEO database. (B–D). Sirt5 mRNA (B) and protein (C–D) levels in 25-week old Cre control and KPC pancreatic cancer tissues. (E–F). IHC staining and quantification for SIRT5 expression in normal acinar cells, low-grade and high-grade PanINs, and pancreatic tumors. Scale bar 100 μm. (G). Representative IHC staining for SIRT5 expression in pancreatic cancer tissue microarrays. Scale bar 500 μm. (H–I). Survival analysis of pancreatic cancer patients categorized by low and high SIRT5 expression. (J–K). Representative images and cell viability for control and SIRT5-knockdown organoids cultured for 7 days. Scale bar 1000 μm. (L–N). Representative image, tumor volume (mean ± SE) and tumor weight of control and SIRT5-knockdown tumors. (O–P). Ki67 staining and quantitation in control and SIRT5-knockdown tumors. Scale bar 100 μm. For all in vitro studies n ≥ 3. The data are represented as mean ± SD. Paired Student’s t-test (A, B, D), one-way ANOVA with Bonferroni’s test (K, N, P) or Tukey’s test (F), two-way ANOVA with Bonferroni’s test (M), Log-rank test (H-I), *P<.05, **P<.01, and ***P<.001.
Figure 2.
Figure 2.
Sirt5 deficiency accelerates acinar-to-ductal metaplasia, PanIN formation, and pancreatic tumorigenesis. Cre: Pdx1-Cre; KC: KrasG12D, Pdx1-Cre; KCShet: KrasG12D, Pdx1-Cre, Sirt5fl/+; KCS: KrasG12D, Pdx1-Cre, Sirt5fl/fl. (A). Genetic strategy for investigating the function of Sirt5 in KrasG12D-driven pancreatic tumorigenesis. (B). Intraperitoneally caerulein-injected KC (n = 9), KCShet (n = 9), and KCS (n = 10) mice were sacrificed at day 21. (C). H&E, CK19/Amylase, and Alcian blue/eosin staining of pancreatic tissue from caerulein-injected KC, KCShet, and KCS mice. Scale bars 2000 μm (H&E), 100 μm (immunofluorescence), or 500 μm (Alcian blue/eosin staining). (D). The percentage of total PanIN area over the whole pancreatic tissue section from caerulein-treated mice. (E). Histopathologic analysis of pancreatic tissue sections from caerulein-treated mice. (F and I). H&E, CK19/Amylase, and Alcian blue/eosin staining of pancreatic tissue sections from 4-month-old (F) and 8-month-old (I) KC, KCShet, and KCS mice. (G). Percentage of PanIN lesions over the whole pancreatic tissue section from 4-month-old KC (n = 5), KCShet (n = 5), and KCS mice (n = 6). (H and K). Histopathologic analysis of 4-month-old (H) and 8-month-old (K) KC, KCShet, and KCS mice tissue slides. (J). Percentage of PanIN lesion area over the whole pancreatic tissue section from 8-month-old KC (n = 6), KCShet (n = 6), and KCS mice (n = 6). The data are represented as mean ± SD. One-way ANOVA with Tukey’s test was used for all panels, *P<.05, **P<.01, and ***P<.001.
Figure 3.
Figure 3.
Genomic ablation of Sirt5 promotes PDAC progression. (A). Genetic strategy for investigating the function of the Sirt5 in KrasG12D and Trp53R172H-driven pancreatic tumorigenesis. (B). Representative images of pancreatic tumors in 15-week-old KPC and KPCS mice. (C). Representative H&E-stained images of the pancreatic tissue from age-matched KPC (n = 5), KPCShet (n = 4), and KPCS (n = 5) mice at 6, 10, and 15 weeks. Scale bars 2000 μm. (D). Percentage of PanIN and PDAC lesion area over the whole pancreatic tissue sections from KPC, KPCShet, and KPCS mice at the indicated age. (E). Histopathologic analysis of pancreatic tissues from KPC, KPCShet, and KPCS mice at indicated age. (F). Tumor incidence in KPC, KPCShet, and KPCS cohorts at the indicated age. (G–H). Ki67 staining and quantification in pancreatic tumor tissues from KPC, KPCShet, and KPCS mice. Scale bars 100 μm. (I). Kaplan-Meier survival analysis of the KPC, KPCShet, and KPCS mice (Log-rank test). The data are represented as mean ± SD. One-way ANOVA with Tukey’s test for panels D & H, *P<.05, **P<.01, and ***P<.001.
Figure 4.
Figure 4.
SIRT5 suppresses glutamine and glutathione metabolism, and regulates cellular redox homeostasis. (A–B). Principal component analysis of metabolic profiles from control and SIRT5-knockdown cells (n= 5). (C–D). Metabolic pathway analysis of significantly dysregulated metabolites in control and SIRT5-knockdown cells. (E–F). Significantly different metabolites in glutamine and glutathione metabolism from control and SIRT5-knockdown cells. (G–H). Significantly different metabolites in pyrimidine metabolism from control and SIRT5-knockdown cells. (I). Relative glutamine uptake in control and SIRT5-knockdown cells. (J–K). Growth curves of control and SIRT5-knockdown cells cultured under low glucose conditions (1.25 mM). (L–M). Colony formation assays for control and SIRT5-knockdown cells under low glucose conditions (1.25 mM). For all in vitro studies n ≥ 3. The data are represented as mean ± SD. One-way ANOVA with Bonferroni’s test (E-I, M), two-way ANOVA with Bonferroni’s test (J-K), *P<.05, **P<.01, and ***P<.001.
Figure 5.
Figure 5.
SIRT5 inhibits glutamine and glutathione metabolism by decreasing GOT1 enzyme activity. (A). The schematic illustration of the Kras-regulated glutamine and glutathione metabolism in mutant Kras-driven PDAC. (B). Relative GOT enzyme activity in control and SIRT5-knockdown cells. (C–D). Relative survival of control and SIRT5-knockdown cells treated with GOT inhibitor AOA. Data are normalized to the respective untreated group. (E–G). Effect of AOA treatment on T3M4 shScramble and shSIRT5 cells in vivo. Tumor growth rates at indicated time points (E). Tumor volume (F) and tumor weight in each group upon necropsy (G). (H–I). Cell growth of control and SIRT5-knockdown cells transfected with control or GOT1 shRNA under low glucose conditions (1.25 mM). Experiment for scrambled control and SIRT5-knockdown cells transfected with GOT1 or GOT2 shRNA were set up together with common controls. (J–K). Relative NADPH/NADP ratio (J) or GSH/GSSG ratio (K) in control, GOT1-knockdown, SIRT5-knockdown, and SIRT5/GOT1-double-knockdown cells. GSH, reduced glutathione; GSSH, oxidized glutathione. (L). Relative intracellular ROS levels in the indicated cells. ROS-insensitive carboxy-DCFDA (CDCFDA) dye was used as a negative control. (M). Kinetic flux analysis of 13C-labeled glutamine carbon incorporation into downstream metabolites in control, GOT1-knockdown, SIRT5-knockdown, and SIRT5/GOT1-double-knockdown T3M4 cells. Asp, aspartate; Glu, glutamate. For all in vitro studies n ≥ 3. The data are represented as mean ± SD. One-way ANOVA with Bonferroni’s test (B) or Tukey’s test (F–L), two-way ANOVA with Tukey’s test (E) or Bonferroni’s test (M), *P<.05, **P<.01, and ***P<.001.
Figure 6.
Figure 6.
SIRT5 inhibits GOT1 enzymatic activity by catalyzing its lysine deacetylation. (A). The lysine acetylation, glutarylation, succinylation, and malonylation levels of GOT1 protein immunoprecipitated from control and SIRT5-overexpressing PDAC cells. Input are shown below. (B). The lysine acetylation level of GOT1 protein immunoprecipitated from control and SIRT5-knockdown T3M4/Capan2 cells. Input are shown below. (C). The lysine acetylation level of GOT1 protein immunoprecipitated from PDAC cells transfected with vector, SIRT5, and mutant SIRT5-H158Y plasmid. Input are shown below. (D). Exogenous GOT1 protein immunoprecipitated from control and SIRT5-knockdown T3M4 cells was subjected to proteomic analysis. Top, schematic representation of three acetylation sites identified in GOT1; Bottom, the mass spectrometric signal intensity of indicated acetylation sites in GOT1. (E–F). Wild-type GOT1, GOT1-K276R, GOT1-K290R, and GOT1-K369R mutant plasmids were transfected into control and SIRT5-knockdown T3M4 cells. The lysine acetylation levels of GOT1 protein immunoprecipitated from above cells, input are shown below (E). The quantification of relative lysine acetylation level of indicated acetylation sites (F). (G–H). The immunoblotting of SIRT5 and GOT1 levels in scrambled control cells, SIRT5-knockdown cells, and SIRT5-knockdown/GOT1-knockout cells transfected with vector, GOT1, or GOT1-K369R plasmid. (I). The GOT enzyme activity in scrambled control cells, SIRT5-knockdown cells, and SIRT5-knockdown/GOT1-knockout cells transfected with vector, GOT1, or GOT1-K369R plasmids. (J–K). Cell growth analysis of scrambled control cells, SIRT5-knockdown cells, and SIRT5-knockdown/GOT1-knockout cells transfected with vector, GOT1, or GOT1-K369R plasmids, cultured under low glucose conditions (1.25 mM). (L). Kinetic flux analysis of 13C-labeled glutamine carbon incorporation into downstream metabolites in scrambled control cells, SIRT5-knockdown cells, or SIRT5-knockdown/GOT1-knockout cells transfected with vector, wild-type GOT1, or GOT1-K369R plasmids. For all in vitro studies n ≥ 3. The data are represented as mean ± SD. Student’s t-test (D, F), one-way ANOVA with Tukey’s test (I-K), two-way ANOVA with Tukey’s test (L), *P<.05, **P<.01, and ***P<.001.
Figure 7.
Figure 7.
SIRT5 activator MC3138 exhibits anti-tumor effects and synergism with gemcitabine in human PDAC cells, organoids, and PDX models. (A). The chemical structure of SIRT5 activator MC3138 and an enlarged view of Sirt5 docked with MC3138. Protein is shown in purple flat ribbon and compound is depicted via a stick model. (B). The lysine acetylation level of GOT1 protein immunoprecipitated from PDAC cells treated with DMSO or 10 μM MC3138 for 24 h. Input are shown below. (C). The GOT enzyme activity in PDAC cells treated with DMSO or 10 μM MC3138 for 24 h. (D). IC50 data of ten wild-type PDAC cell lines treated by MC3138. (E). Pearson’s correlation analysis between SIRT5 protein level (from Figure S1L) and IC50 of MC3138 in PDAC cell lines. (F). Relative cell survival of KPC cell and SIRT5-knockout KPC cell (KPCS) treated with MC3138. (G–H, J–K). Representative images and cell viability of PDAC organoids PA417 (G–H) and PA137 (J–K) treated with indicated concentration of gemcitabine and MC3138 for 72 h. (I, L). Combination index (CI) of gemcitabine and MC3138 at indicated concentrations. ‘Effect’ in the Table refers to the relative cell survival upon the combination therapy treatment. (M–O). Effect of MC3138 in combination with gemcitabine on PDX (PA137) model. Representative tumor images upon necropsy (M). Tumor volumes are represented as mean ± SEM (N). Tumor weight upon necropsy (O). Gem: Gemcitabine; MC: MC3138. For all in vitro studies n ≥ 3. The data are represented as mean ± SD. Student’s t-test (C), one-way ANOVA with Tukey’s test (H, K, O), two-way ANOVA with Tukey’s test (N), *P<.05, **P<.01, and ***P<.001.

Comment in

  • SIRT5's GOT1 up on PDAC.
    Kumar S, Lombard DB. Kumar S, et al. Gastroenterology. 2021 Nov;161(5):1376-1378. doi: 10.1053/j.gastro.2021.07.020. Epub 2021 Jul 16. Gastroenterology. 2021. PMID: 34280390 Free PMC article. No abstract available.

References

    1. Derle A, De Santis MC, Gozzelino L, et al. The role of metabolic adaptation to nutrient stress in pancreatic cancer. Cell Stress 2018;2:332–339. - PMC - PubMed
    1. Vernucci E, Abrego J, Gunda V, et al. Metabolic Alterations in Pancreatic Cancer Progression. Cancers (Basel) 2019;12. - PMC - PubMed
    1. Chaika NV, Yu F, Purohit V, et al. Differential expression of metabolic genes in tumor and stromal components of primary and metastatic loci in pancreatic adenocarcinoma. PLoS One 2012;7:e32996. - PMC - PubMed
    1. Gebregiworgis T, Purohit V, Shukla SK, et al. Glucose Limitation Alters Glutamine Metabolism in MUC1-Overexpressing Pancreatic Cancer Cells. J Proteome Res 2017;16:3536–3546. - PMC - PubMed
    1. Son J, Lyssiotis CA, Ying H, et al. Glutamine supports pancreatic cancer growth through a KRAS-regulated metabolic pathway. Nature 2013;496:101–5. - PMC - PubMed

Publication types

MeSH terms