. 2021 Aug 17;120(16):3303-3314.
doi: 10.1016/j.bpj.2021.05.031. Epub 2021 Jul 9.

isoSTED microscopy with water-immersion lenses and background reduction

Affiliations

isoSTED microscopy with water-immersion lenses and background reduction

René Siegmund et al. Biophys J. .

Abstract

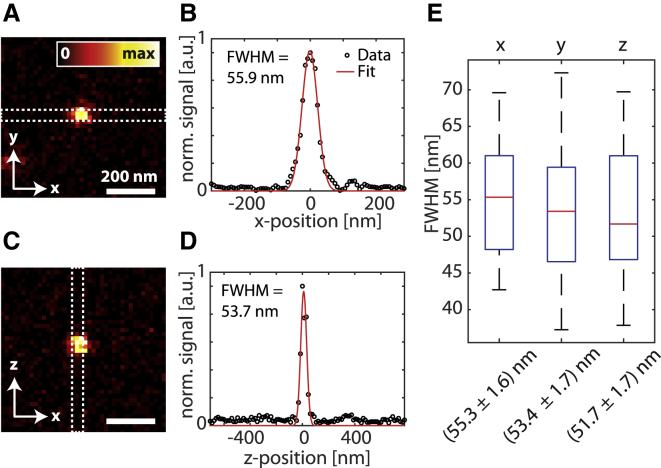
Fluorescence microscopy is an excellent tool to gain knowledge on cellular structures and biochemical processes. Stimulated emission depletion (STED) microscopy provides a resolution in the range of a few 10 nm at relatively fast data acquisition. As cellular structures can be oriented in any direction, it is of great benefit if the microscope exhibits an isotropic resolution. Here, we present an isoSTED microscope that utilizes water-immersion objective lenses and enables imaging of cellular structures with an isotropic resolution of better than 60 nm in living samples at room temperature and without CO2 supply or another pH control. This corresponds to a reduction of the focal volume by far more than two orders of magnitude as compared to confocal microscopy. The imaging speed is in the range of 0.8 s/μm3. Because fluorescence signal can only be detected from a diffraction-limited volume, a background signal is inevitably observed at resolutions well beyond the diffraction limit. Therefore, we additionally present a method that allows us to identify this unspecific background signal and to remove it from the image.


Figures

Figure 1
Figure 1
isoSTED microscope for live-cell imaging. The beams for excitation, STEDxy, and STEDz are combined using an appropriate set of dichroic mirrors and directed through the beam scanner into the cavity exhibiting two opposing water-immersion objective lenses. A vortex-phase plate imprints a helical phase pattern onto the STEDxy beam. Telescopes in the excitation and STED beam paths allow us to adjust the respective beam diameters and to axially overlap the individual foci. Polarization optics, such as HWPs and a Glan-Thompson-prism (GTP), are used to control the polarization states for each laser beam, and acousto-optic modulators (AOMs) allow us to switch the illumination on and off on the single-pixel level. The emitted fluorescence, collected by both objective lenses, is descanned by the beam scanner, separated from the laser light by a dichroic mirror and a set of filters (band and short pass), and focused onto the common end of a 1-to-7 fan-out fiber. Thereby, the individual fiber cores act as detection pinholes for the central detection channel as well as for the offset detection channels. The fluorescence is detected by SPCMs. A removable pellicle beam splitter and a PMT are used to align the laser beams by means of reflection measurements on gold nanoparticles.
Figure 2
Figure 2
isoSTED measurement on 48 nm diameter crimson fluorescent microspheres: exemplary x-y section (A) and x-z section (C) through the center of a single microsphere. Dashed white boxes indicate the direction and averaging of the line profiles in (B) and (D). The fit of a Gaussian function to the profiles yields a size of the microsphere image of lateral 55.9 nm and axial 53.7 nm. (E) Box plots of FWHM distributions of 28 microspheres in x, y, and z directions. Red marks indicate the respective median, the bottom and the top edges of the blue boxes indicate the 25th and 75th percentiles and the most extreme values are indicated by the whiskers in each direction. As a consequence, the resolution of the isoSTED microscope is better than 56 nm in all three spatial directions. The color bar in (A) also applies to (C). a.u., arbitrary unit. Scale bars (A, C), 200 nm.
Figure 3
Figure 3
isoSTED measurement of microtubules in living HDF cells: (A) lateral and axial line profiles through a single microtubule as depicted in the x-y section. Gaussian fits show a lateral resolution of 55.4 nm and an axial resolution of 47.2 nm. (B) Histograms of the lateral and axial resolutions obtained by fitting Gaussian functions to 59 lateral and axial line profiles. The average values are FWHMxy = 59.2 ± 1.0 nm and FWHMz = 49.6 ± 1.2 nm. (C and D) Filaments separated by 89.3 nm laterally and 57.4 nm axially can be clearly resolved. In (D), three axially adjacent and 30 nm spaced x-y sections are shown. The color bar in (A) also applies to (C) and (D). Scale bars (A), 500 nm; (C, D), 1 µm.
Figure 4
Figure 4
isoSTED measurement of the microtubule network in living HDF cells: (A) x-y section through the raw data. The dashed white line indicates the approximate position of the nuclear envelope. (B) Illustration of an x-z section through a cell and the orientation of the filaments therein: in axially nonrestricted regions, filaments arrange in a 3D network. This is not the case in regions where the nuclear envelope and the plasma membrane restrict the axial extent. The hatched region indicates the position of the depicted x-y section. (C) Magnified view of the ROI indicated in (A). x-z sections at the indicated y positions are shown in (D). (E and F) Exemplary lateral and axial intensity profiles along the dashed white lines in (D). The graphs in magenta and blue represent the profiles for the second and third x-z sections, respectively. The color bar in (A) also applies to (C) and (D). Scale bars (C, D), 200 nm.
Figure 5
Figure 5
x-z plane (x, y = 0, z) through simulated isoSTED PSFs: (A) 1% iso-intensity lines of the simulated effective excitation PSF (solid line) and the detection probability (pinhole size = 0.84 Airy units, dashed line). In addition to the main focus, highlighted in blue, fluorescence can also be emitted in other regions. (B) Intensity profiles along the z axis (x = y = 0, z) show that the intensity of the side lobes is well below 10% and comparable to intensity of the axially more distant OOFC. (C) Simplified illustration of (A). The OOFCs are illustrated by hatched areas and the main focus by a circle. Note that the axial shift of the STEDz depletion patterns with respect to the foci of the excitation and STEDxy beams, as stated in the Material and methods, has been considered in the simulation.
Figure 6
Figure 6
Illustration of two scenarios while imaging filaments within a cell: (A) in thin sample regions, only the main focus contributes to the signal. In axially extended sample areas, the OOFCs also contribute to the signal. (B) A laterally shifted point-like detector can be used to detect portions of the OOFCs.
Figure 7
Figure 7
Experimental realization of offset detection: (A) common end of the 1-to-7 fan-out fiber used for the detection. Six offset fibers are arranged hexagonally around the main fiber (CH0, orange). Only three offset fibers are used for OOFC detection channels (CH1, CH2, and CH3, cyan). (B) Reflection measurement on gold nanoparticles indicating the positions of the detection channels in the focal plane. Scale bars (A), 50 µm; (B), 1 µm.
Figure 8
Figure 8
OOFC determination by offset detection: (A) smoothed central x-z section through a 250 nm microsphere, recorded with CH0. White arrows indicate the plane of maximal OOFCs. The color table is chosen such that the OOFCs are clearly visible. (B) Lateral sections through this plane recorded with CH0, CH1, CH2, and CH3. (C) Scaled sum of CH1, CH2, and CH3. The color bar in (B) also applies to (C). Scale bars (A, B), 500 nm.
Figure 9
Figure 9
OOFC-corrected imaging: (A) same x-y section from a recording of the microtubule network in a living HDF cell as depicted in Fig. 4A. (B) After OOFC removal, the blur in region I has almost completely disappeared. The high image quality in region II is maintained. (C and D) RL deconvolution of the data shown in (A) and (B) improves the image quality even further. The color bar in (A) applies to all panels. Scale bars (A - D), 1 µm.
Figure 10
Figure 10
isoSTED time-lapse volume imaging on microtubules in living HDF cells: (A) x-y sections through the same plane within three image stacks recorded at different time points (T1, T2, and T3) reveal changes in the microtubule network. The filament indicated by white arrows retracts laterally out of the displayed region, whereas the filament indicated by yellow arrows moves axially into the z plane shown. (B) In another recording, it can be observed that a filament moves out of and back into the plane shown (blue arrows). Another filament moves laterally into the displayed area (green arrows). The positions of the depicted regions within the cells are indicated in Figs. S9 and S10. The color bar in (A) also applies to (B). Scale bars (A, B), 1 µm.
Figure 11
Figure 11
Vimentin network in a living U2OS cell: (A) 3D representation of the vimentin network, in which the axial position is color coded by the color bar shown. (B) Single x-y section within the area indicated by the dashed white box in (A). (C and D) Averaged line profiles (black) and corresponding fits with a Gaussian function (red) in lateral (C) and axial (D) direction through the filament marked in (B). Scale bars (A), 2 µm; (B), 500 nm.

Comment in

References

    1. Sanderson M.J., Smith I., Bootman M.D. Fluorescence microscopy. Cold Spring Harb. Protoc. 2014;2014:top071795. - PMC - PubMed
    1. Shashkova S., Leake M.C. Single-molecule fluorescence microscopy review: shedding new light on old problems. Biosci. Rep. 2017;37 BSR20170031. - PMC - PubMed
    1. Hell S.W. Microscopy and its focal switch. Nat. Methods. 2009;6:24–32. - PubMed
    1. Hell S.W., Wichmann J. Breaking the diffraction resolution limit by stimulated emission: stimulated-emission-depletion fluorescence microscopy. Opt. Lett. 1994;19:780–782. - PubMed
    1. Hell S.W., Kroug M. Ground-state-depletion fluorescence microscopy: a concept for breaking the diffraction resolution limit. Appl. Phys. B. 1995;60:495–497.

Publication types