. 2021 Sep 15;81(18):4723-4735.
doi: 10.1158/0008-5472.CAN-21-0259. Epub 2021 Jul 9.

Autocrine GMCSF Signaling Contributes to Growth of HER2+ Breast Leptomeningeal Carcinomatosis

Affiliations

Autocrine GMCSF Signaling Contributes to Growth of HER2+ Breast Leptomeningeal Carcinomatosis

Khairul I Ansari et al. Cancer Res. .

Abstract

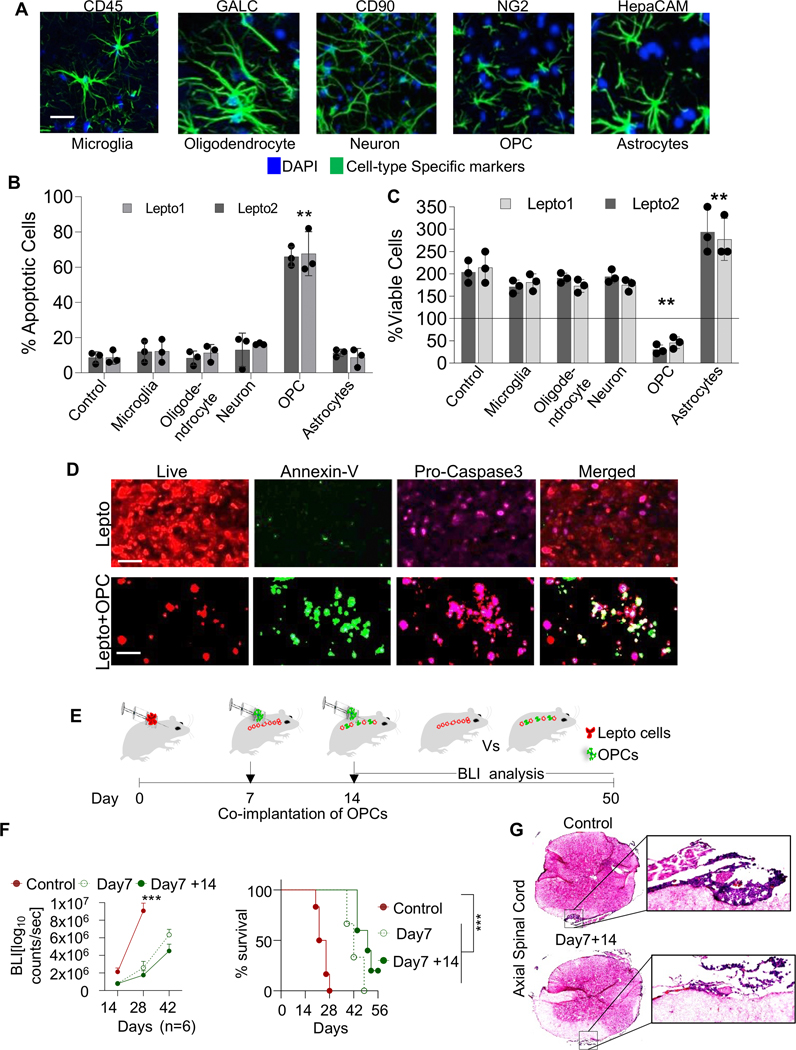
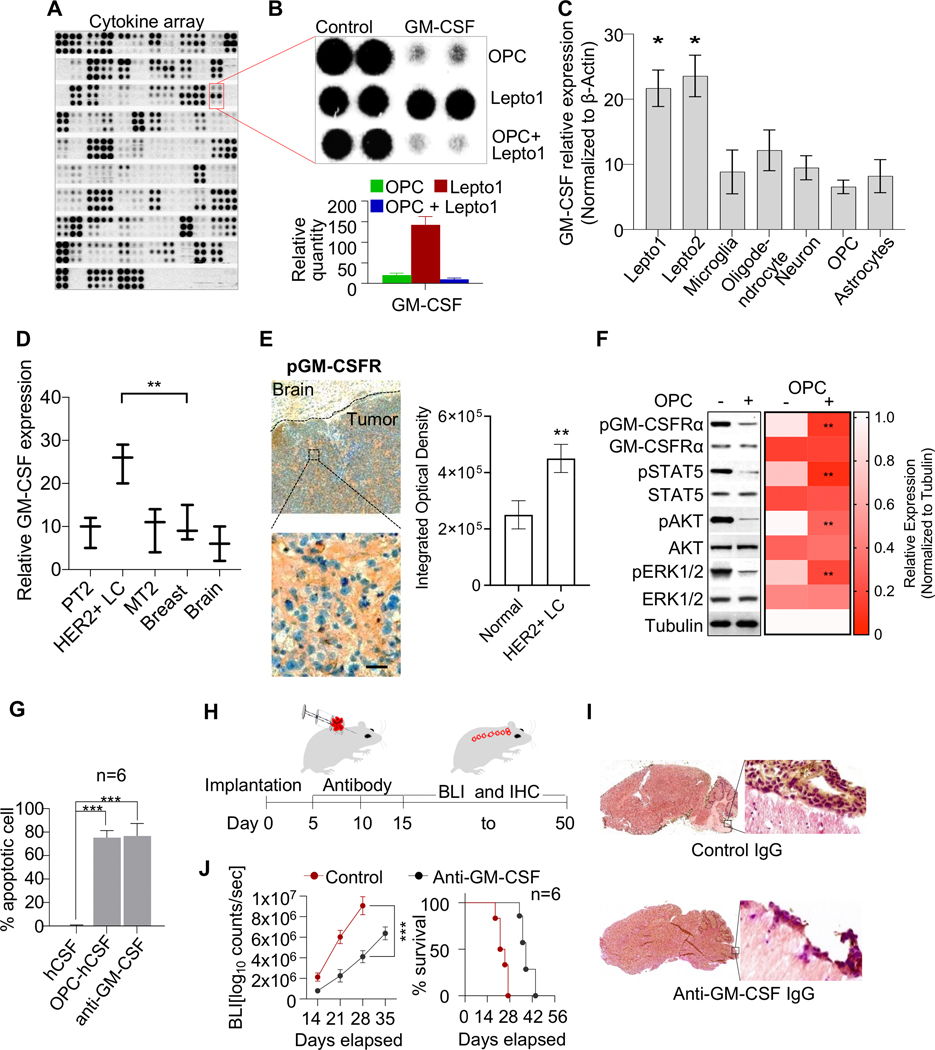
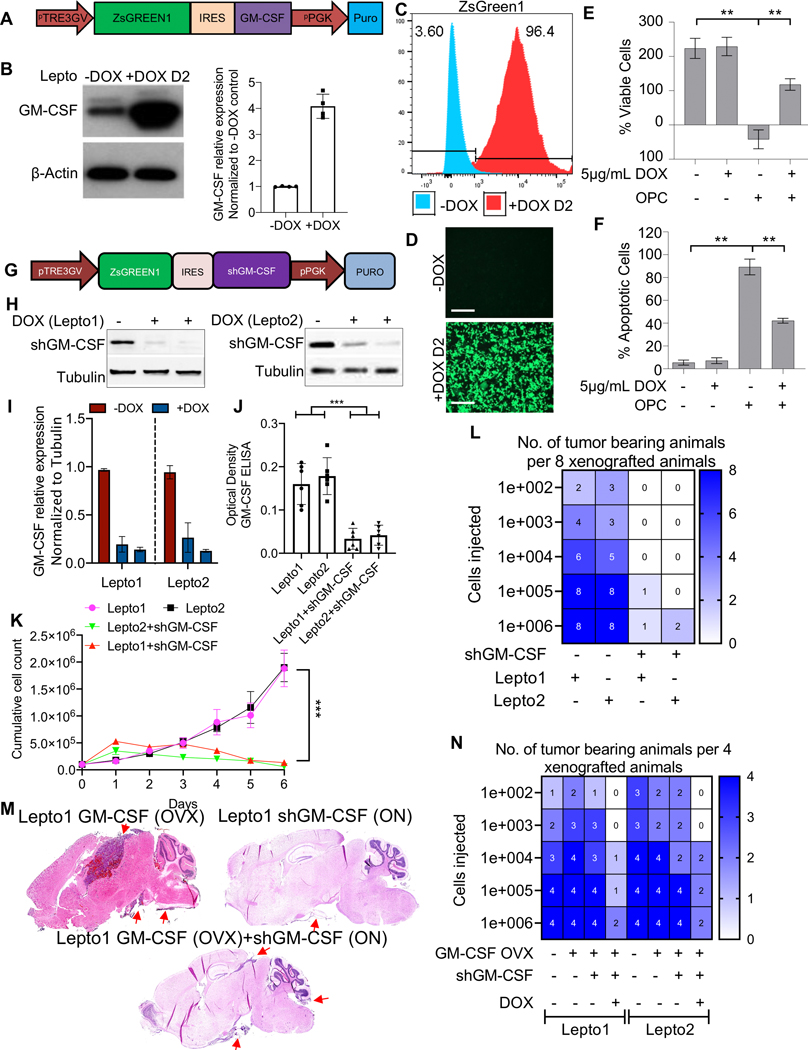
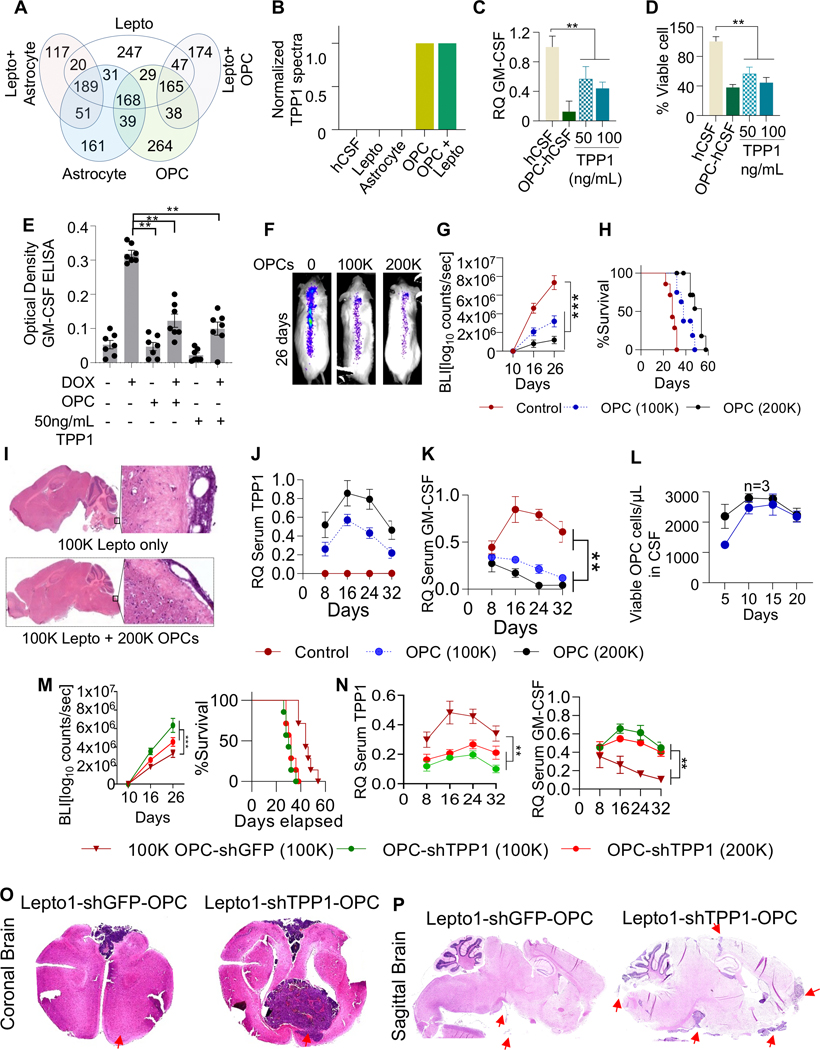
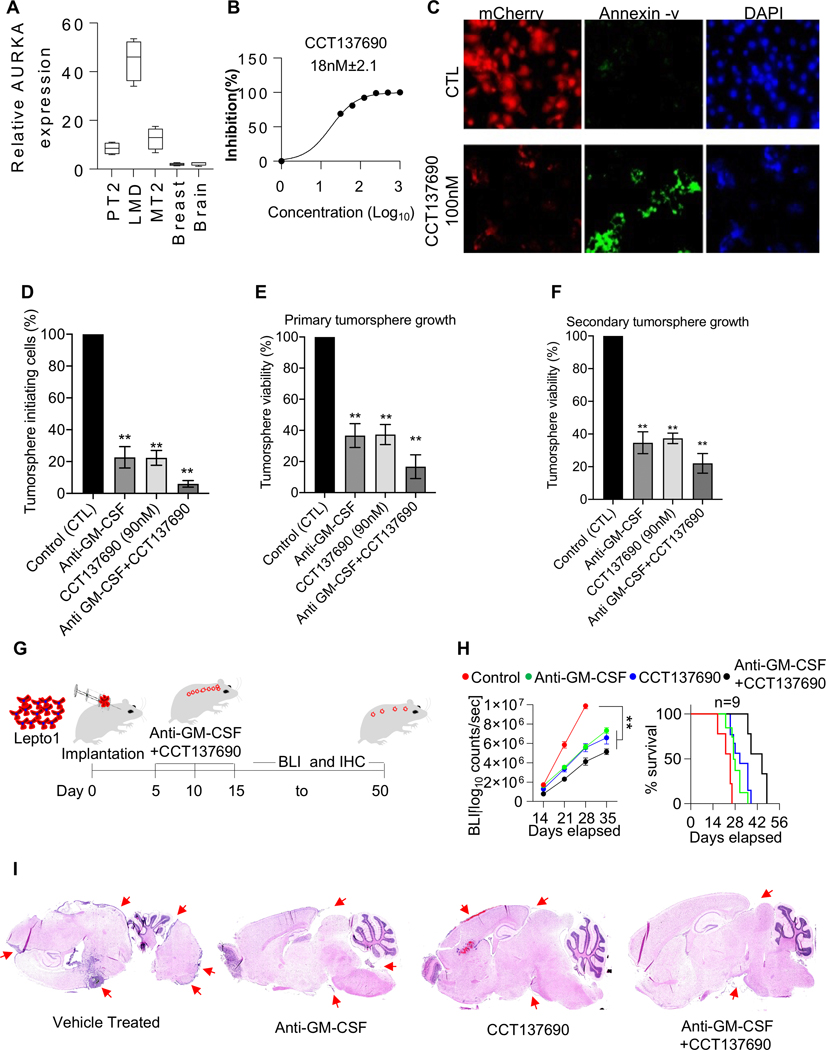
Leptomeningeal carcinomatosis (LC) occurs when tumor cells spread to the cerebrospinal fluid-containing leptomeninges surrounding the brain and spinal cord. LC is an ominous complication of cancer with a dire prognosis. Although any malignancy can spread to the leptomeninges, breast cancer, particularly the HER2+ subtype, is its most common origin. HER2+ breast LC (HER2+ LC) remains incurable, with few treatment options, and the molecular mechanisms underlying proliferation of HER2+ breast cancer cells in the acellular, protein, and cytokine-poor leptomeningeal environment remain elusive. Therefore, we sought to characterize signaling pathways that drive HER2+ LC development as well as those that restrict its growth to leptomeninges. Primary HER2+ LC patient-derived ("Lepto") cell lines in coculture with various central nervous system (CNS) cell types revealed that oligodendrocyte progenitor cells (OPC), the largest population of dividing cells in the CNS, inhibited HER2+ LC growth in vitro and in vivo, thereby limiting the spread of HER2+ LC beyond the leptomeninges. Cytokine array-based analyses identified Lepto cell-secreted GMCSF as an oncogenic autocrine driver of HER2+ LC growth. LC/MS-MS-based analyses revealed that the OPC-derived protein TPP1 proteolytically degrades GMCSF, decreasing GMCSF signaling and leading to suppression of HER2+ LC growth and limiting its spread. Finally, intrathecal delivery of neutralizing anti-GMCSF antibodies and a pan-Aurora kinase inhibitor (CCT137690) synergistically inhibited GMCSF and suppressed activity of GMCSF effectors, reducing HER2+ LC growth in vivo. Thus, OPC suppress GMCSF-driven growth of HER2+ LC in the leptomeningeal environment, providing a potential targetable axis. SIGNIFICANCE: This study characterizes molecular mechanisms that drive HER2+ leptomeningeal carcinomatosis and demonstrates the efficacy of anti-GMCSF antibodies and pan-Aurora kinase inhibitors against this disease.


Figures

Figure 1.
Figure 1.. The presence of OPCs reduces HER2+ LC cell viability
(A.) Immunofluorescence (IF) images of various CNS cell types immuno-panned from human iPSCs and stained with the indicated antibodies. Nuclei were counterstained with DAPI (blue). Scale bar=100 μm. (B.) Annexin-V FACS-based analysis of Lepto1 and Lepto2 cells (seeded at 0.5×10⁵ density/well of a 24 well plate, in the bottom chamber) co-cultured with the indicated human CNS cell populations (seeded at 0.5×10⁵ density/well of 24 well plate, in the top inserts). Co-culture with OPCs increased the proportion of apoptotic Lepto cells (n=3). **p<0.001 relative to control Lepto cells exposed to no CNS cell types. (C.) Viability of Lepto1 and Lepto2 (seeded at 0.1×10⁵ density/well of a 96 well plate, in the bottom chamber) lines co-cultured with various CNS cell types (derived in Fig. 2A) (all seeded at 0.1×10⁵ density/well of a 96 well plate, in the top inserts) for 48 h, measured using CellTiter-Glo assays (n=3). **p<0.001 relative to control Lepto cells exposed to no CNS cell types. (D.) IF images of mCherry: LUC-labeled (red) Lepto cells stained with Annexin-V (green) and Pro-Caspase 3 (magenta) after 48 h of treatment with or without OPC-conditioned medium. Scale bar=50 μm. (E.) Schematic showing the protocol used for the in vivo characterization of the effects of OPCs on Lepto cell growth. mCherry: LUC-labeled Lepto cells (100K, red) were injected into the cisternae magna of adult NOD/SCID mice on day 0, and OPCs (100K, green) were injected on days 7 and/or 14. Tumor growth was monitored by BLI from days 14 to 50, with representative images acquired starting on day 28. (F.) (Left panel) Quantitative analyses showing that the mice that received OPCs exhibited reduced tumor growth (n=6). ***p<0.001 relative to mice with OPCs implanted on days 7 and 14. (Right panel) Kaplan–Meier curves showing the overall survival of mice implanted with Lepto cells on day 0 only (solid red line) or co-implanted with OPCs on day 7 (dashed green line) or on days 7 and 14 (solid green line). ***p<0.001. (G.) Histopathologic analyses of the H&E stained axial spinal cord sections from control Lepto infused and Lepto+ OPC (OPC infusion on D7 and D14) co-infused mice on the Left and 20x magnified regions showing Lepto deposition
Figure 2.
Figure 2.. GM-CSF acts as an oncogenic autocrine driver contributing to HER2+ LC cell growth
(A.) Cytokine XL array-based analyses of conditioned media from OPCs and/or Lepto cells cultured in media supplemented with hCSF. The secreted factors identified in the media of monocultured OPCs and OPCs co-cultured with Lepto cells are listed in Supplementary table 4 and 5. (B.) (Top panel) Control and GM-CSF-specific blots from the array shown in Fig. 2A. (Bottom panel) Density-based quantification of the GM-CSF blots shown in the top panel. (C.) RT-qPCR analysis of GM-CSF transcript levels in Lepto1 and Lepto2 cells, as well as in the indicated iPSC-derived CNS cell types. The Lepto lines exhibited the highest GM-CSF mRNA levels among all cell types analyzed (n=3). *p<0.001 relative to OPCs (D.) RT-qPCR analysis of GM-CSF transcript levels in HER2+ LC tumor, HER2+ breast metastatic tumor (MT2), primary tumor (PT2), normal breast, and normal brain tissues. The HER2+ LC tumor tissues exhibited the highest GM-CSF transcript levels among all tissues analyzed (n=3). **p<0.001. (E.) (Left panel) Immunohistochemical analysis (IHC) of patient HER2+ LC specimens showing pGM-CSFRα (orange) in tumor cells but not surrounding brain tissue. (Top) Low magnification image showing tumor and surrounding normal brain tissue. (Bottom) High magnification image showing the selected tumor region. Scale bar=100 μm. (Right panel) FIJI based quantification of the IHC image analyses from n=3 patient HER2+ LC specimens showing higher levels of pGM-CSFRα in tumor cells but not in the surrounding brain tissue. (F.) (Left Panel) Western blot analysis of the indicated signaling proteins in extracts from Lepto cells cultured alone or with OPCs for 48 h. Tubulin was used as the loading control. (Right panel) Heat map showing FIJI based quantification of the western blots. Compared to mono-cultured Lepto cells, Lepto cells co-cultured with OPCs exhibited lower pGM-CSFRα levels and less growth factor phosphorylation/activation (pSTAT5, pAKT, and pERK1/2). Tubulin served as a loading control. (G.) Quantification of Annexin V-positive Lepto cells grown under the indicated conditions. Cells cultured with OPC-conditioned media or anti-GM-CSF neutralizing antibodies were significantly more apoptotic than control cells grown in hCSF-supplemented media alone (n=6). ***p<0.001. (H.) Schematic showing the protocol used to monitor the effects of the intrathecal administration of anti-GM-CSF neutralizing vs. control IgG antibodies (8 μg/g on days 5, 10, and 15) in mice implanted with mCherry:LUC-labeled Lepto cells (100K). Tumor growth was monitored by BLI from days 15 to 50. (I.) IHC analysis of brain sections from Lepto cell-implanted NOD/SCID mice treated with anti-GM-CSF antibodies or control IgG. Anti-GM-CSF antibody treatment suppressed Lepto tumor growth. (J.) (Left panel) BLI-based quantification of mCherry:LUC-labeled Lepto tumor growth in mice treated with anti-GM-CSF antibodies or control IgG (n=6). Antibody treatment blocked tumor progression. (Right panel) Survival analysis of the same mice. ***p<0.001.
Figure 3.
Figure 3.. Modulation of GM-CSF expression alters Lepto cell proliferation in vitro and in vivo
(A.) Diagram showing the lentiviral Tet-On 3G inducible GM-CSF ORF expression cassette used in this study. (B.) (Left) Western blot analysis of GM-CSF in Lepto cell lysates collected 48 h after 5 μg/mL DOX administration to induce GM-CSF overexpression. β-Actin served as a loading control. (Right) FIJI based quantification of the western blots shows DOX mediated overexpression of GM-CSF in Lepto cells. (C.) FACS-based analysis of ZsGreen1expression in Lepto cells cultured for 48 h with (red) or without (blue) 5 μg/mL DOX. (D.) Fluorescence imaging of Lepto cells 48 h after 5 μg/mL DOX or vehicle (PBS) treatment, showing robust green fluorescence of Lepto cells after GM-CSF induction. Scale bar=50 μm. (E.) Viability of Lepto cells cultured with or without 5 μg/mL DOX and/or OPCs for 48 h, measured by CellTiter-Glo assays (n=3). **p<0.001. (F.) Annexin V FACS-based analysis of apoptosis in Lepto cells grown under the conditions shown in Fig. 3E (n=3). **p<0.001. (G.) Diagram showing the lentiviral Tet-On 3G inducible GM-CSF-shRNA expression cassette used in this study. (H.) Western blot analysis of GM-CSF in Lepto cell (Lepto1 Left and Lepto2 Right) lysates collected 48 h after 5 μg/mL DOX administration to induce shGM-CSF expression. Tubulin served as a loading control. (I.) FIJI based quantification of the western blots in Fig. 3H shows DOX mediated overexpression of shGM-CSF in Lepto1 and 2 cells. *p<0.01. (J.) ELISA-based quantification of GM-CSF concentrations in the media of Lepto1 and 2 cells conditionally expressing shGM-CSF. ***p<0.01. (K.) Proliferation rates of control Lepto cells and Lepto cells expressing shGM-CSF over 6 days. shGM-CSF-expressing Lepto cells showed prolonged doubling times relative to control Lepto cells. (L.) Heatmap of the tumor-seeding capacities (per 8 xenografted animals) of control Lepto cells vs. Lepto cells conditionally expressing shGM-CSF. (M.) H&E-stained sagittal brain tissue sections from NOD/SCID mice implanted with Lepto1 cells (100K) constituitively overexpressing GM-CSF alone, Lepto1 cells (100K) conditionally overexpressing shGM-CSF (DOX; ON) and Lepto1 cells constituitively overexpressing GM-CSF as well as conditionally overexpressing shGM-CSF (DOX; ON). Red arrows indicate presence of Lepto derived tumor mass. (N.) Heatmap of the tumor-seeding capacities (per 4 xenografted animals) of control Lepto cells vs. constitutive GM-CSF overexpressing Lepto cells vs GM-CSF (constitutive overexpression) combined with conditionally expressing shGM-CSF Lepto cells.
Figure 4.
Figure 4.. OPC-derived TPP1 is a candidate regulator of GM-CSF
(A.) Venn diagram of unique and shared secreted proteins identified in the hCSF of mono- or co-cultured astrocytes, OPCs, and Lepto cells. (B.) Relative TPP1 protein levels in control hCSF (no cells) and hCSF from the indicated cell cultures. (C.) Relative quantification (RQ) of GM-CSF levels in media from Lepto cells cultured in OPC-conditioned hCSF or in hCSF with exogenous TPP1 (50 or 100 ng/mL), as measured by ELISA. **p<0.01. (D.) Lepto cell viability following treatment with OPC-conditioned hCSF or hCSF with exogenous TPP1, as shown in Fig. 4C, measured by CellTiter-Glo assays. **p< 0.01. (E.) ELISA-based analysis of GM-CSF concentrations in the media of Lepto cells conditionally overexpressing GM-CSF (following treatment with 5 μg/mL DOX) and cultured with OPCs or TPP1 (50 ng/mL). Both conditions reduced GM-CSF levels in culture media. **p<0.01. (F.) Representative BLI images of NOD/SCID mice on day 26 post-implantations of Lepto cells (100K) alone or with OPCs (100K or 200K). (G.) BLI-based quantification of tumor growth showing OPC density-dependent suppression of Lepto tumor growth. ***p<0.001. (H.) Kaplan–Meier curves showing the density-dependent effects of OPC implantation on the survival of mice bearing Lepto tumors. ***p<0.001. (I.) H&E-stained brain tissue sections from NOD/SCID mice implanted with Lepto cells (100K) alone or with OPCs (200K). (J.) ELISA-based analysis of TPP1 levels in serum extracted from mice on days 8, 16, 24, and 32 post-implantations of with Lepto cells (100K) alone (Control) or with OPCs (100K or 200K). (K.) ELISA-based analysis of GM-CSF levels in serum extracted from mice on days 8, 16, 24, and 32 post-implantations with Lepto cells (100K) alone (Control) or with OPCs (100K or 200K). (L.) Viability of OPCs extracted from CSF samples collected between days 5 and 20 after co-implantation with Lepto cells into NOD/SCID mice, measured by CellTiter-Glo assays. (M.) (Left panel) BLI-based quantification of tumor growth in Lepto1 bearing NOD/SCID mice co-implanted with OPC-shGFP (100K), OPC-shTPP1 (100K) and OPC-shTPP1 (200K) shows density-dependent elevation of Lepto1 tumor growth. ***p<0.001. (Right panel) Kaplan–Meier curves showing survival of mice bearing Lepto1 derived tumors co-implanted with OPC-shGFP (100K), OPC-shTPP1 (100K) and OPC-shTPP1 (200K). ***p<0.001. (N.) (Left panel) ELISA-based analysis of TPP1 levels in serum extracted from mice on days 8, 16, 24, and 32 post-implantations with Lepto1 cells (100K) followed by co-implantation with 100K OPCs-shGFP, (100K and 200K) OPCs-shTPP1. (Right Panel) ELISA-based analysis of GM-CSF levels in serum extracted from mice on days 8, 16, 24, and 32 post-implantations with Lepto1 cells (100K) followed by co-implantation with 100K OPCs-shGFP, (100K and 200K) OPCs-shTPP1 (O.) H&E-stained coronal brain tissue sections from NOD/SCID mice co-implanted with Lepto1 cells (100K) and with OPCs-shGFP or with OPCs-shTPP1 (100K). Red arrows indicate presence of Lepto derived tumor mass. (P.) H&E-stained sagittal brain tissue sections from NOD/SCID mice co-implanted with Lepto1 cells (100K) and with OPCs-shGFP or with OPCs-shTPP1 (100K). Red arrows indicate presence of Lepto derived tumor mass.
Figure 5.
Figure 5.. Combination treatment with a pan-Aurora kinase inhibitor and anti-GM-CSF neutralizing antibodies reduces Lepto cell growth in vivo
(A.) RT-qPCR analysis of Aurora-A transcript levels in nodular HER2+ LC, primary tumor (PT2), metastatic tumor (MT2), normal breast, and normal brain tissues. The HER2+ LC tissues exhibited the highest Aurora-A transcript levels. (B.) Dose-dependent inhibition of Lepto cell viability by CCT137690, measured by CellTiter-Glo assays. The IC50 value is shown. (C.) Immunofluorescence images of mCherry: LUC-labeled (red) Lepto cells stained with Annexin V (green) after 24 h of treatment with CCT137690 (100 nM) or 0.1% DMSO (CTL). Nuclei were counterstained with DAPI (blue). Scale bar=50 μm. (D.) Percentages of tumorsphere-initiating cells after 24-h treatment (as shown in S4A, top row), measured by CCK assays. The number of DMSO-treated cells was set to 100 (n = 3). **p<0.01, compared to DMSO-treated cells. (E.) Viability of primary tumorspheres after 2-day treatment (as shown in S4A, middle row), measured by CCK assays. The number of DMSO-treated cells was set to 100 (n = 3). **p<0.01, compared to DMSO-treated tumorspheres. (F.) Viability of secondary tumorspheres 12 days after dissociation of treated primary tumorspheres (as shown in S4A, bottom row), measured by CCK assays. ** p < 0.01, compared to secondary tumorspheres from DMSO-treated primary tumorspheres. (G.) Schematic showing the protocol used to monitor the effects of the intrathecal administration of anti-GM-CSF neutralizing antibodies and CCT137690 ((8 μg/g and 100 mg/kg, respectively, on days 5, 10, and 15) in mice implanted with mCherry: LUC-labeled Lepto cells (100K). Tumor growth was monitored by BLI from days 15 to 50. (H.) (Left panel) BLI-based quantification of mCherry: LUC-labeled Lepto tumor growth in mice treated with anti-GM-CSF antibodies alone or with CCT137690 (n=9). Control animals were treated with vehicle (PBS for antibodies and 0.1% DMSO for CCT137690). (Right panel) Survival analysis of the same mice. Combination treatment with anti-GM-CSF antibodies and CCT137690 (anti-GM-CSF+CCT137690) significantly reduced tumor growth and increased survival. Treatment with anti-GM-CSF antibodies alone also significantly reduced tumor growth but to a lesser extent. **p<0.01. (I.) H&E-stained sagittal brain tissue sections from Lepto bearing NOD/SCID mice treated with Vehicle, Anti-GM-CSF, CCT137690 and CCT137690+Anti-GM-CSF. Red arrows indicate presence of Lepto derived tumor mass.

Similar articles

Cited by

References

    1. Tabouret E, Chinot O, Metellus P, Tallet A, Viens P, Goncalves A. Recent trends in epidemiology of brain metastases: an overview. Anticancer Res 2012;32:4655–62 - PubMed
    1. Quigley MR, Fukui O, Chew B, Bhatia S, Karlovits S. The shifting landscape of metastatic breast cancer to the CNS. Neurosurg Rev 2013;36:377–82 - PubMed
    1. Kennecke H, Yerushalmi R, Woods R, Cheang MC, Voduc D, Speers CH, et al. Metastatic behavior of breast cancer subtypes. J Clin Oncol 2010;28:3271–7 - PubMed
    1. Chen W, Hoffmann AD, Liu H, Liu X. Organotropism: new insights into molecular mechanisms of breast cancer metastasis. npj Precision Oncology 2018;2:4. - PMC - PubMed
    1. Spector R, Robert Snodgrass S, Johanson CE. A balanced view of the cerebrospinal fluid composition and functions: Focus on adult humans. Exp Neurol 2015;273:57–68 - PubMed

Publication types

MeSH terms

Substances