. 2021 Sep 15;81(18):4835-4848.
doi: 10.1158/0008-5472.CAN-20-2811. Epub 2021 Jul 9.

Single-Cell Analyses Reveal Diverse Mechanisms of Resistance to EGFR Tyrosine Kinase Inhibitors in Lung Cancer

Affiliations

Single-Cell Analyses Reveal Diverse Mechanisms of Resistance to EGFR Tyrosine Kinase Inhibitors in Lung Cancer

Yukie Kashima et al. Cancer Res. .

Abstract

Tumor heterogeneity underlies resistance to tyrosine kinase inhibitors (TKI) in lung cancers harboring EGFR mutations. Previous evidence suggested that subsets of preexisting resistant cells are selected by EGFR-TKI treatment, or alternatively, that diverse acquired resistance mechanisms emerge from drug-tolerant persister (DTP) cells. Many studies have used bulk tumor specimens or subcloned resistant cell lines to identify resistance mechanism. However, intratumoral heterogeneity can result in divergent responses to therapies, requiring additional approaches to reveal the complete spectrum of resistance mechanisms. Using EGFR-TKI-resistant cell models and clinical specimens, we performed single-cell RNA-seq and single-cell ATAC-seq analyses to define the transcriptional and epigenetic landscape of parental cells, DTPs, and tumor cells in a fully resistant state. In addition to AURKA, VIM, and AXL, which are all known to induce EGFR-TKI resistance, CD74 was identified as a novel gene that plays a critical role in the drug-tolerant state. In vitro and in vivo experiments demonstrated that CD74 upregulation confers resistance to the EGFR-TKI osimertinib and blocks apoptosis, enabling tumor regrowth. Overall, this study provides new insight into the mechanisms underlying resistance to EGFR-TKIs. SIGNIFICANCE: Single-cell analyses identify diverse mechanisms of resistance as well as the state of tolerant cells that give rise to resistance to EGFR tyrosine kinase inhibitors.


Figures

Figure 1.
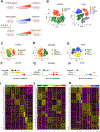
Figure 1.. scRNA-seq analysis of osimertinib-resistant lung cancer line models.
(A) Schematic showing establishment of osimertinib-resistant lines used in this study. (B) t-Distribution Stochastic Neighbor Embedding (tSNE) plot based on scRNA-seq in merged H975 parental and H975-OR2000 (left) cells and four PC9 datasets (right; PC9 parental, PC9-ER parental, PC9-OR2000, and PC9-EROR2000). (C-E) t-SNE plots based on scRNA-seq of merged datasets for each line; H1975 (C), PC9-ER (D), and PC9 d (E) datasets. (F-H) Cell ordering based pseudotime analyzed by Monocle for each line; H1975 (F), PC9-ER (G), and PC9 (H) datasets. (I-K) Heatmaps showing differentially-expressed genes for each cluster in H975 (I), PC9-ER (J), and PC9 (K) datasets. Normalized gene expression is shown.
Figure 2.
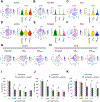
Figure 2.. Identification of aurora kinase A as functioning in intrinsic and/or acquired resistance to first-line osimertinib.
(A-C) t-SNE plots (left) and violin plots (right) showing AURKA expression in H1975 (A), PC9-ER (B), and PC9 (C) datasets. (D-F) t-SNE plots (left) and violin plots (right) showing TPX2 expression in H1975 (D), PC9-ER (E), and PC9 (F) datasets. (G, H) t-SNE plots highlighting clusters showing high AURKA expression in H1975 (G) and PC9 (H) datasets. (I-K) Cell viability assay using H1975, H1975-OR30, and H1975-OR2000 cells treated with osimertinib alone or in combination with alisertib. Asterisks indicate p-value <0.05.
Figure 3.
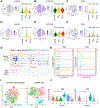
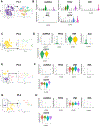
Figure 3.. The EMT is associated with a DTP state.
(A-C) t-SNE plots (left) and violin plots (right) showing VIM expression in H1975 (A), PC9-ER (B), and PC9 (C) datasets. (D-F) t-SNE plots (left) and violin plots (right) showing AXL expression in H1975 (D), PC9-ER (E), and PC9 (F) datasets. (G) scATAC-seq data showing peaks in genomic regions of VIM (left) and AXL (right) in indicated parental and H1975-OR series. Lower panel shows relevant ChIP-Seq data based on ENCODE3. (H) scATAC-seq data showing peaks in genomic regions of VIM (left) and AXL (right) in ten clusters from H1975 datasets. (I) t-SNE diagrams based on scATAC-seq embedding scRNA-seq (left) and scRNA-seq (right) in H1975 datasets. (J) Violin plots showing indicated gene expression in each H1975-OR30 cluster. Asterisks indicate p-value <0.05.
Figure 4.
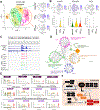
Figure 4.. scRNA-seq identifies CD74 as a novel gene expressed in DTPs.
(A) t-SNE diagram showing clusters in merged H1975 datasets (left) and clusters that show higher CD74 expression in indicated parental and H1975 H1975-OR lines. (B) t-SNE plots (top) and violin plots (bottom) showing CD74 expression in H1975 datasets. (C) scATAC-seq data showing peaks in the CD74 genomic region in indicated H1975 datasets (top). RFX5, CREB1, and NFYB binding sites in indicated lines based on the ENCODE database (bottom). (D) Gene co-expression networks involving CD74 based on our previous study (36). (E) Transitions in gene expression of CD74-related genes: (top, middle rows) genes upstream of CD74 genes and (bottom) downstream genes. (F) Predicted signaling events downstream of CD74 following osimertinib treatment.
Figure 5.
Figure 5.. CD74 upregulation by osimertinib contributes to a drug-tolerant state in EGFR-mutant tumor cells.
(A) Western blotting showing upregulation of CD74 and BCL-XL following osimertinib treatment of H1975 cells overexpressing CD74 (OE) or control H1975 cells (Cntl). Both groups were incubated for 0, 24 and 48 hours with osimertinib at 100 nM. Long exposure increased CD74 expression in Cntl cells. (B) Western blotting showing CD74 knockout efficiency and BCL-XL down-regulation in H1975 CD74 KO cells. Two different KO clones (KO#1 and KO#2) and control cells (Cntl) were treated with osimertinib at 100 nM for 0, 24 and 48 hours in the presence of macrophage migration inhibitory factor (MIF) (50 ng/mL). (C and D) Caspase-3/7 activity indicative of inhibition of apoptosis induced by osimertinib treatment of H1975-OE cells (C) and increased apoptosis induced by osimertinib treatment in H1975-KO#1 cells (D). Cells were incubated 24 hours with osimertinib (100 nM) prior to analysis of Caspase-3/7 activity, which was normalized to cell number. (E) Changes in Caspase-3/7 activity elicited by osimertinib treatment of H1975-KO#1 transiently overexpressing CD74 or empty vector. Cells were treated with osimertinib (100 nM) in the presence of MIF (50 ng/mL) for 24 hours prior to determination of Caspase activities, which were normalized to cell number. (F) Comparison of time course to acquire resistance to osimertinib in H1975-KO and control cells. Cells were treated with chronic exposure of osimertinib at gradually increasing doses. (G) Analysis of osimertinib resistance in mouse xenograft tumor models harboring CD74-knockout (KO) or -overexpressing (OE) H1975 cells. (left) Nude mice bearing H1975-KO or control cells (n=6 per group) were treated with vehicle or osimertinib (5 mg/kg orally once daily) for 11 days, followed by osimertinib withdrawal over the next 14 days. Mice were monitored for changes in tumor volume. (right) Nude mice bearing H1975-OE or control cells (n=5 per group) were comparably analyzed, except that drug was administered for 28 days, following by withdrawal over the next 14 days. In both graphs, data are presented as the mean % change in tumor volume ± SD. Asterisks indicate p-value as follows: *<0.05, **<0.005.
Figure 6.
Figure 6.. Analysis of clinical specimens shows tumor heterogeneity and confirms gene expression changes identified in lung cancer lines.
(A, C, E, G) t-SNE plots showing all isolated single cells (left, purple) and tumor cells (right) from indicated patients. (B, D, F, H) violin plots showing expression of AURKA, TPX2, VIM, AXL, and CD74 in each tumor cluster isolated from Pt-1(B), Pt-2 (D), Pt-3 (F), and Pt-4 (H).

References

    1. Citri A, Yarden Y. EGF-ERBB signalling: towards the systems level. Nature reviews Molecular cell biology 2006;7:505–16 - PubMed
    1. Nguyen KS, Kobayashi S, Costa DB. Acquired resistance to epidermal growth factor receptor tyrosine kinase inhibitors in non-small-cell lung cancers dependent on the epidermal growth factor receptor pathway. Clinical lung cancer 2009;10:281–9 - PMC - PubMed
    1. Pagliarini R, Shao W, Sellers WR. Oncogene addiction: pathways of therapeutic response, resistance, and road maps toward a cure. EMBO reports 2015;16:280–96 - PMC - PubMed
    1. Gazdar AF. Activating and resistance mutations of EGFR in non-small-cell lung cancer: role in clinical response to EGFR tyrosine kinase inhibitors. Oncogene 2009;28Suppl 1:S24–31 - PMC - PubMed
    1. Kobayashi S, Boggon TJ, Dayaram T, Janne PA, Kocher O, Meyerson M, et al.EGFR mutation and resistance of non-small-cell lung cancer to gefitinib. The New England journal of medicine 2005;352:786–92 - PubMed

Publication types

MeSH terms

Substances