

Comparative Transcriptomics Reveals Distinct Patterns of Gene Expression Conservation through Vertebrate Embryogenesis
- PMID: 34247223
- PMCID: PMC8358226
- DOI: 10.1093/gbe/evab160
Comparative Transcriptomics Reveals Distinct Patterns of Gene Expression Conservation through Vertebrate Embryogenesis
Abstract
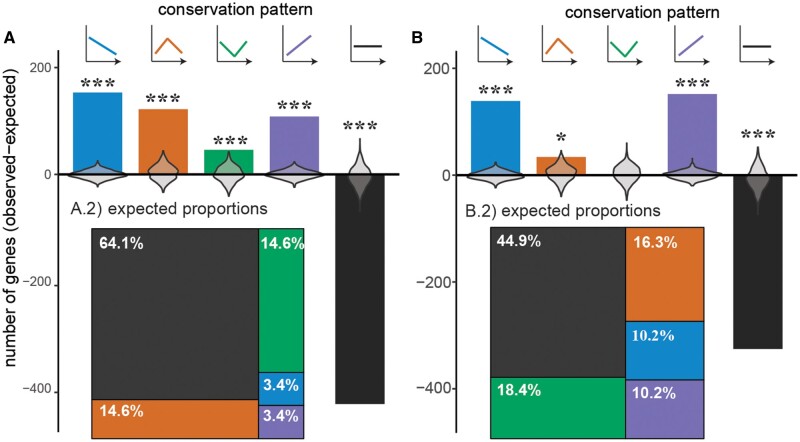
Despite life's diversity, studies of variation often remind us of our shared evolutionary past. Abundant genome sequencing and analyses of gene regulatory networks illustrate that genes and entire pathways are conserved, reused, and elaborated in the evolution of diversity. Predating these discoveries, 19th-century embryologists observed that though morphology at birth varies tremendously, certain stages of vertebrate embryogenesis appear remarkably similar across vertebrates. In the mid to late 20th century, anatomical variability of early and late-stage embryos and conservation of mid-stages embryos (the "phylotypic" stage) was named the hourglass model of diversification. This model has found mixed support in recent analyses comparing gene expression across species possibly owing to differences in species, embryonic stages, and gene sets compared. We compare 186 microarray and RNA-seq data sets covering embryogenesis in six vertebrate species. We use an unbiased clustering approach to group stages of embryogenesis by transcriptomic similarity and ask whether gene expression similarity of clustered embryonic stages deviates from a null expectation. We characterize expression conservation patterns of each gene at each evolutionary node after correcting for phylogenetic nonindependence. We find significant enrichment of genes exhibiting early conservation, hourglass, late conservation patterns in both microarray and RNA-seq data sets. Enrichment of genes showing patterned conservation through embryogenesis indicates diversification of embryogenesis may be temporally constrained. However, the circumstances under which each pattern emerges remain unknown and require both broad evolutionary sampling and systematic examination of embryogenesis across species.
Keywords: developmental hourglass; diversification; evo-devo; phylotypic stage.
© The Author(s) 2021. Published by Oxford University Press on behalf of the Society for Molecular Biology and Evolution.
Figures


Similar articles
-
The developmental hourglass model and recapitulation: An attempt to integrate the two models.J Exp Zool B Mol Dev Evol. 2022 Jan;338(1-2):76-86. doi: 10.1002/jez.b.23027. Epub 2021 Jan 27. J Exp Zool B Mol Dev Evol. 2022. PMID: 33503326 Free PMC article. Review.
-
The vertebrate phylotypic stage and an early bilaterian-related stage in mouse embryogenesis defined by genomic information.BMC Biol. 2007 Jan 12;5:1. doi: 10.1186/1741-7007-5-1. BMC Biol. 2007. PMID: 17222327 Free PMC article.
-
A transcriptomic hourglass in plant embryogenesis.Nature. 2012 Oct 4;490(7418):98-101. doi: 10.1038/nature11394. Epub 2012 Sep 5. Nature. 2012. PMID: 22951968
-
The Phylotypic Brain of Vertebrates, from Neural Tube Closure to Brain Diversification.Brain Behav Evol. 2024;99(1):45-68. doi: 10.1159/000537748. Epub 2024 Feb 9. Brain Behav Evol. 2024. PMID: 38342091 Review.
-
The hourglass model of evolutionary conservation during embryogenesis extends to developmental enhancers with signatures of positive selection.Genome Res. 2021 Sep;31(9):1573-1581. doi: 10.1101/gr.275212.121. Epub 2021 Jul 15. Genome Res. 2021. PMID: 34266978 Free PMC article.
Cited by
-
The Interplay of Ontogeny and Phylogeny at the Transcriptome Level of the Tetrapod Heart.J Exp Zool B Mol Dev Evol. 2025 Sep;344(6):325-340. doi: 10.1002/jez.b.23312. Epub 2025 Jul 3. J Exp Zool B Mol Dev Evol. 2025. PMID: 40605499 Free PMC article.
-
Transcriptome Analysis Provides Insights into Copulation, Fertilization, and Gestation in Sebastes schlegelii.Genes (Basel). 2022 Oct 7;13(10):1812. doi: 10.3390/genes13101812. Genes (Basel). 2022. PMID: 36292697 Free PMC article.
-
Comparative transcriptomics reveal contrasting strategies between a fungal plant pathogen and an endophyte during initial host colonization.Microbiol Spectr. 2025 Aug 5;13(8):e0022625. doi: 10.1128/spectrum.00226-25. Epub 2025 Jun 12. Microbiol Spectr. 2025. PMID: 40503835 Free PMC article.
-
Quantitative proteome dynamics across embryogenesis in a model chordate.iScience. 2024 Feb 29;27(4):109355. doi: 10.1016/j.isci.2024.109355. eCollection 2024 Apr 19. iScience. 2024. PMID: 38510129 Free PMC article.
References
-
- Abzhanov A.2013. von Baer’s law for the ages: lost and found principles of developmental evolution. Trends Genet. 29(12):712–722. - PubMed
-
- Andrews S.2010. FastQC: a quality control tool for high throughput sequence data. Available from: http://www.bioinformatics.babraham.ac.uk/projects/fastqc. Accessed June 21, 2017.
-
- Ballard WW.1976. Problems of gastrulation: real and verbal. Bioscience 26(1):36–39.
-
- Ballard WW.1981. Morphogenetic movements and fate maps of vertebrates. Am Zool. 21(2):391–399.
Publication types
MeSH terms
Grants and funding
LinkOut - more resources
Full Text Sources
Miscellaneous
