. 2021 Oct;41(7):1621-1632.
doi: 10.1007/s10875-021-01084-6. Epub 2021 Jul 11.

Chronically Activated T-cells Retain Their Inflammatory Properties in Common Variable Immunodeficiency

Affiliations

Chronically Activated T-cells Retain Their Inflammatory Properties in Common Variable Immunodeficiency

Roos-Marijn Berbers et al. J Clin Immunol. 2021 Oct.

Abstract

Purpose: Immune dysregulation complications cause significant morbidity and mortality in common variable immunodeficiency (CVID), but the underlying pathophysiology is poorly understood. While CVID is primarily considered a B-cell defect, resulting in the characteristic hypogammaglobulinemia, T-cells may also contribute to immune dysregulation complications. Here, we aim to further characterize T-cell activation and regulation in CVID with immune dysregulation (CVIDid).

Methods: Flow cytometry was performed to investigate T-cell differentiation, activation and intracellular cytokine production, negative regulators of immune activation, regulatory T-cells (Treg), and homing markers in 12 healthy controls, 12 CVID patients with infections only (CVIDio), and 20 CVIDid patients.

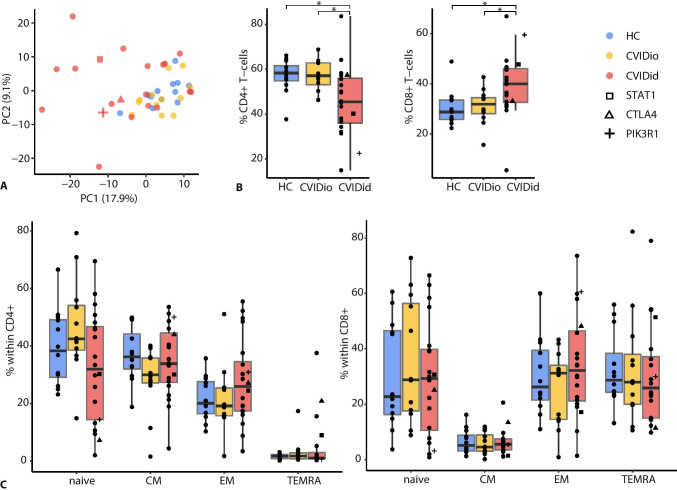
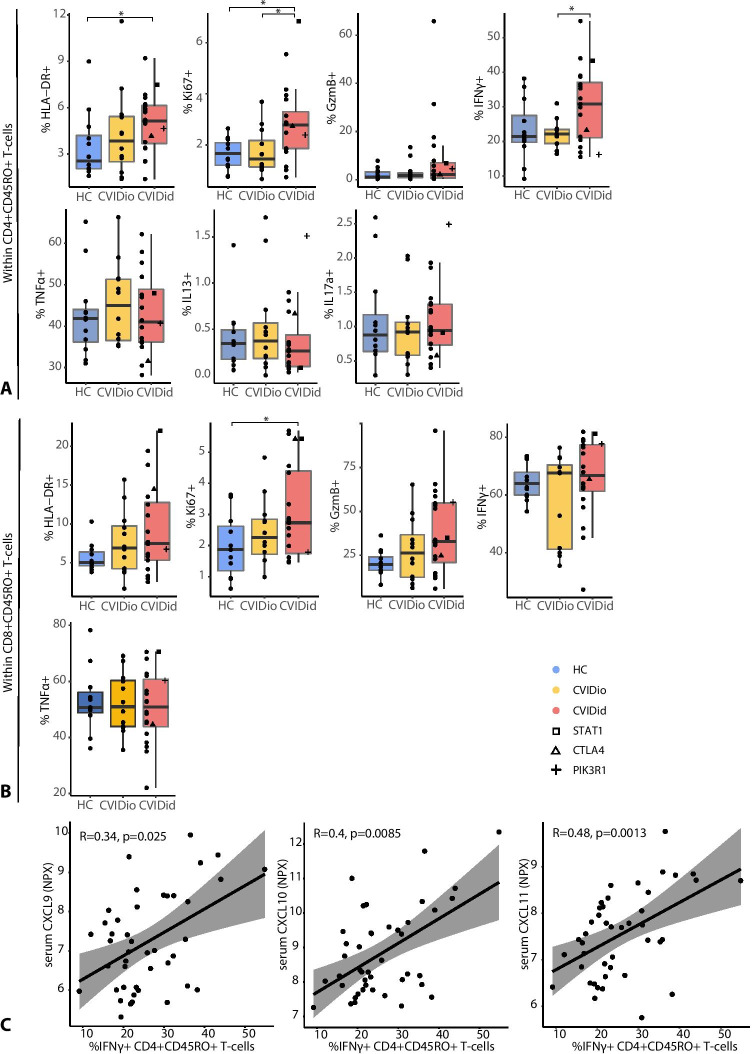
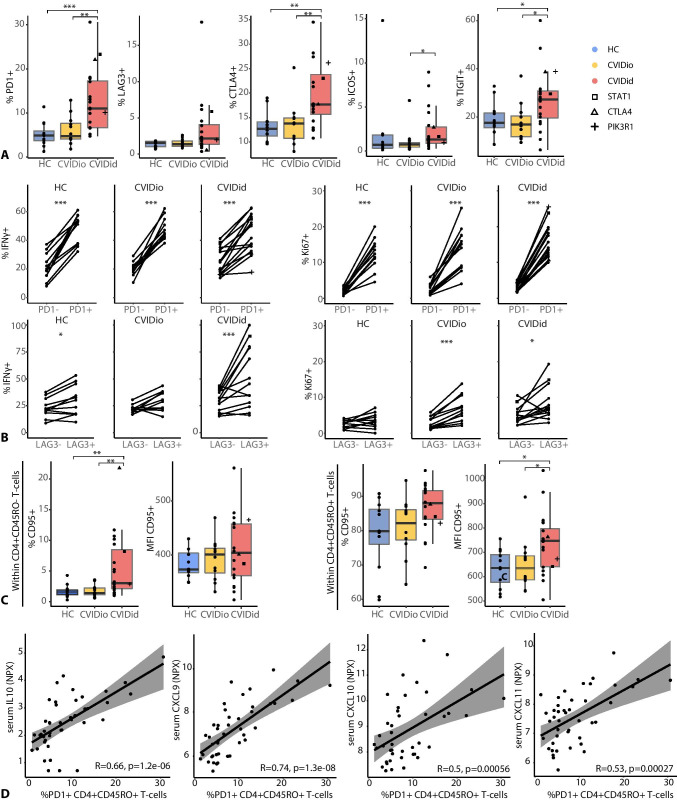
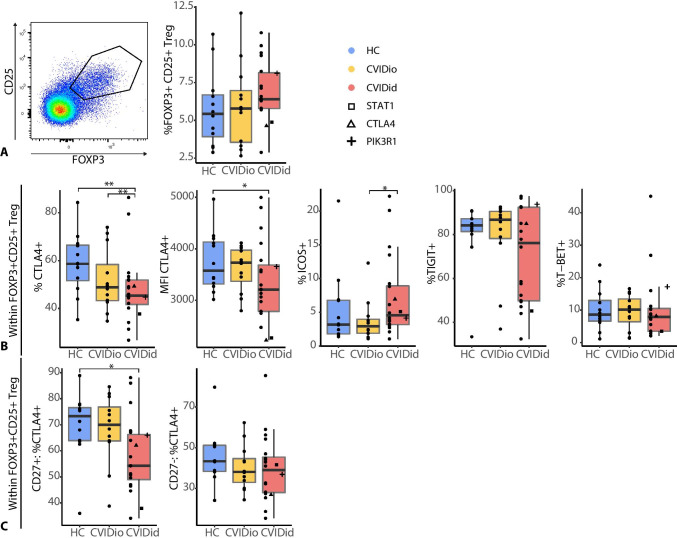
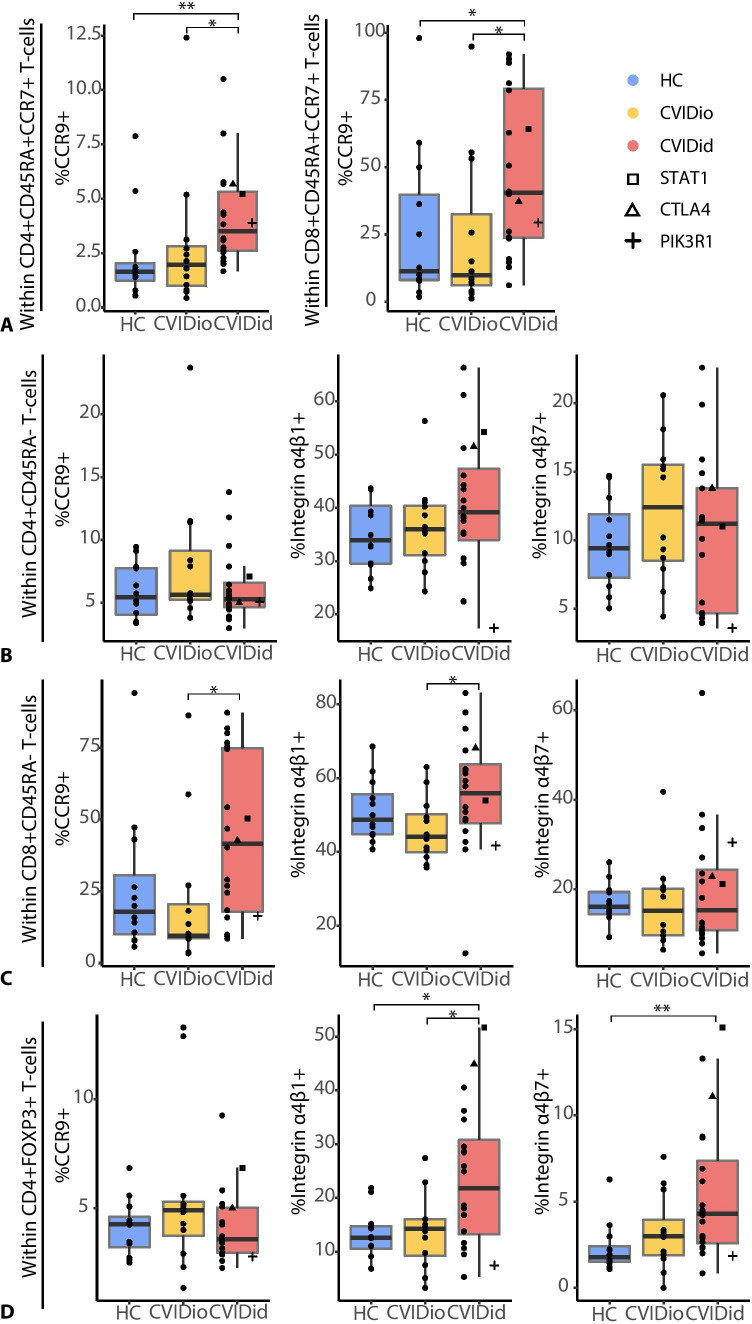
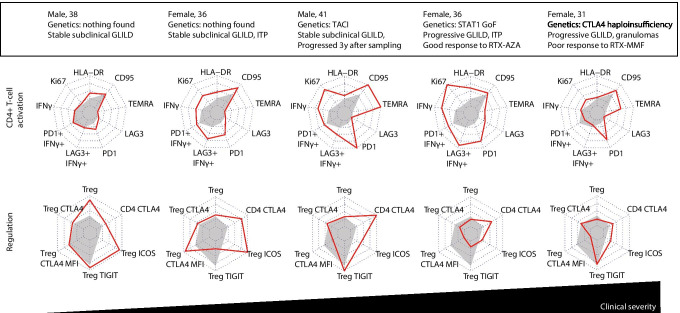
Results: Both CD4 + and CD8 + T-cells in CVIDid showed an increased activation profile (HLA-DR + , Ki67 + , IFNγ +) when compared to CVIDio, with concomitant upregulation of negative regulators of immune activation PD1, LAG3, CTLA4, and TIGIT. PD1 + and LAG3 + subpopulations contained equal or increased frequencies of cells with the capacity to produce IFNγ, Ki67, and/or GzmB. The expression of PD1 correlated with serum levels of CXCL9, 10, and 11. Treg frequencies were normal to high in CVIDid, but CVIDid Tregs had reduced CTLA-4 expression, especially on CD27 + effector Tregs. Increased migratory capacity to inflamed and mucosal tissue was also observed in CVIDid T-cells.

Conclusion: CVIDid was characterized by chronic activation of peripheral T-cells with preserved inflammatory potential rather than functional exhaustion, and increased tissue migratory capacity. While Treg numbers were normal in CVIDid Tregs, low levels of CTLA-4 indicate possible Treg dysfunction. Combined studies of T-cell dysfunction and circulating inflammatory proteins may direct future treatment strategies.

Keywords: Autoimmunity; Common variable immunodeficiency (CVID); Immune dysregulation; Immune exhaustion; Regulatory T-cells; T-cells.


Conflict of interest statement

PH reports research grants and personal fees from Shire/Takeda and CSL Behring. VD reports research grants and personal fees from Shire/Takeda, Griffols, Actelion, Novartis, Pharming, and CSL Behring. JM reports personal fees from Shire/Takeda. HL reports research grants from Shire/Takeda. All other authors declare no competing interests.

Figures

Fig. 1
Fig. 1
General description of T-cell subsets in CVID. A Principal component analysis of FACS data (all panels combined). B CD4 + and CD8 + T-cells. C Naïve (CD45RA + CCR7 +), central memory (CM: CD45RA − CCR7 +), effector memory (EM: CD45RA − CCR7 −) and terminally differentiated effector memory cells (TEMRA: CD45RA + CCR7 −) in CD4 + T-cells. CVIDid = CVID with immune dysregulation (n = 20), CVIDio = CVID with infections only (n = 12), HC = healthy controls (n = 12). Statistics: Mann–Whitney U-test. *p < 0.05, **p < 0.01, ***p < 0.001
Fig. 2
Fig. 2
Expression of activation markers HLA-DR, Ki67, and GzmB, and of intracellular cytokines after PMA/ionomycin stimulation: IFNg, TNFa, IL-13, and IL-17a. A CD4 + CD45RO + T-cells. B CD8 + CD45RO + T-cells. CVIDid = CVID with immune dysregulation (n = 20), CVIDio = CVID with infections only (n = 12), HC = healthy controls (n = 12). Statistics: Mann–Whitney U-test. *p < 0.05, **p < 0.01, ***p < 0.001. C %IFNg + CD4 + T-cells correlate with serum levels of CXCL9, CXCL10, and CXCL11. Statistics: Spearman correlation
Fig. 3
Fig. 3
Negative regulators of immune activation in CVID. A Proportions of PD1, LAG3, CTLA4, ICOS, and TIGIT in CD4 + CD45RO + T-cells. B Percentage and median fluorescence intensity of CD95 (FAS-L) in naïve (CD45RO −) and effector-memory (CD45RO +) CD4 + T-cells. C Comparison of IFNγ + and Ki67 + cells in PD1- and LAG3-positive and negative populations. Only samples with > 50 events in the PD1/LAG3-positive and PD1/LAG3-negative populations were included. D Spearman correlation between PD1 and IL10, CXCL9, CXCL10, or CXCL11. CVIDid = CVID with immune dysregulation (n = 20), CVIDio = CVID with infections only (n = 12), HC = healthy controls (n = 12). Statistics (A&C): Mann–Whitney U-test. Statistics B: paired Wilcoxon-Rank test. *p < 0.05, **p < 0.01, ***p < 0.001
Fig. 4
Fig. 4
Regulatory T-cells in CVID. A Gating strategy and proportion of CD25 + FOXP3 + T-cells within CD4 + population. B Expression of CTLA4, ICOS, TIGIT, and T-BET in the Treg population. C Decreased fraction of CTLA4 + Tregs was confined to the CD27 + population. CVIDid = CVID with immune dysregulation (n = 20), CVIDio = CVID with infections only (n = 12), HC = healthy controls (n = 12). Statistics: Mann–Whitney U-test. *p < 0.05, **p < 0.01, ***p < 0.001
Fig. 5
Fig. 5
Migratory capacity in CVID: A in CCR7 + CD45RA + naïve CD4 and CD8 + T-cells, B in non-naïve CD45RA − CD4 + T-cells, C in non-naïve CD45RA − CD8 + T-cells, D in FOXP3 + CD4 + T-cells. CVIDid = CVID with immune dysregulation (n = 20), CVIDio = CVID with infections only (n = 12), HC = healthy controls (n = 12). Statistics: Mann–Whitney U-test. *p < 0.05, **p < 0.01, ***p < 0.001
Fig. 6
Fig. 6
Patterns of CD4 + T-cell activation: % of HLA-DR, Ki67, IFNg, IFNg in the PD1 + population and the LAG3 + population, %PD1, %LAG3, %CD45RA + CCR7 − (TEMRA) cells, and % of CD95. And patterns of T-cell regulation: %CD25 + FOXP3 + Treg, %CTLA4 in Treg, MFI of CTLA4 in Treg, %TIGIT in Treg, %ICOS in Treg, %CTLA4 in CD4 + T-cells in five patients with GLILD. Red line indicates individual patient legends, gray-shaded area indicates the median for the CVIDio group. Axis ranges are the minimum and the maximum for that marker for the entire cohort. MFI, median fluorescence intensity; GLILD, granulomatous-lymphocytic interstitial lung disease; VUS, variant of unknown significance; ITP, idiopathic thrombocytopenia purpura; RTX, rituximab; AZA, azathioprine; MMF, mycophenolate mofetil; SCT, stem-cell transplantation; GOF, gain of function

References

    1. Immunodeficiencies ES for Diagnostic Criteria PID. 2019. Available from: https://esid.org/Education/Diagnostic-Criteria-PID. Accessed 07-04-2021.
    1. Cunningham-Rundles C. How I treat common variable immune deficiency. Blood. 2010;116:7–15. doi: 10.1182/blood-2010-01-254417. - DOI - PMC - PubMed
    1. Gathmann B, Mahlaoui N, Gérard L, Oksenhendler E, Warnatz K, Schulze I, et al. Clinical picture and treatment of 2212 patients with common variable immunodeficiency. J Allergy Clin Immunol. 2014;134:116–26. doi: 10.1016/j.jaci.2013.12.1077. - DOI - PubMed
    1. Chapel H, Lucas M, Lee M, Bjorkander J, Webster D, Grimbacher B, et al. Common variable immunodeficiency disorders: division into distinct clinical phenotypes. Blood. 2008;112:277–287. doi: 10.1182/blood-2007-11-124545. - DOI - PubMed
    1. Resnick ES, Moshier EL, Godbold JH, Cunningham-Rundles C. Morbidity and mortality in common variable immune deficiency over 4 decades. Blood. 2012;119:1650–1658. doi: 10.1182/blood-2011-09-377945. - DOI - PMC - PubMed

Publication types