. 2021 Aug;20(8):e13432.
doi: 10.1111/acel.13432. Epub 2021 Jul 11.

FoxO3 deficiency in cortical astrocytes leads to impaired lipid metabolism and aggravated amyloid pathology

Affiliations

FoxO3 deficiency in cortical astrocytes leads to impaired lipid metabolism and aggravated amyloid pathology

Shuqi Du et al. Aging Cell. 2021 Aug.

Abstract

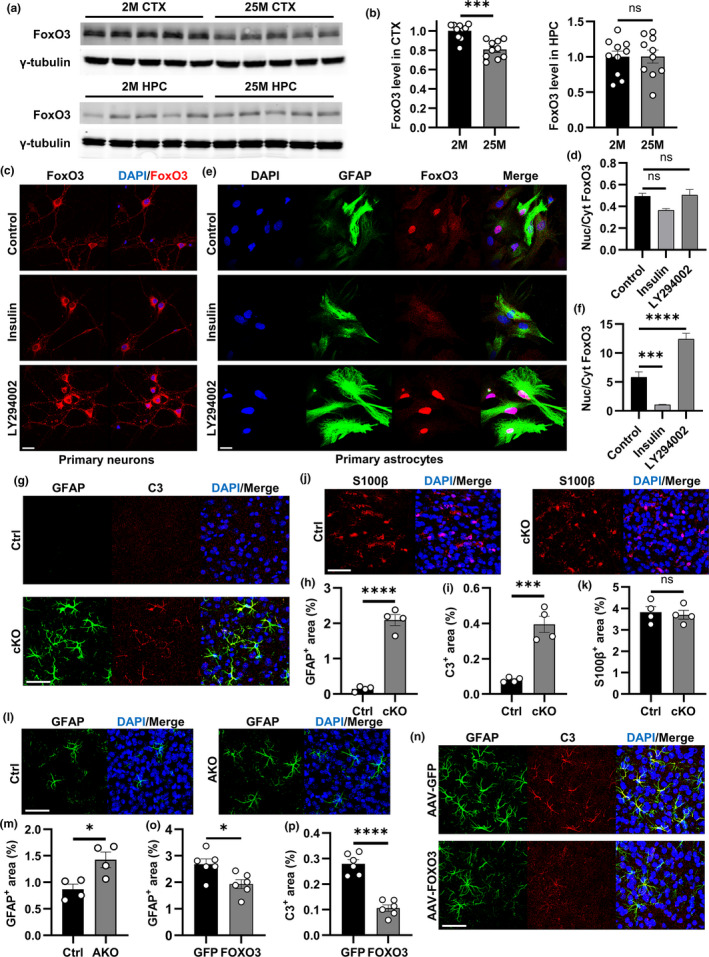
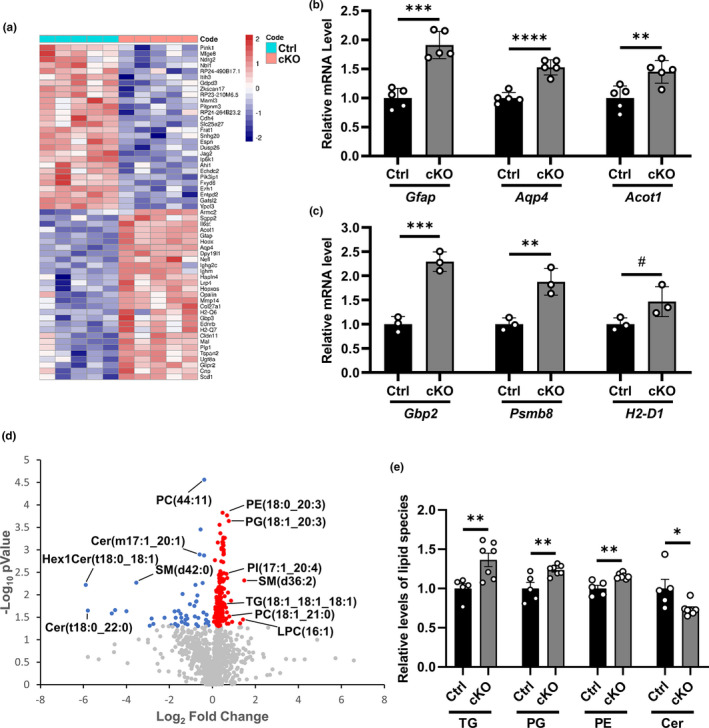
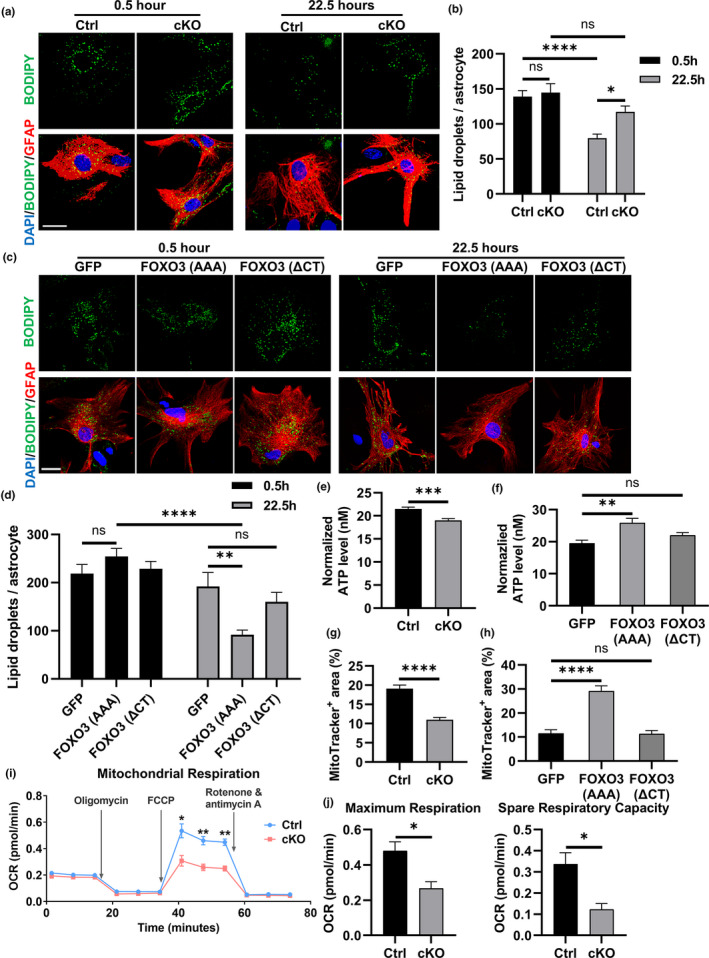
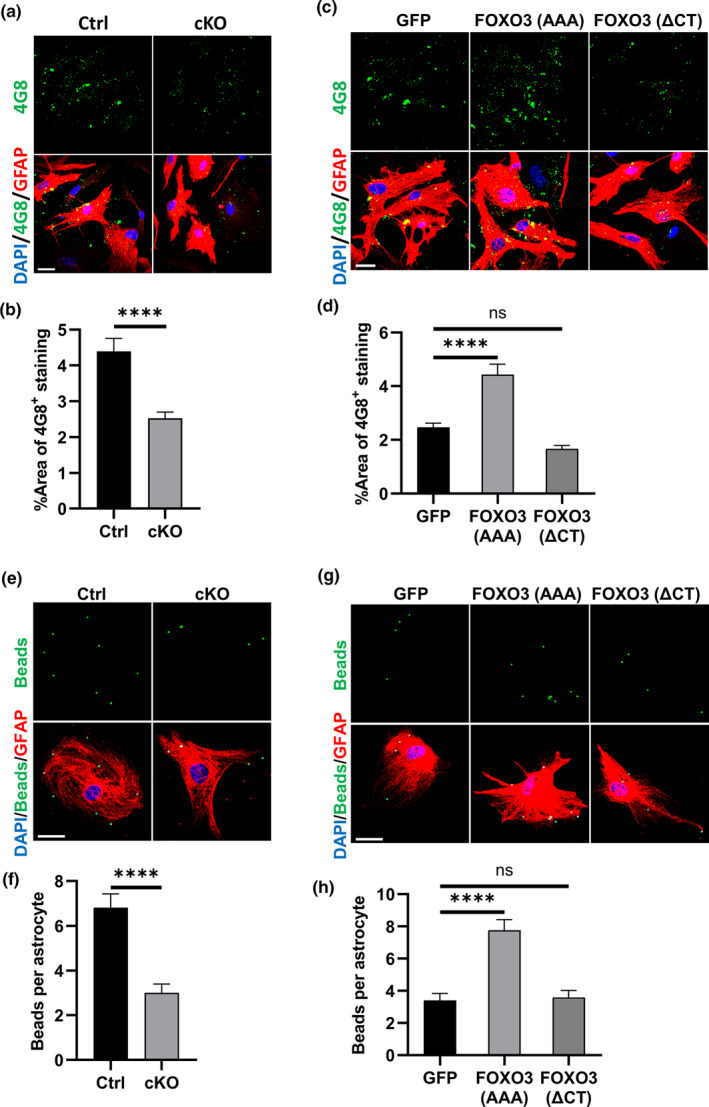
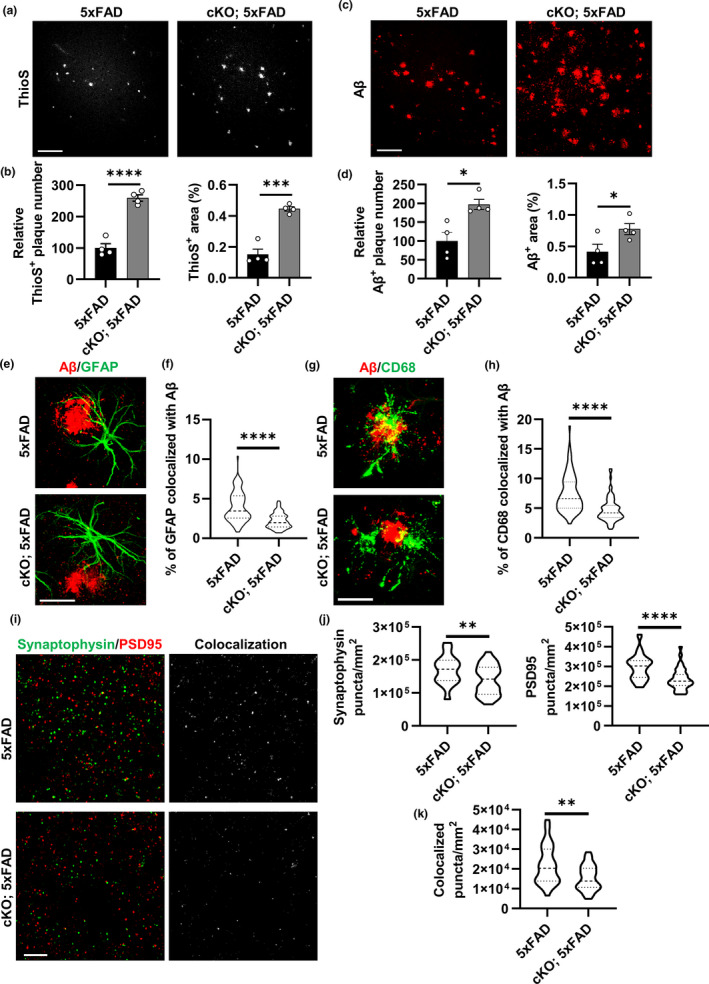
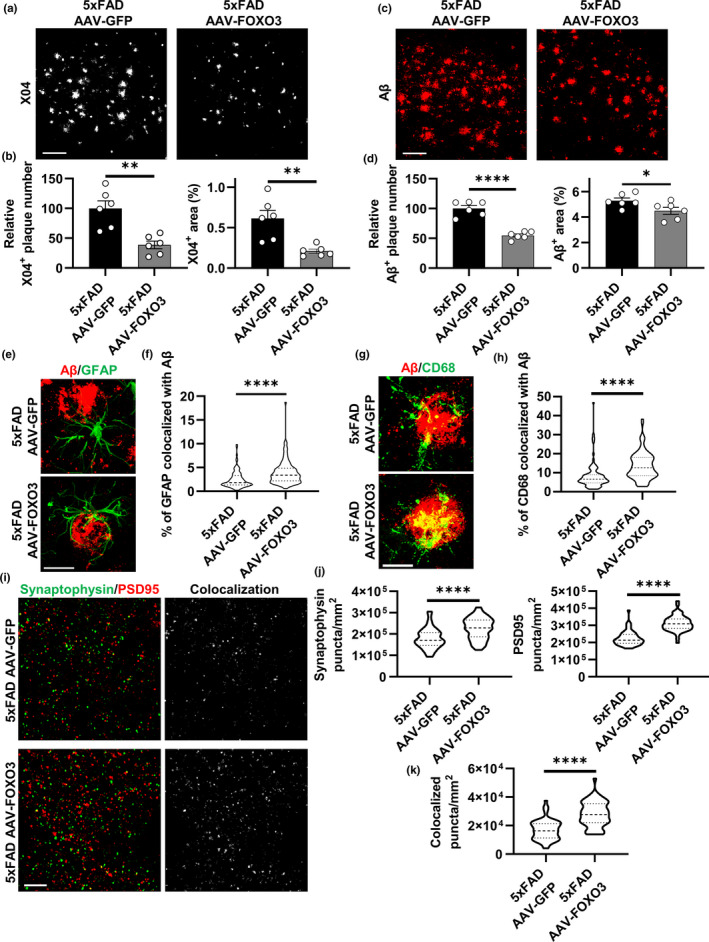
The rise of life expectancy of the human population is accompanied by the drastic increases of age-associated diseases, in particular Alzheimer's disease (AD), and underscores the need to understand how aging influences AD development. The Forkhead box O transcription factor 3 (FoxO3) is known to mediate aging and longevity downstream of insulin/insulin-like growth factor signaling across species. However, its function in the adult brain under physiological and pathological conditions is less understood. Here, we report a region and cell-type-specific regulation of FoxO3 in the central nervous system (CNS). We found that FoxO3 protein levels were reduced in the cortex, but not hippocampus, of aged mice. FoxO3 was responsive to insulin/AKT signaling in astrocytes, but not neurons. Using CNS Foxo3-deficient mice, we reveal that loss of FoxO3 led to cortical astrogliosis and altered lipid metabolism. This is associated with impaired metabolic homoeostasis and β-amyloid (Aβ) uptake in primary astrocyte cultures. These phenotypes can be reversed by expressing a constitutively active FOXO3 but not a FOXO3 mutant lacking the transactivation domain. Loss of FoxO3 in 5xFAD mice led to exacerbated Aβ pathology and synapse loss and altered local response of astrocytes and microglia in the vicinity of Aβ plaques. Astrocyte-specific overexpression of FOXO3 displayed opposite effects, suggesting that FoxO3 functions cell autonomously to mediate astrocyte activity and also interacts with microglia to address Aβ pathology. Our studies support a protective role of astroglial FoxO3 against brain aging and AD.

Keywords: Alzheimer's disease; FoxO3; aging; astrocytes; mice; β-amyloid.


Conflict of interest statement

None declared.

Figures

FIGURE 1
FIGURE 1
Regulation and function of FoxO3 in astrocytes. (a) Representative Western blots of FoxO3 protein levels in the cortex (upper panel) and hippocampus (lower panel) from mice at 2 months and 25 months. γ‐tubulin was used as the internal control. (b) Quantification of the levels of FoxO3 normalized to γ‐tubulin in (a). N = 10 (5 male +5 female)/group. (c) Representative confocal images showing FoxO3 subcellular localization in primary neurons via immunofluorescent staining after control (vehicle), insulin, or LY294002 treatment. Scale bar: 25 μm. (d) Quantification of nuclear/cytoplasmic FoxO3 ratio in (c). NControl=14; NInsulin = 3; NLY294002=8. (e) Representative confocal images showing FoxO3 subcellular localization in primary astrocytes via immunofluorescent staining after control (vehicle), insulin, or LY294002 treatment. GFAP was used as a marker for astrocytes. Scale bar: 25 μm. (f) Quantification of nuclear/cytoplasmic FoxO3 ratio in (e). NControl=29; NInsulin = 25; NLY294002=25. (g) Representative confocal images showing cortical astrocytes via immunofluorescent co‐staining of GFAP and C3 of cKO and Ctrl brain sections at 3 months of age. Scale bar: 50 μm. (h) Quantification of the GFAP‐positive percentage area in (g). N = 4/group. (i): Quantification of the C3‐positive percentage area in (g). = 4/group. (j) Representative confocal images showing cortical astrocytes via immunofluorescent staining of S100β of cKO and Ctrl brain sections at 3 months of age. Scale bar: 50 μm. (k) Quantification of the S100β‐positive percentage area in (j). N = 4/group. (l) Representative confocal images showing cortical astrocytes via immunofluorescent staining of GFAP of AKO and Ctrl brain sections at 3 months of age. Scale bar: 50 μm. (m) Quantification of the GFAP‐positive percentage area in (l). N = 4/group. (n) Representative confocal images of C3 and GFAP co‐staining of cortical sections from 3‐month‐old Foxo3 cKO mice with AAV‐FOXO3 or AAV‐GFP injections. Scale bar: 50 μm. O: Quantification of the GFAP‐positive percentage area in (n). N = 6/group. (p): Quantification of the C3‐positive percentage area in (n). N = 6/group. Male mice were used in both groups in (g–p). Data are presented as mean ±SEM. Significance determined by Student's t test or one‐way ANOVA with Tukey's multiple comparisons test. ns, not significant, *< 0.05, ***< 0.001, ****< 0.0001
FIGURE 2
FIGURE 2
FoxO3 deletion alters the overall lipid profile in the brain. (a) Heatmap showing differentially expressed genes (DEGs) from the RNA‐seq analysis of cortex samples of Foxo3 cKO and Ctrl mice at 3 months of age. FDR<0.05. N = 5. (b) qPCR analysis of the mRNA levels of Gfap, Aqp4, and Acot1 in the cortex samples of Foxo3 cKO and Ctrl mice at 3 months of age. N = 5. (c) qPCR analysis of the mRNA levels of Gbp2, Psmb8, and H2D1 in the cortex samples of Foxo3 cKO and Ctrl mice at 3 months of age. N = 3. (d) Volcano plot showing the fold change and p value distribution of the identified lipid species from lipidomics analysis of cortex samples of Foxo3 cKO and Ctrl mice at 3.5 months of age. Significantly upregulated lipids (red), significantly downregulated lipids (blue), and lipids with insignificant change (gray) are labeled. NCtrl=5; NcKO=7, < 0.05. (e) Quantification of total abundance of triglyceride (TG), phosphatidylglycerol (PG), phosphatidylethanolamine (PE), and ceramide (Cer) among the differentially regulated lipids in (d). NCtrl=5; NcKO=7. Male mice were used in both groups. Data are presented as mean ±SEM. Significance determined by Student's t test. #< 0.1, *< 0.05, **< 0.01, ***< 0.001, ****< 0.0001
FIGURE 3
FIGURE 3
FoxO3 deficiency impairs lipid metabolism and mitochondrial function in cultured astrocytes. (a) Representative confocal fluorescent images of Foxo3 cKO and Ctrl astrocytes after 8 h of 200 μM oleate‐BSA treatment followed by incubation in fresh medium for indicated times. Fixed cells were stained with BODIPY 493/503 (green) to label lipid droplets and immunostained with GFAP antibody (red) to label astrocytes. Scale bar: 25 μm. (b) Quantification of lipid droplets number in astrocytes in (a). N = 24. (c) Representative confocal fluorescent images of Foxo3 cKO astrocytes infected with AAVs expressing GFP, FOXO3 (AAA) and FOXO3 (ΔCT) in the lipid consumption assay. Fixed cells were stained with BODIPY 558/568 (green) to label lipid droplets and immunostained with GFAP antibody (red) to label astrocytes. Scale bar: 25 μm. (d) Quantification of lipid droplets number in astrocytes in (c). N = 25. (e) ATP levels from a luciferase‐based ATP assay in Foxo3 cKO and Ctrl astrocytes. Data were normalized to the protein levels determined by the BCA assay. N = 12. (f) ATP levels from a luciferase‐based ATP assay using Foxo3 cKO astrocytes infected with AAVs expressing GFP, FOXO3 (AAA), and FOXO3 (ΔCT). Data were normalized to the protein levels determined by the BCA assay. N = 8. G: The percentage area of Mitotracker‐positive staining in Foxo3 cKO and Ctrl astrocytes. NCtrl=32; NcKO=37. (h) The percentage area of Mitotracker‐positive staining in Foxo3 cKO astrocytes infected with AAVs expressing GFP, FOXO3 (AAA), and FOXO3 (ΔCT). N = 12. (i) Representative oxygen consumption rate (OCR) curve from Seahorse mito stress test in Foxo3 cKO and Ctrl primary astrocytes. Oligomycin, FCCP and Rotenone & antimycin A were added in order to the culture medium. Results were normalized to the protein levels as determined by the BCA assay. N = 3 for each data point. (j) Quantification of the maximum respiration and spare respiratory capacity in (i). N = 3. Data are presented as mean ±SEM. Significance determined by Student's t test or one‐way ANOVA with Tukey's multiple comparisons test. ns, not significant, *< 0.05, **< 0.01, ***< 0.001, ****< 0.0001
FIGURE 4
FIGURE 4
FoxO3 deficiency impairs Aβ uptake in astrocyte cultures. (a) Representative confocal fluorescent images of Foxo3 cKO and Ctrl astrocytes after 24 h of 100 nM fibril Aβ treatment. Fixed cells were immnunostained with 4G8 antibody (green) and GFAP antibody (red) to label Aβ and astrocytes, respectively. Scale bar: 25 μm. (b) Quantification of percentage area of 4G8‐positive staining in astrocytes in (a). NCtrl=38; NcKO=40. (c) Representative confocal fluorescent images of Foxo3 cKO astrocytes infected with AAVs expressing GFP, FOXO3 (AAA) and FOXO3 (ΔCT) after Aβ treatment. Fixed cells were immnunostained with 4G8 antibody (green) and GFAP antibody (red) to label Aβ and astrocytes, respectively. Scale bar: 25 μm. (d) Quantification of percentage area of 4G8‐positive staining in astrocytes in (c). N = 20. (e) Representative confocal fluorescent images of bead (green) uptake in Foxo3 cKO and Ctrl astrocytes. Fixed cells were immunostained with GFAP antibody (red) to label astrocytes. Scale bar: 50 μM. (f) Quantification of bead number in astrocytes in (e). N = 30. (g) Representative confocal fluorescent images of bead (green) uptake in Foxo3 cKO astrocytes infected with AAVs expressing GFP, FOXO3 (AAA), and FOXO3 (ΔCT). Fixed cells were immunostained with GFAP antibody (red) to label astrocytes. Scale bar: 50 μM. (h) Quantification of bead number in astrocytes in (g). N = 25. Data are presented as mean ±SEM. Significance determined by Student's t test or one‐way ANOVA with Tukey's multiple comparisons test. ns, not significant, ****< 0.0001
FIGURE 5
FIGURE 5
Loss of FoxO3 aggravates amyloid pathology and alters glial behaviors in 5xFAD mice. (a) Representative confocal images showing amyloid plaques in the cortex by Thioflavin S staining in 3.5‐month‐old Foxo3 cKO; 5xFAD and 5xFAD mice. Scale bar: 100 μm. (b) Quantification of Thioflavin S‐positive plaque number and percentage area in the cortex. N = 4. (c) Representative confocal images showing amyloid plaques in the cortex by Aβ immunostaining in FoxO3 cKO; 5xFAD and 5xFAD mice. Scale bar: 100 μm. (d) Quantification of Aβ‐positive plaque number and percentage area in the cortex. N = 4. (e) Representative confocal images showing amyloid plaques and plaque‐associated reactive astrocytes via Aβ and GFAP co‐staining in Foxo3 cKO; 5xFAD and 5xFAD mice. Scale bar: 30 μm. (f) Quantification of percentage of GFAP‐positive volume colocalized with Aβ in (e) using IMARIS software. N = 75. (g) Representative confocal images showing amyloid plaques and phagocytic microglia via Aβ and CD68 co‐staining in Foxo3 cKO; 5xFAD and 5xFAD mice. Scale bar: 20 μm. (h) Quantification of percentage of CD68‐positive volume colocalized with Aβ in (g) using IMARIS software. N = 75. (i): Representative confocal images of immunofluorescent co‐staining of Synaptophysin and PSD95 in Foxo3 cKO; 5xFAD and 5xFAD mice. Colocalized signals from two channels were also shown. Scale bar: 10 μm. (j) Quantification of the average number of Synaptophysin‐positive puncta and PSD95‐positive puncta per mm2 in (i). N = 36. (k) Quantification of the average number of Synaptophysin and PSD95 colocalized puncta number per mm2 in (i). N = 36. Male mice at 3.5 months of age were used in all analyses. Data are presented as mean ±SEM. Significance determined by Student's t test. *< 0.05, **< 0.01, ***< 0.001, ****< 0.0001
FIGURE 6
FIGURE 6
Astrocytic FoxO3 expression mitigates the pathological phenotypes in 5xFAD mice. (a) Representative confocal images showing amyloid plaques in the cortex by X04 staining of 5‐month‐old 5xFAD mice with AAV‐GFP or AAV‐FOXO3 injections. Scale bar: 100 μm. (b) Quantification of X04‐positive plaque number and percentage area in the cortex. N = 6. (c) Representative confocal images showing amyloid plaques in the cortex by Aβ staining of 5xFAD mice with AAV‐GFP or AAV‐FOXO3 injections. Scale bar: 100 μm. (d) Quantification of Aβ‐positive plaque number and percentage area in the cortex. N = 6. (e) Representative confocal images showing amyloid plaques and plaque‐associated reactive astrocytes via Aβ and GFAP co‐staining of 5xFAD mice with AAV‐GFP or AAV‐FOXO3 injections. Scale bar: 30 μm. (f) Quantification of percentage of GFAP‐positive volume colocalized with Aβ in (e) using IMARIS software. N = 90. (g) Representative confocal images showing amyloid plaques and phagocytic microglia via Aβ and CD68 co‐staining of 5xFAD mice with AAV‐GFP or AAV‐FOXO3 injections. Scale bar: 20 μm. (h) Quantification of percentage of CD68‐positive volume colocalized with Aβ in (g) using IMARIS software. N = 90. (i) Representative confocal images of immunofluorescent co‐staining of Synaptophysin and PSD95 of 5xFAD mice with AAV‐GFP or AAV‐FOXO3 injections. Colocalized signals from two channels were also shown. Scale bar: 10 μm. (j) Quantification of the average number of Synaptophysin‐positive puncta and PSD95‐positive puncta per mm2 in (i). N = 54. (k): Quantification of the average number of Synaptophysin and PSD95 colocalized puncta number per mm2 in (i). N = 54. Female mice at 5 months of age were used in all experiments. Data are presented as mean ±SEM. Significance determined by Student's t test. *< 0.05, **< 0.01, ****< 0.0001

Similar articles

Cited by

References

    1. Alarcón, R., Fuenzalida, C., Santibáñez, M., & von Bernhardi, R. (2005). Expression of scavenger receptors in glial cells. Comparing the adhesion of astrocytes and microglia from neonatal rats to surface‐bound beta‐amyloid. Journal of Biological Chemistry, 280(34), 30406–30415. 10.1074/jbc.M414686200 - DOI - PubMed
    1. Alic, N., & Partridge, L. (2011). Death and dessert: Nutrient signalling pathways and ageing. Current Opinion in Cell Biology, 23(6), 738–743. 10.1016/j.ceb.2011.07.006 - DOI - PMC - PubMed
    1. Bales, K. R. (2010). Brain lipid metabolism, apolipoprotein E and the pathophysiology of Alzheimer's disease. Neuropharmacology, 59(4–5), 295–302. 10.1016/j.neuropharm.2010.01.005 - DOI - PubMed
    1. Barber, C. N., & Raben, D. M. (2019). Lipid metabolism crosstalk in the brain: Glia and neurons. Frontiers in Cell Neuroscience, 13, 212. 10.3389/fncel.2019.00212 - DOI - PMC - PubMed
    1. Barthel, A., Schmoll, D., & Unterman, T. G. (2005). FoxO proteins in insulin action and metabolism. Trends in Endocrinology and Metabolism, 16(4), 183–189. 10.1016/j.tem.2005.03.010 - DOI - PubMed

Publication types