. 2021 Sep 3;129(6):650-665.
doi: 10.1161/CIRCRESAHA.121.318473. Epub 2021 Jul 12.

PDE5 Inhibition Suppresses Ventricular Arrhythmias by Reducing SR Ca2+ Content

Affiliations

PDE5 Inhibition Suppresses Ventricular Arrhythmias by Reducing SR Ca2+ Content

David C Hutchings et al. Circ Res. .

Abstract

[Figure: see text].

Keywords: calcium; long QT syndrome; sildenafil citrate.


Figures

Figure 1.
Figure 1.
/Kr block with dofetilide prolongs ventricular repolarization leading to afterdepolarizations and triggered ventricular arrhythmias.A, Effect of dofetilide (Dofet) on QT interval and heart rate. Representative paired surface ECG recordings (top) and mean data (bottom). Effect of dofetilide on QT interval is significant at all concentrations (3 µg/kg, P=0.02; 6 µg/kg, P=0.02; 9 µg/kg, P=0.01; 12 µg/kg, P=0.006; 15 µg/kg, P=0.01; CTRL, control). Effect of dofetilide on HR (heart rate) is significant at ≥12 µg/kg (12 µg/kg, P=0.04; 15 µg/kg, P=0.03). For QT interval and HR, paired data from n=6 animals, 1-way ANOVA. B, Effect of dofetilide on action potential duration. Top, Representative paired monophasic action potential (MAP) recordings. Bottom, Mean data. Effect is significant at concentrations ≥9 µg/kg (3 µg/kg, P=0.18; 6 µg/kg, P=0.18; 9 µg/kg, P=0.018; 12–15 µg/kg, P<0.001; paired data from n=5 animals; Friedman test). C, MAP traces recorded in sinus rhythm showing dofetilide-induced early afterdepolarizations and delayed afterdepolarizations (indicated by dashed and continuous arrows, respectively). D, Representative surface ECG recording showing Torsades de Pointes (TdP) triggered by premature ventricular complex (PVC) arising on the preceding T wave (see arrows). E, Summary data showing PVC timing in relation to T-wave apex. PVCs inducing TdP occur earlier and are more closely aligned with the apex of the T wave compared with PVCs that do not induce TdP. Upper inset shows representative PVCs and their timing from the start of preceding T wave, with PVC causing TdP (left) and PVC which does not cause TdP (right). APD indicates action potential duration.
Figure 2.
Figure 2.
Sildenafil suppresses dofetilide-induced ventricular arrhythmias.A, Representative surface ECG recording from a sheep displaying dofetilide-induced premature ventricular complexes (PVCs) and Torsades de Pointes (TdP). A 10 milligram bolus intravenous injection of sildenafil given as shown. B, Mean data showing effect of sildenafil on the (Bi) incidence of TdP, (Bii) frequency of PVCs (at 10 min after sildenafil), and (Biii) probability of PVCs causing TdP. Bi, For Fisher's exact test from 11 animals (control) and 9 animals (sildenafil). Bii, For Wilcoxon signed-rank test on paired data from 8 animals. Biii, For paired t test from 6 animals.
Figure 3.
Figure 3.
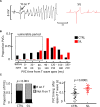
Sildenafil delays premature ventricular complexes (PVCs) relative to T-wave apex.A, Representative surface ECG recordings of a PVC in control with R on T effect (left) and in the presence of sildenafil (right). B, Effect of sildenafil (10 mg IV bolus) on PVC timing in relation to the preceding T wave. Sildenafil delays PVCs such that they occur further from the T-wave apex and beyond the vulnerable period. C, Left, Mean data on proportion of PVCs occurring on T wave in sildenafil (control, n=84 PVCs from 8 animals; sildenafil, n=33 PVCs from 5 animals; χ2 test). C, Right, Mean data summarizing effect of sildenafil on timing of PVCs after the apex of the preceding T wave. Open circles indicate mean data for each animal, and closed circles indicate individual PVCs. Linear mixed modeling t test from n=5 animals.
Figure 4.
Figure 4.
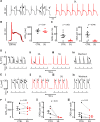
Sildenafil suppresses afterdepolarizations in vivo and isolated myocytes without modifying monophasic action potential duration.A, Representative paired in vivo monophasic action potential (MAP) recordings in sinus rhythm in control (left) and sildenafil (right). Early afterdepolarizations (EADs) and delayed afterdepolarizations (DADs) are indicated by dashed and continuous arrows, respectively. B, Effect of sildenafil on monophasic action potential duration. Representative MAP traces from the same animal (left) and summary data (right). Paired data on APD90 from 4 animals, Wilcoxon signed-rank test. C, Effect of sildenafil on afterdepolarizations. Mean data for DADs (left) and EADs (right). Unpaired data on afterdepolarizations from 5 to 6 animals, Mann-Whitney U test. Di, Example paired current clamp (0.25 Hz stimulation) recordings of a myocyte showing DADs when exposed to dofetilide and low K+. DADs are indicated by arrows. Dii, After a 10 s exposure to sildenafil (20 nmol/L). Diii, After a 40 s exposure to sildenafil. Div, Washout of sildenafil. Ei, Example paired current clamp recordings of a myocyte displaying EADs in dofetilide and low K+. Dashed arrows indicate EADs. Eii, Following a 10 s exposure to sildenafil. Eiii, Following a 40 s exposure to sildenafil. Div, Following washout of sildenafil. F, Summary data for cells in dofetilide and low K+. Action potential duration, recorded from cells not showing EADs (Fi), DADs (Fii), and EADs (Fiii). For APD90, paired data from 6 cells/3 animals, t test. For DADs and EADs, paired data from 7 cells/3 animals, Wilcoxon signed-rank test. APD indicates action potential duration.
Figure 5.
Figure 5.
Sildenafil suppresses Ca2+ waves via a reduction in sarcoplasmic reticulum (SR) content.Ai, Representative trace from a cell stimulated under voltage clamp in 15 mmol/L Ca2+ demonstrating the effect of sildenafil (1 µmol/L) on Ca2+ wave occurrence. Diastolic Ca2+ waves are indicated by arrows. Cells were held at −40 mV with a 100-ms depolarization step to +10 mV. Aii, Mean data summarizing the effect of sildenafil on Ca2+ waves (36 cells from 20 animals, χ2 test). B, Paired [Ca2+]i and membrane current traces at different time points from a cell under voltage clamp exposed to sildenafil: before sildenafil (left), after a 10 s exposure to sildenafil (middle), and after 40 s exposure to sildenafil (right). C, Effect of sildenafil on SR Ca2+ content and its relationship to Ca2+ waves. Ci, Representative paired current recordings during application of caffeine. Cii, Mean data summarizing the effect of sildenafil on SR content. Ciii, Mean data summarizing the effect of sildenafil on size of waves. For SR content; 16 cells/12 animals (waves in control), 10 cells/10 animals (waves in sildenafil), and 17 cells/10 animals (no waves in sildenafil), unpaired t test in all comparisons. For wave peak INCX; 8 cells/6 animals, 1 sample t test. CAFF indicates caffeine.
Figure 6.
Figure 6.
The effects of sildenafil on sarcolemmal Ca2+ fluxes.A, Effect of sildenafil on ICa-L. Representative paired current recordings under voltage clamp (left) and paired summary data (right). n=26 cells/16 animals. B. Effect of sildenafil on SERCA (sarcoplasmic endoplasmic reticulum Ca2+ ATPase) activity. Representative Ca2+ transients from the same cell (left) and unpaired summary data for kSERCA (right). Control n=10 cells/10 animals, sildenafil n=21 cells/12 animals. C, Applying sildenafil is accompanied by a transient (initial 4 s) increase in the INCX tail current. Representative paired repolarization (NCX [Na+-Ca2+ exchanger]) tail currents immediately before sildenafil and 4 s after sildenafil (left), and summary data (right). Experiments performed in 10 to 15 mmol/L Ca2+ with and without sildenafil (1 µmol/L). Paired t test for all.
Figure 7.
Figure 7.
Sildenafil decreases background Ca2+ influx reducing SR Ca2+ content.A, Representative time course of a cell under voltage clamp displaying spontaneous waves, showing the effect of sildenafil on [Ca2+]i (top) and membrane current (bottom). B, Comparison between control and sildenafil at steady state. C, Summary data showing the effect of sildenafil on wave frequency (Bi), wave integral INCX (Bii), and Ca2+ efflux per second (Biii). n=12 cells/7 animals, paired t test. Experiments performed in 10 to 15 mmol/L Ca2+ with and without sildenafil (1 µmol/L).
Figure 8.
Figure 8.
Mechanism by which sildenafil suppresses triggered action potentials in isolated myocytes.A, The effect of sildenafil on Ca2+ waves is sufficient to prevent triggered action potentials. Representative recording under current clamp of a cell displaying spontaneous waves and triggered action potentials. B, Mean summary data of sildenafil effect on waves (Bi) and triggered action potentials (Bii). For waves, n=9 cells/3 animals. For triggered action potentials, n=5 cells/3 animals, Wilcoxon signed-rank test. Biii, Paired recordings of stimulated action potentials before and after sildenafil. K+ was reduced to 2 mmol/L and Ca2+ elevated to 5 to 7.5 mmol/L to induce Ca2+ waves. C, Sildenafil suppression of Ca2+ waves is lost in the presence of PKG (protein kinase G) inhibitor KT5823. C, Left, Representative Ca2+ recording in a cell displaying waves while being stimulated under voltage clamp. C, Right, mean paired data of proportion of cells displaying waves. n=13 cells/8 animals, Fisher’s exact test. D, Summary diagram. 1, IKr block with dofetilide prolongs the action potential and QT interval, leading to an increase in Ca entry via L-type Ca2+ channel (LTCC; 2a) and reducing Ca efflux on NCX (Na+-Ca2+ exchanger; 2b). In combination, this leads to an increase in sarcoplasmic reticulum (SR) Ca2+ content (3), and spontaneous Ca2+ release (4), giving rise to afterdepolarizations and ventricular arrhythmias (5). 6, Sildenafil inhibits PDE5 (phosphodiesterase 5) thus activating PKG. PKG-dependent effects include reducing Ca2+ influx via the LTCC (7a), reducing background Ca2+ influx (7b), and reducing SERCA (sarcoplasmic endoplasmic reticulum Ca2+ ATPase; 7c). These combined effects reduce SR Ca2+ content below threshold (8), preventing delayed afterdepolarizations and arrhythmias (9).

Comment in

References

    1. Jervell A, Lange-nielsen F. Congenital deaf-mutism, functional heart disease with prolongation of the Q-T interval and sudden death. Am Heart J. 1957;54:59–68. doi: 10.1016/0002-8703(57)90079-0 - PubMed
    1. Moss AJ, Schwartz PJ, Crampton RS, Tzivoni D, Locati EH, MacCluer J, Hall WJ, Weitkamp L, Vincent GM, Garson A., Jr.The long QT syndrome. Prospective longitudinal study of 328 families. Circulation. 1991;84:1136–1144. doi: 10.1161/01.cir.84.3.1136 - PubMed
    1. January CT, Riddle JM. Early afterdepolarizations: mechanism of induction and block. A role for L-type Ca2+ current. Circ Res. 1989;64:977–990. doi: 10.1161/01.res.64.5.977 - PubMed
    1. Němec J, Kim JJ, Gabris B, Salama G. Calcium oscillations and T-wave lability precede ventricular arrhythmias in acquired long QT type 2. Heart Rhythm. 2010;7:1686–1694. doi: 10.1016/j.hrthm.2010.06.032 - PMC - PubMed
    1. Volders PG, Vos MA, Szabo B, Sipido KR, de Groot SH, Gorgels AP, Wellens HJ, Lazzara R. Progress in the understanding of cardiac early afterdepolarizations and Torsades de Pointes: time to revise current concepts. Cardiovasc Res. 2000;46:376–392. doi: 10.1016/s0008-6363(00)00022-5 - PubMed

Publication types

MeSH terms