. 2021 Aug 10;144(6):410-422.
doi: 10.1161/CIRCULATIONAHA.120.052430. Epub 2021 Jul 12.

Quantifying and Understanding the Higher Risk of Atherosclerotic Cardiovascular Disease Among South Asian Individuals: Results From the UK Biobank Prospective Cohort Study

Affiliations

Quantifying and Understanding the Higher Risk of Atherosclerotic Cardiovascular Disease Among South Asian Individuals: Results From the UK Biobank Prospective Cohort Study

Aniruddh P Patel et al. Circulation. .

Abstract

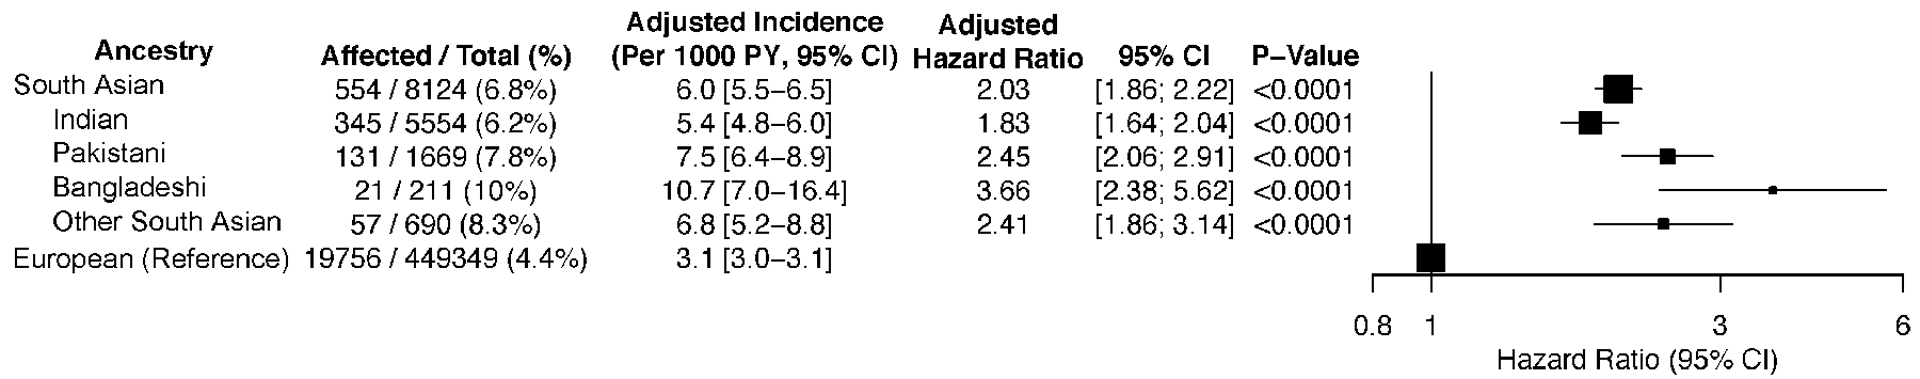
Background: Individuals of South Asian ancestry represent 23% of the global population, corresponding to 1.8 billion people, and have substantially higher risk of atherosclerotic cardiovascular disease compared with most other ethnicities. US practice guidelines now recognize South Asian ancestry as an important risk-enhancing factor. The magnitude of enhanced risk within the context of contemporary clinical care, the extent to which it is captured by existing risk estimators, and its potential mechanisms warrant additional study.

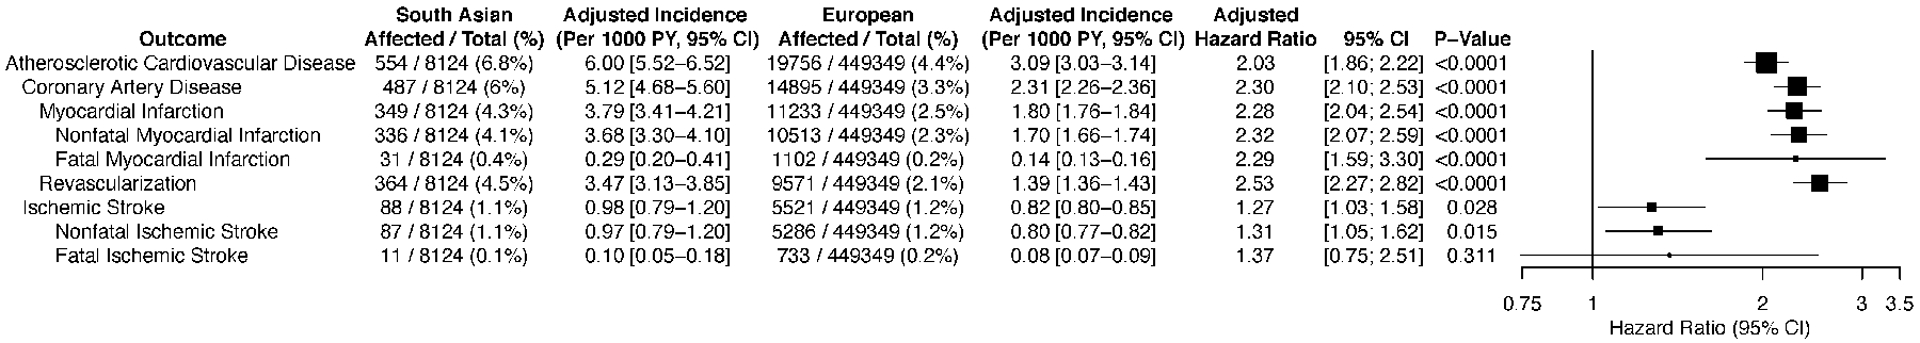
Methods: Within the UK Biobank prospective cohort study, 8124 middle-aged participants of South Asian ancestry and 449 349 participants of European ancestry who were free of atherosclerotic cardiovascular disease at the time of enrollment were examined. The relationship of ancestry to risk of incident atherosclerotic cardiovascular disease-defined as myocardial infarction, coronary revascularization, or ischemic stroke-was assessed with Cox proportional hazards regression, along with examination of a broad range of clinical, anthropometric, and lifestyle mediators.

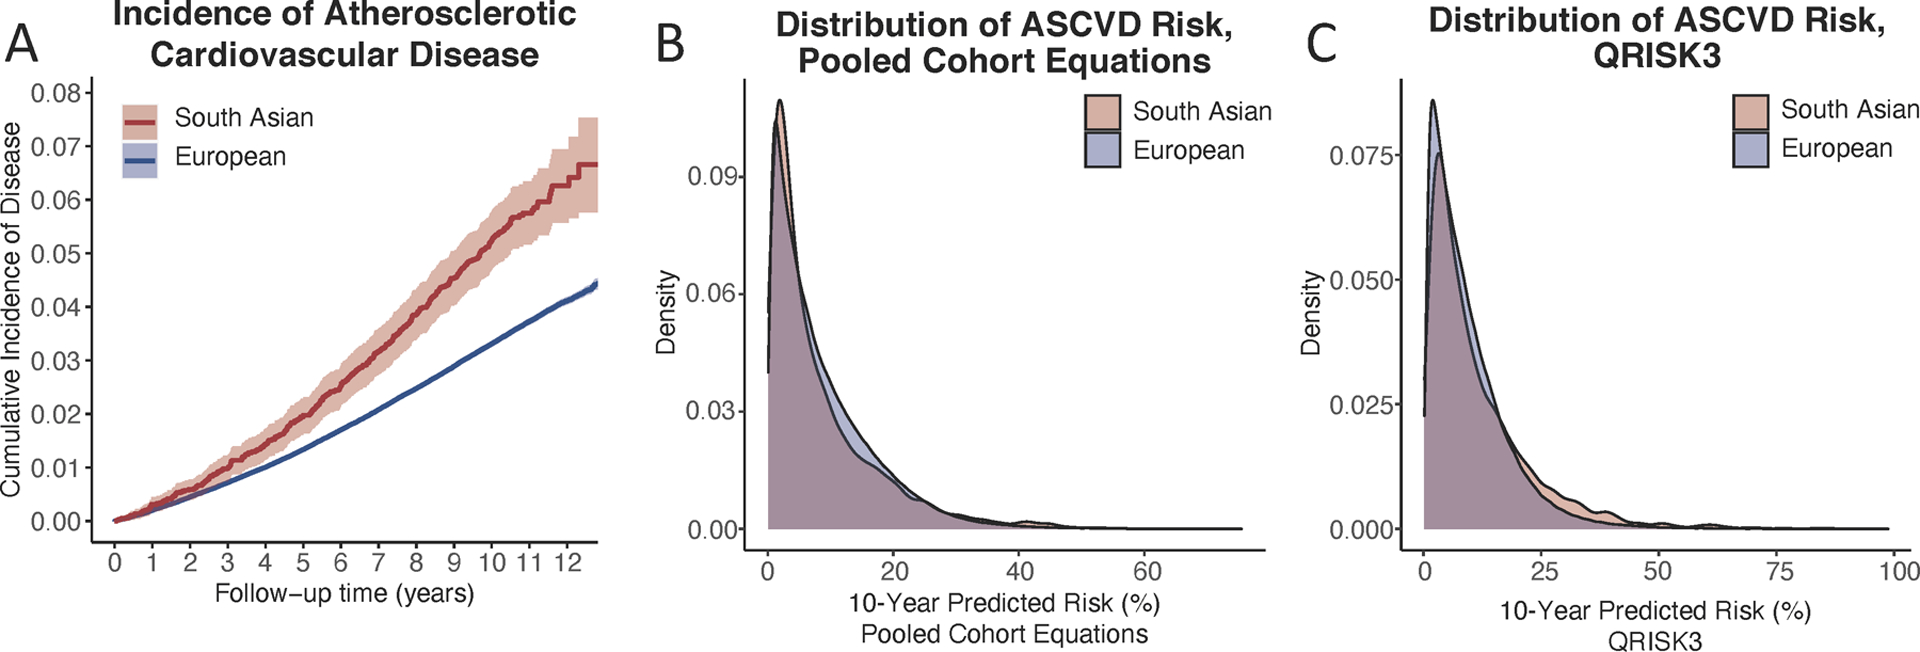
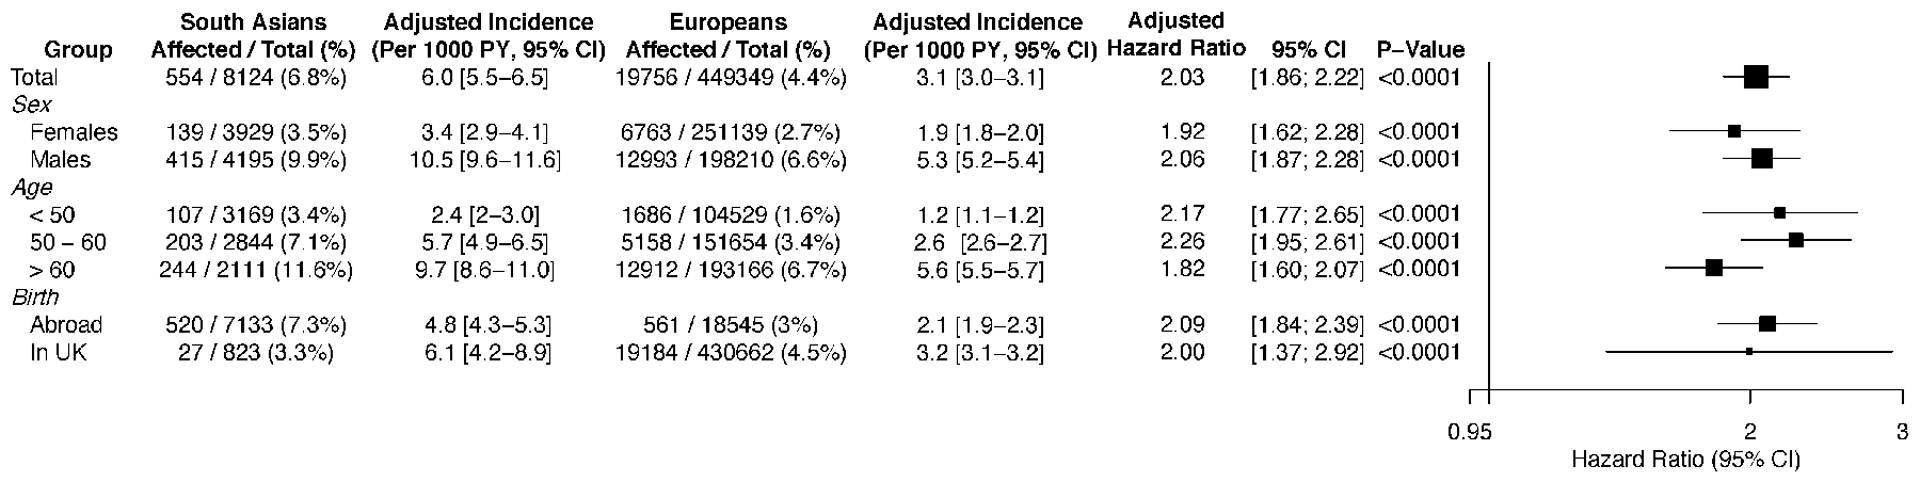
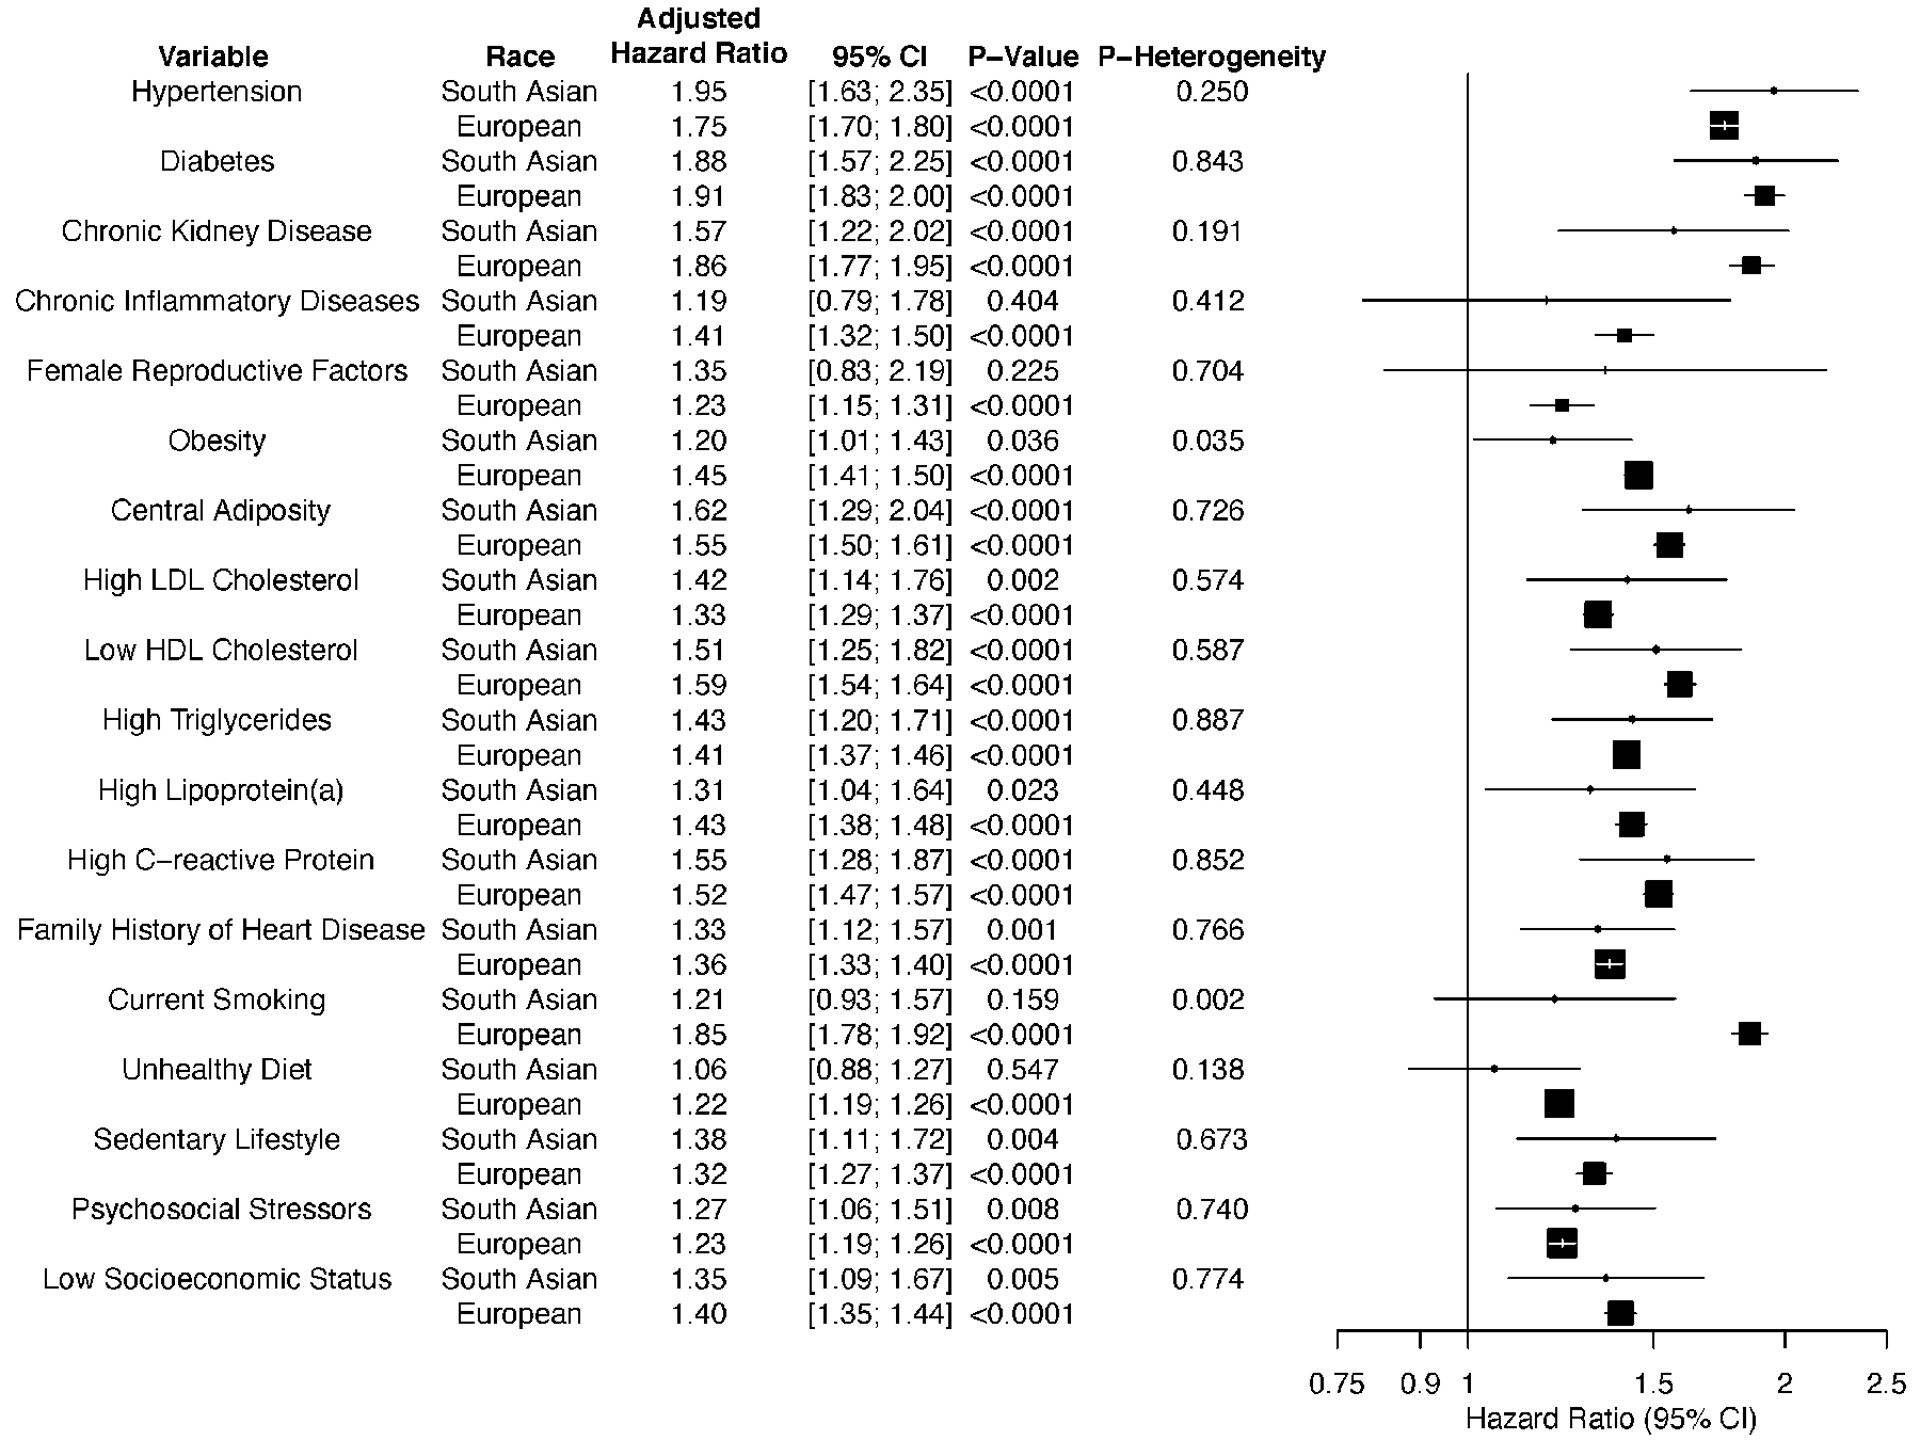
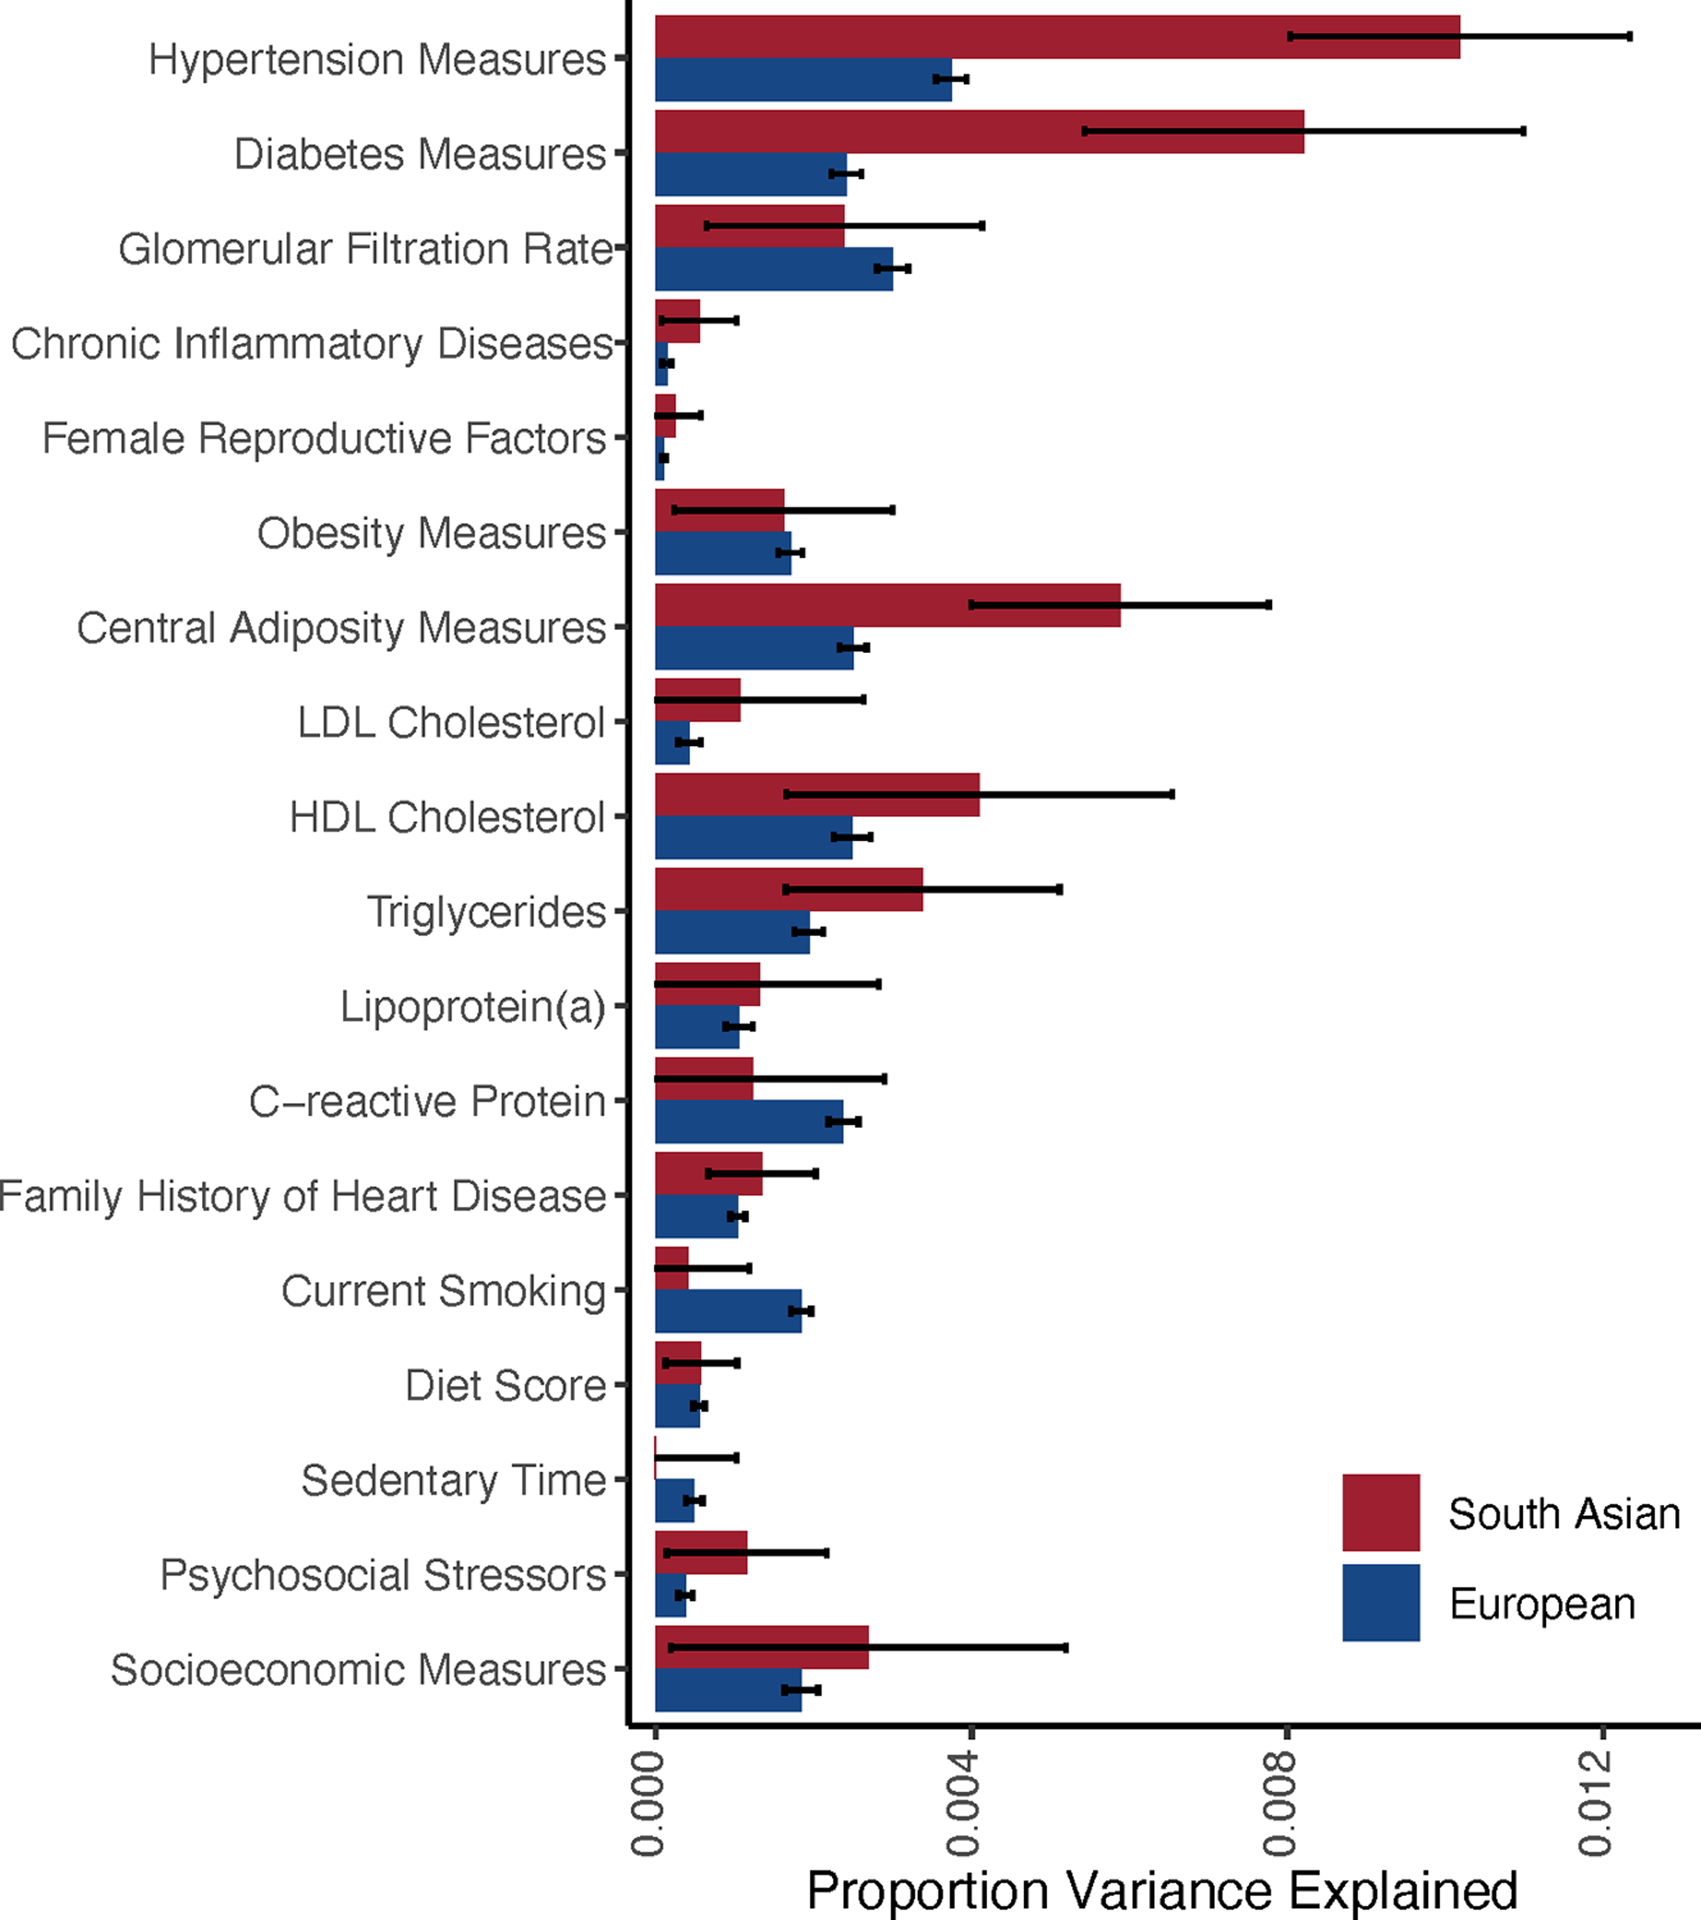
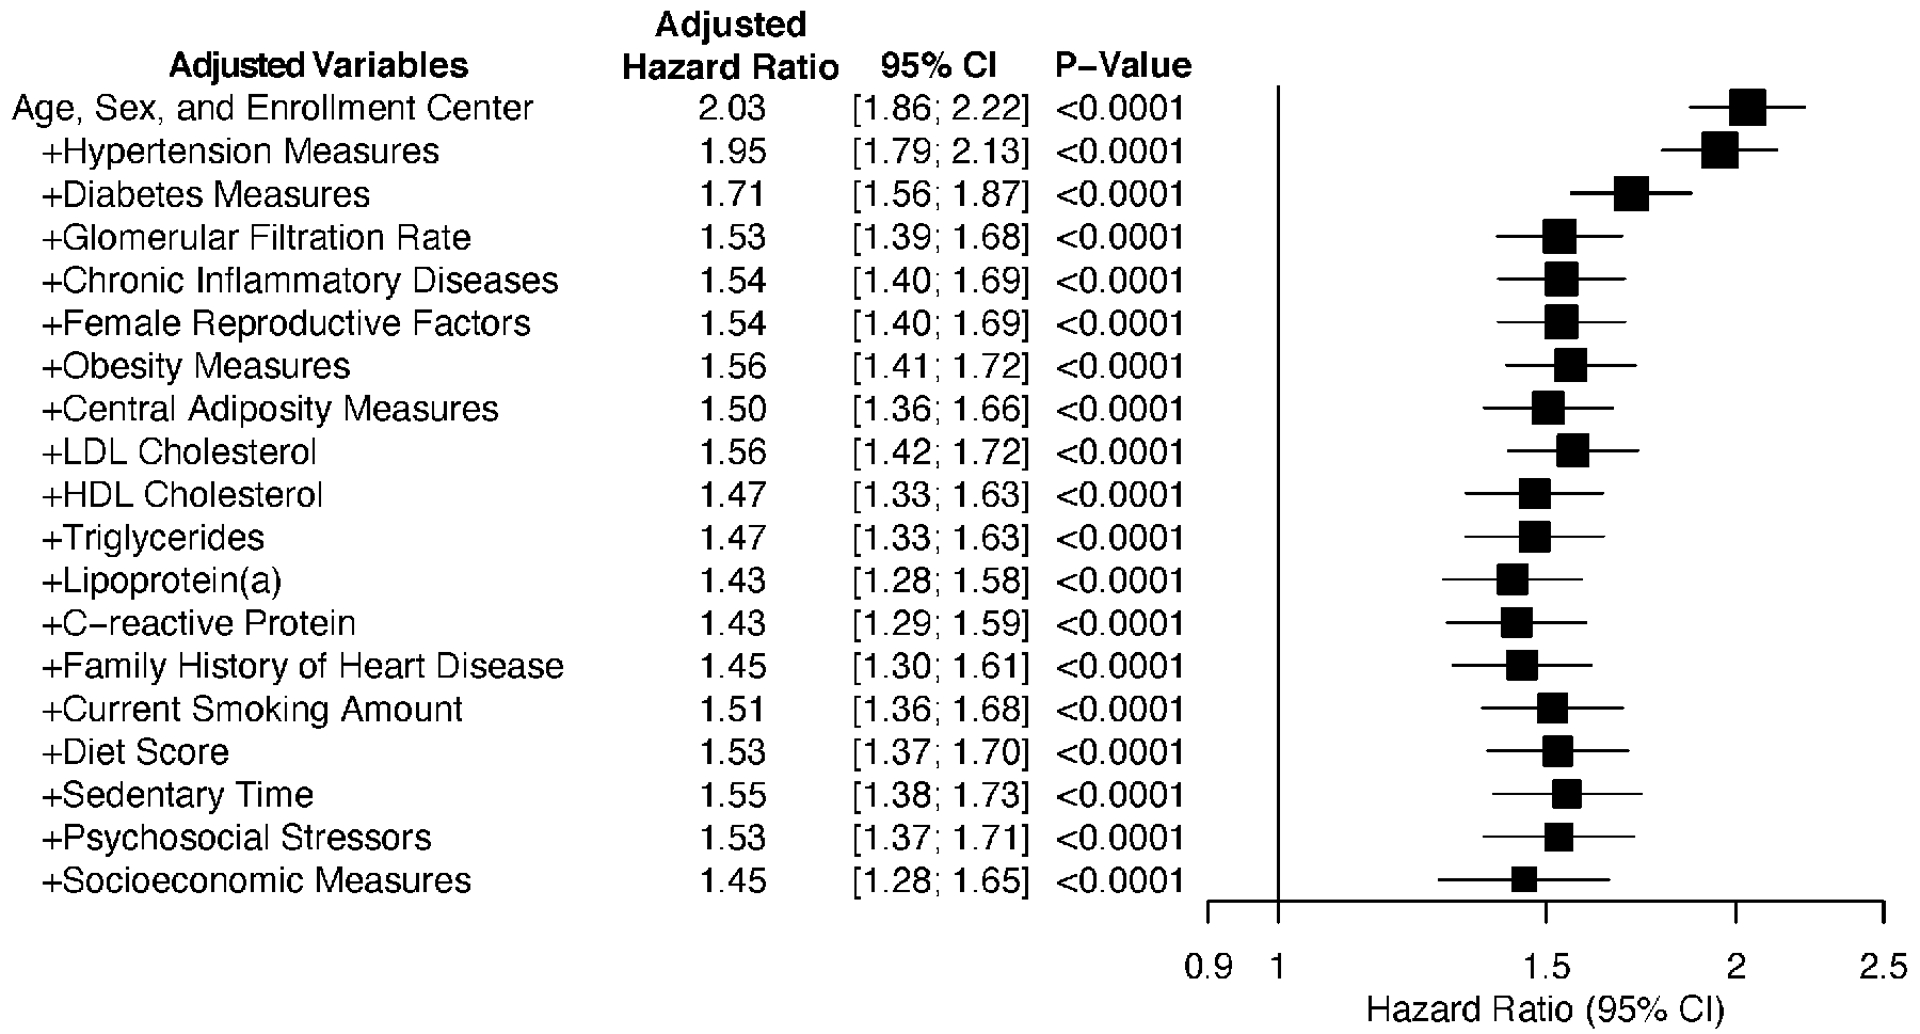
Results: The mean age at study enrollment was 57 years, and 202 405 (44%) were male. Over a median follow-up of 11 years, 554 of 8124 (6.8%) individuals of South Asian ancestry experienced an atherosclerotic cardiovascular disease event compared with 19 756 of 449 349 (4.4%) individuals of European ancestry, corresponding to an adjusted hazard ratio of 2.03 (95% CI, 1.86-2.22; P<0.001). This higher relative risk was largely consistent across a range of age, sex, and clinical subgroups. Despite the >2-fold higher observed risk, the predicted 10-year risk of cardiovascular disease according to the American Heart Association/American College of Cardiology Pooled Cohort equations and QRISK3 equations was nearly identical for individuals of South Asian and European ancestry. Adjustment for a broad range of clinical, anthropometric, and lifestyle risk factors led to only modest attenuation of the observed hazard ratio to 1.45 (95% CI, 1.28-1.65, P<0.001). Assessment of variance explained by 18 candidate risk factors suggested greater importance of hypertension, diabetes, and central adiposity in South Asian individuals.

Conclusions: Within a large prospective study, South Asian individuals had substantially higher risk of atherosclerotic cardiovascular disease compared with individuals of European ancestry, and this risk was not captured by the Pooled Cohort Equations.

Keywords: continental population groups; ethnic groups; ischemic stroke; myocardial infarction; risk; risk factor.


Conflict of interest statement

DISCLOSURES:

U.K. and K.N. are employees of IBM Research. A.V.K. has served as a scientific advisor to Sanofi, Medicines Company, Maze Pharmaceuticals, Navitor Pharmaceuticals, Verve Therapeutics, Amgen, Color, and Columbia University (NIH); received speaking fees from Illumina, MedGenome, Amgen, and the Novartis Institute for Biomedical Research and received sponsored research agreements from the Novartis Institute for Biomedical Research and IBM Research. The remaining authors have no disclosures.

Figures

FIGURE 1:
FIGURE 1:
Observed and predicted incidence of atherosclerotic cardiovascular disease in individuals of South Asian versus European ancestry A: Unadjusted cumulative incidence of initial atherosclerotic cardiovascular disease (ASCVD) events over length of follow-up stratified by South Asian or European ancestry. B: Distribution of unadjusted 10-year predicted risk of ASCVD by the AHA/ACC Pooled Cohort Equations, stratified by individuals of South Asian and European ancestry. C: Distribution of unadjusted 10-year predicted risk of ASCVD by the QRISK3 equations, stratified by individuals of South Asian and European ancestry.
FIGURE 2:
FIGURE 2:
Adjusted hazard ratios of atherosclerotic cardiovascular disease and component endpoints for South Asians relative to individuals of European ancestry Adjusted hazard ratios with corresponding 95% confidence intervals and p values for composite atherosclerotic cardiovascular disease endpoint (coronary artery disease and ischemic stroke), composite coronary artery disease endpoint (myocardial infarction and coronary revascularization procedure) and individual component endpoints stratified by nonfatal and fatal outcomes, comparing individuals of South Asian ancestry to individuals of European ancestry, calculated using Cox proportional hazards regression models with covariates of enrollment age, sex, and testing center. Adjusted incidence rates estimated as events per 1000 person-years (PY) of follow up time and adjusted for age and sex using Poisson regression.
FIGURE 3:
FIGURE 3:
Adjusted hazard ratios of atherosclerotic cardiovascular disease for South Asians relative to individuals of European ancestry stratified by demographic subgroups Adjusted hazard ratios with corresponding 95% confidence intervals and p values for composite cardiovascular disease endpoint, comparing individuals of South Asian ancestry to individuals of European ancestry, divided by subgroups of sex, and age (in years), and place of birth, calculated using Cox proportional hazards regression models with covariates of enrollment age, sex, and testing center. Adjusted incidence rates estimated as events per 1000 person-years (PY) of follow up time and adjusted for age and sex using Poisson regression.
FIGURE 4:
FIGURE 4:
Adjusted hazard ratios of coronary artery disease for South Asian ethnic subgroups relative to individuals of European ancestry Adjusted hazard ratios with corresponding 95% confidence intervals and p values for composite atherosclerotic cardiovascular disease endpoint, comparing individuals of different South Asian ancestry sub-groups to individuals of European ancestry, calculated using Cox proportional hazards regression models with covariates of enrollment age, sex, and testing center. Other South Asian denotes individuals identifying country of origin as Bhutan, Maldives, Nepal, or Sri Lanka. Adjusted incidence rates estimated as events per 1000 person-years (PY) of follow up time and adjusted for age and sex using Poisson regression.
FIGURE 5:
FIGURE 5:
Adjusted hazard ratios for atherosclerotic cardiovascular disease, per variable category of interest Adjusted hazard ratios with corresponding 95% confidence intervals and p values for atherosclerotic cardiovascular disease risk imparted by variable of interest, stratified by ancestry, calculated using Cox proportional hazards regression models with covariates of enrollment age, sex, and testing center. LDL: Low-density lipoprotein. HDL: High-density lipoprotein. Chronic kidney disease: glomerular filtration rate less than 60 mL/min/1.73m2. Female reproductive factors: history of menopause before age 40, preterm delivery, fetus with intrauterine growth retardation, gestational hypertension, pre-eclampsia, eclampsia, gestational diabetes, or polycystic ovary syndrome. Chronic inflammatory diseases: rheumatoid arthritis, psoriasis, lupus erythematosus, or human immunodeficiency virus infection. P-heterogeneity compares hazard ratios between ancestry groups and is deemed significant if <0.05.
FIGURE 6:
FIGURE 6:
Proportion of variance in atherosclerotic cardiovascular disease risk explained by risk factor group Proportion of variance explained was calculated for each disease using the Nagelkerke’s pseudo-R2 metric. The R2 was calculated for the full model inclusive of the risk factor group of interest plus the baseline covariates (age at enrollment, sex, and enrollment center) minus R2 for the baseline covariates alone, thus yielding an estimate of the explained proportion of variance attributable to each risk factor. Hypertension measures: Prior diagnosis of hypertension, systolic blood pressure, and diastolic blood pressure. Diabetes measures: Prior diagnosis of diabetes and glycated hemoglobin concentration. Obesity measures: body mass index and impedance-measured body fat percentage. Central adiposity measures: waist-hip ratio and impedance-measured trunk fat percentage. LDL: Low-density lipoprotein. HDL: High-density lipoprotein. Chronic kidney disease: glomerular filtration rate less than 60 mL/min/1.73m2. Female reproductive factors: history of menopause before age 40, preterm delivery, fetus with intrauterine growth retardation, gestational hypertension, pre-eclampsia, eclampsia, gestational diabetes, or polycystic ovary syndrome. Chronic inflammatory diseases: rheumatoid arthritis, psoriasis, lupus erythematosus, or human immunodeficiency virus infection. Socioeconomic measures: Average household income and Townsend Deprivation Index.
FIGURE 7:
FIGURE 7:
Adjusted hazard ratios for individuals of South Asian ancestry compared with European ancestry, with effects of additive covariates Adjusted hazard ratios with corresponding 95% confidence intervals and p values for composite cardiovascular disease endpoint, comparing individuals of South Asian ancestry to individuals of European ancestry, calculated using Cox proportional hazards regression models with covariates of enrollment age, sex, and testing center, and iterative addition of additional covariates as ordered. Hypertension measures: Prior diagnosis of hypertension, systolic blood pressure, and diastolic blood pressure. Diabetes measures: Prior diagnosis of diabetes and glycated hemoglobin concentration. Obesity measures: body mass index and impedance-measured body fat percentage. Central adiposity measures: waist-hip ratio and impedance-measured trunk fat percentage. LDL: Low-density lipoprotein. HDL: High-density lipoprotein. Female reproductive factors: history of menopause before age 40, preterm delivery, fetus with intrauterine growth retardation, gestational hypertension, pre-eclampsia, eclampsia, gestational diabetes, or polycystic ovary syndrome. Chronic inflammatory diseases: rheumatoid arthritis, psoriasis, lupus erythematosus, or human immunodeficiency virus infection. Socioeconomic measures: Average household income and Townsend Deprivation Index.

Comment in

Similar articles

Cited by

References

    1. Heron M CDC stacks. Deaths: leading causes for 2017 – 79488. Stephen B. Thacker CDC Library collection Accessed2019 Sep 22. Available from: https://stacks.cdc.gov/view/cdc/79488.
    1. World Health Organization. The top 10 causes of death. December 9, 2020 Accessed2020 Jun 13. Available from: https://www.who.int/news-room/fact-sheets/detail/the-top-10-causes-of-death.
    1. Roth GA, Johnson C, Abajobir A, Abd-Allah F, Abera SF, Abyu G, Ahmed M, Aksut B, Alam T, Alam K, et al.Global, Regional, and National Burden of Cardiovascular Diseases for 10 Causes, 1990 to 2015. J Am Coll Cardiol. 2017;70:1–25. - PMC - PubMed
    1. Central Intelligence Agency. South Asia: India — The World Factbook - Central Intelligence Agency. Accessed2020 Jul 30. Available from: https://www.cia.gov/library/publications/the-world-factbook/geos/in.html.
    1. US Census Bureau UCBPI. 2010 Census Shows Asians are Fastest-Growing Race Group. Accessed2020 Sep 9. Available from: https://www.census.gov/newsroom/releases/archives/2010_census/cb12-cn22.....

Publication types