

Seasonal variation and size distribution in the airborne indoor microbial concentration of residential houses in Delhi and its impact on health
- PMID: 34248257
- PMCID: PMC8254435
- DOI: 10.1007/s10453-021-09718-3
Seasonal variation and size distribution in the airborne indoor microbial concentration of residential houses in Delhi and its impact on health
Abstract
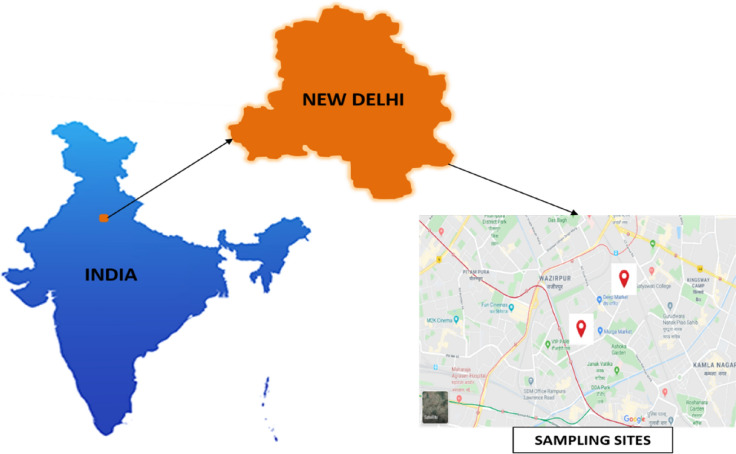
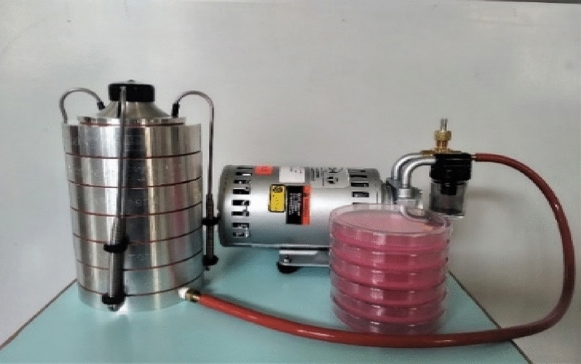
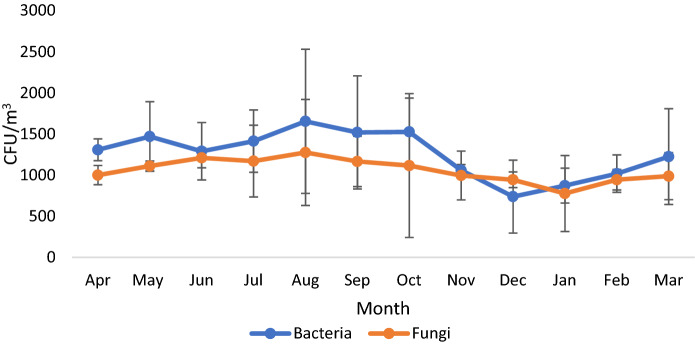
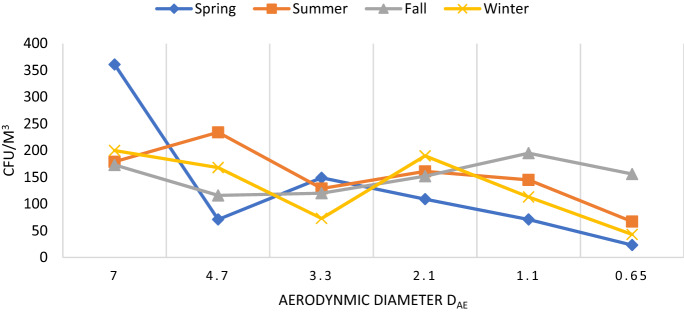
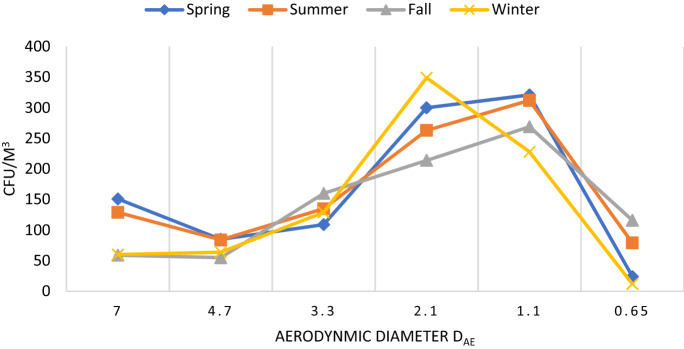
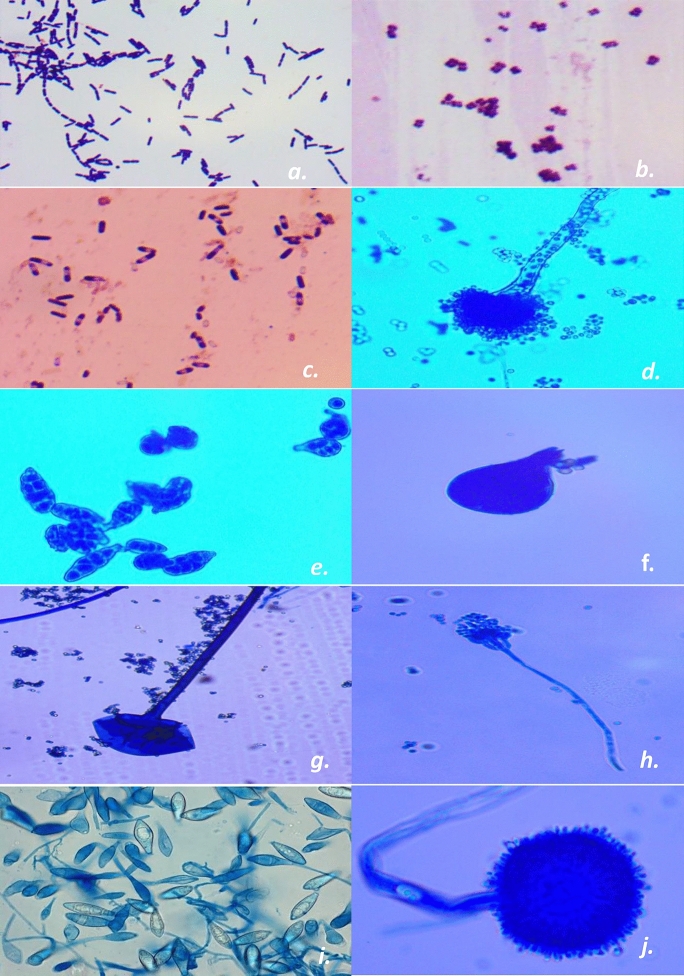
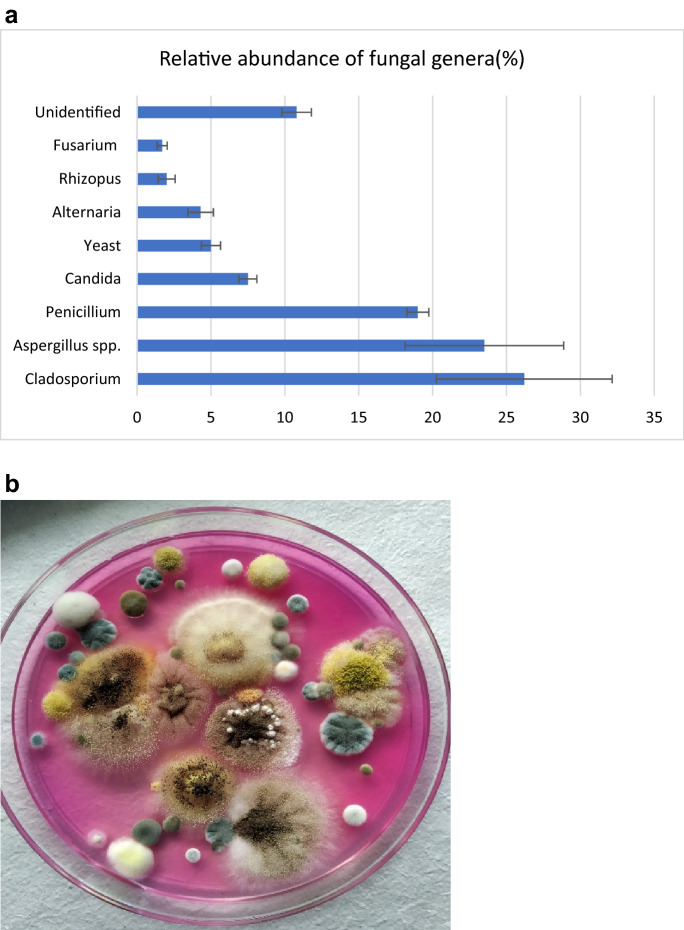
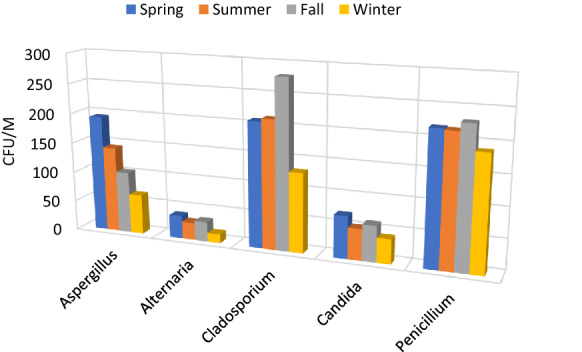
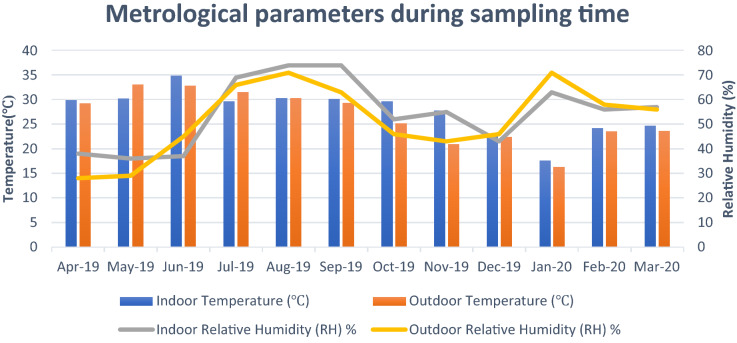
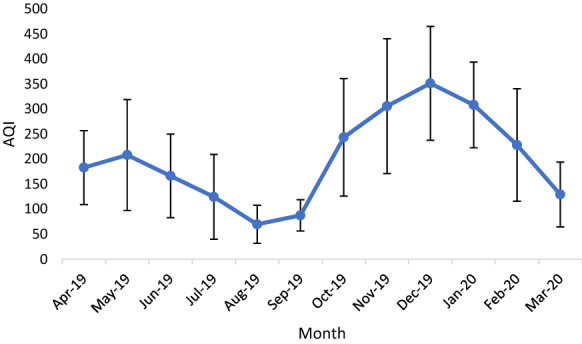
Exposure of microbial agents in the air of indoor dwellings is associated with effects on respiratory and general health. The current study was conducted in the urban area of Delhi Metropolis for the seasonal quantitative assessment of viable microbial indoor air quality. Bioaerosol measurement was conducted by using Anderson six stage impactor with cut-off diameters of 7.0, 4.7, 3.3, 2.1, 1.1, and 0.65 µm) throughout the all the seasons (April 2019 to March 2020). Meteorological parameters such as temperature and relative humidity were measured to check their effect on microbial survival. Air quality index data of the sampling area were recorded by DPCC air quality monitoring system, Ashok Vihar, Delhi. The highest (1654 ± 876.87 CFU/m3) and lowest (738 ± 443.59 CFU/m3) mean bacterial concentration in houses was recorded in August and December, respectively. Similarly, the highest fungal concentration (1275 ± 645.22 CFU/m3) was found in August and the lowest in (776 ± 462.46 CFU/m3) in January. Bacterial respirable fraction shows an irregular pattern in different seasons. In the case of fungi, the respirable fraction of 2.1 and 1.1 contributes more than 60% of total culturable bioaerosols in all seasons. Bacterial genera including Staphylococcus, Micrococcus, and Streptobacillus were most dominant, and Cladosporium, Aspergillus, Penicillium, and Alternaria were the most dominant fungal genera observed indoors. The results of this study suggest that higher respirable fungal fraction might penetrate deeper into the lungs and cause various health effects. A higher concentration of bioaerosols in outdoor areas than indoor shows that the source of indoor bioaerosols is outdoor air.
Supplementary information: The online version contains supplementary material available at 10.1007/s10453-021-09718-3.
Keywords: Bacteria; Bioaerosols; Fungi; Indoor air quality; Size distribution.
© The Author(s), under exclusive licence to Springer Nature B.V. 2021.
Conflict of interest statement
Conflict of interestThe authors declare that they have no conflict of interest.
Figures
References
-
- Air Quality Index (AQI) basics.(2020) (EPA) AirNow. Available at: https://cfpub.epa.gov/airnow/index.cfm?action=aqibasics.aqi Accessed on: October 17 2020
-
- Asif A, Zeeshan M, Hashmi I, Zahid U, Bhatti MF. Microbial quality assessment of indoor air in a large hospital building during winter and spring seasons. Building and Environment. 2018;135:68–73. doi: 10.1016/j.buildenv.2018.03.010. - DOI
LinkOut - more resources
Full Text Sources
Miscellaneous