. 2021 Jun 24:13:650930.
doi: 10.3389/fnagi.2021.650930. eCollection 2021.

Cadmium, an Environmental Contaminant, Exacerbates Alzheimer's Pathology in the Aged Mice's Brain

Affiliations

Cadmium, an Environmental Contaminant, Exacerbates Alzheimer's Pathology in the Aged Mice's Brain

Tahir Ali et al. Front Aging Neurosci. .

Abstract

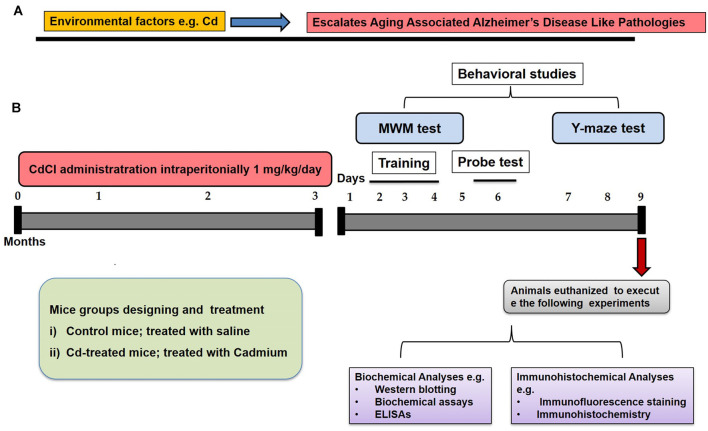
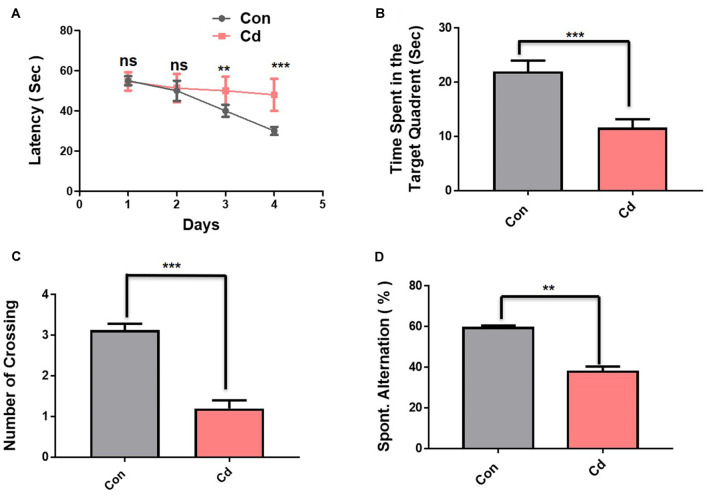
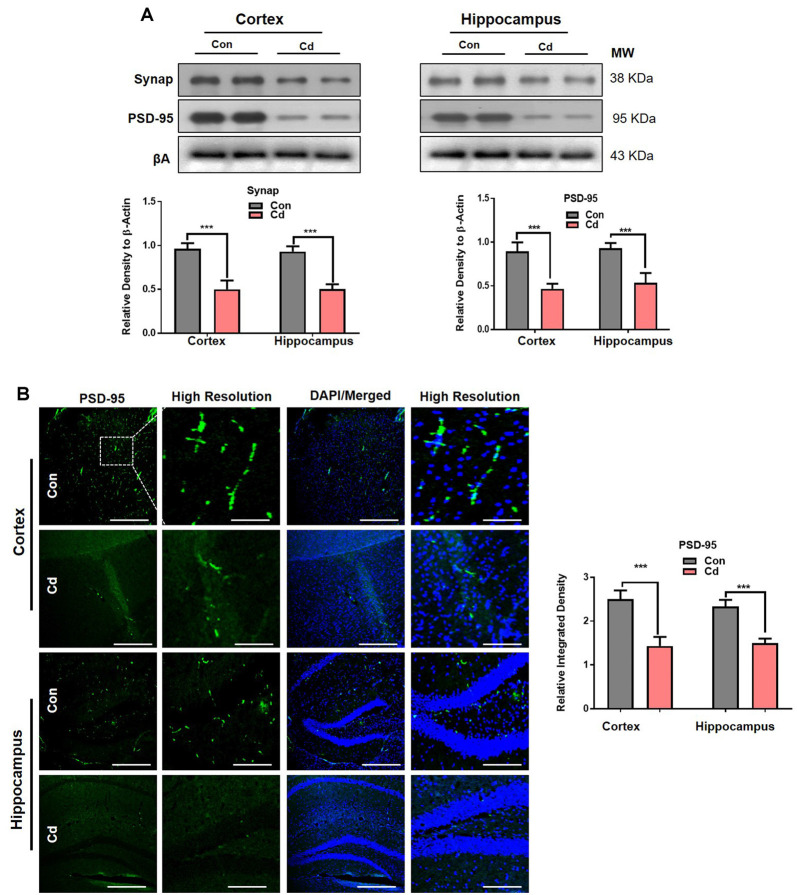
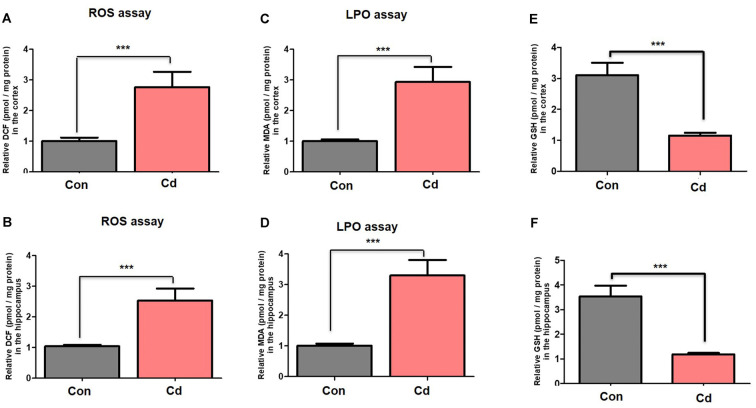
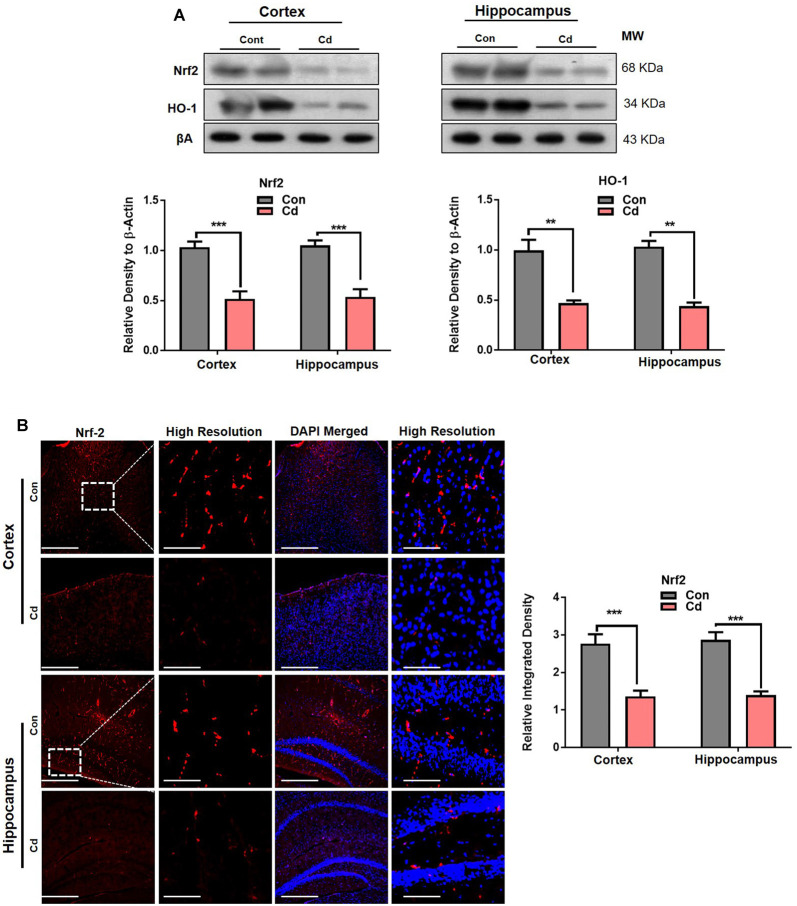
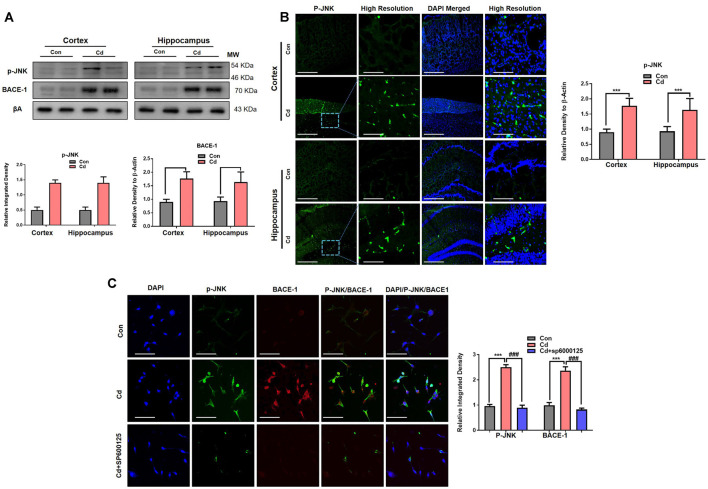
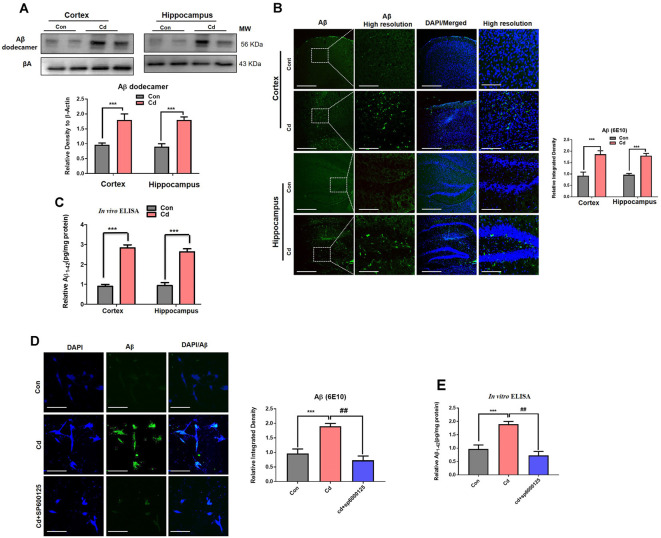
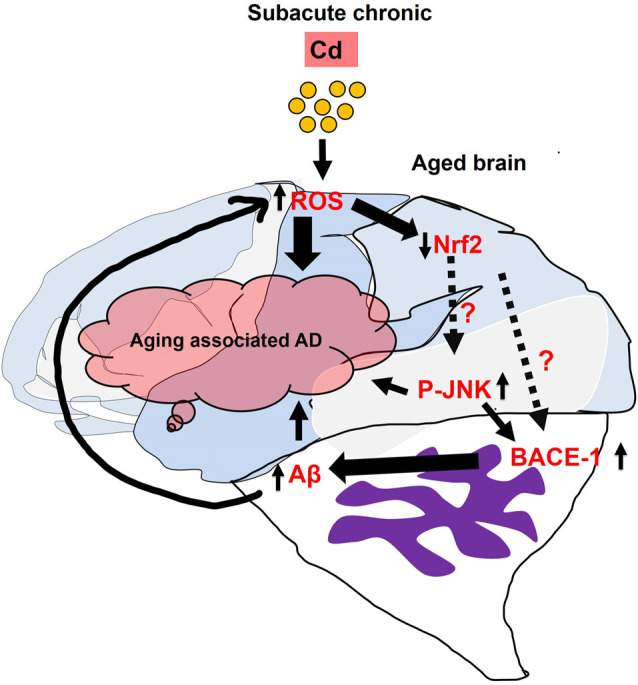
Cadmium (Cd) is an environmental contaminant, which is a potential risk factor in the progression of aging-associated neurodegenerative diseases. Herein, we have assessed the effects of chronic administration of Cd on cellular oxidative stress and its associated Alzheimer's disease (AD) pathologies in animal models. Two groups of mice were used, one group administered with saline and the other with Cd (1 mg/kg/day; intraperitoneally) for 3 months. After behavioral studies, molecular/biochemical (Immunoblotting, ELISAs, ROS, LPO, and GSH assays) and morphological analyses were performed. We observed an exacerbation of memory and synaptic deficits in chronic Cd-injected mice. Subacute and chronic Cd escalated reactive oxygen species (ROS), suppressed the master antioxidant enzymes, e.g., nuclear factor-erythroid 2-related factor 2 and heme oxygenase-1, and evoked the stress kinase phospho-c-Jun N-terminal kinase 1 signaling pathways, which may escalate AD pathologies possibly associated with amyloidogenic processes. These findings suggest the regulation of oxidative stress/ROS and its associated amyloid beta pathologies for targeting the Cd-exacerbated AD pathogenesis. In addition, these preclinical animal studies represent a paradigm for epidemiological studies of the human population exposed to chronic and subacute administration of Cd, suggesting avoiding environmental contaminants.

Keywords: Alzheimer’s disease; Cadmium; antioxidant genes Nrf-2/HO-1; neurodegeneration; reactive oxygen species.


Conflict of interest statement

The authors declare that the research was conducted in the absence of any commercial or financial relationships that could be construed as a potential conflict of interest.

Figures

Figure 1
Figure 1
Schematic diagram. (A) These schematic illustrations show our hypothesis for interaction and synergistic effects of an environmental factor (Cd) and aging. (B) The illustrative graphical representation indicated our study designing to establish the control of aging and Cd-induced aging models. The treatment paradigms, behavioral studies [Morris water maze (MWM) and Y-maze tests], animal authorization, and biochemical as well as immunohistochemical representation were indicated for the entire study.
Figure 2
Figure 2
Cd exposure accelerated memory impairment in mice. The behavioral studies were performed through MWM and the Y-maze test. The mice (12 mice per group) were used for the behavioral analysis. (A) The time it took [escape latency (sec)] to reach the submerged hidden platform during training. (B) The graphs represent the duration spent in the target quadrant (where the platform was located during the hidden platform training session) during the probe test. (C) The number of platform crossings during the probe test. (D) The graphs represent the % of spontaneous alternation behavior in the Y-maze test. The escape latencies in the behavioral tests were analyzed using a two-way ANOVA, with training days as the repeated measurements, while for other probe tests and Y-maze test, the Student’s unpaired t-test was used. The graphs express the means ± standard error of the mean (SEM; n = 12 mice/group). Significance = **p < 0.01, ***p < 0.001; ns = non-significant.
Figure 3
Figure 3
Cd exposure induced synaptic dysfunction in mice. (A) Western blot images against presynaptic (Synap) and postsynaptic (PSD-95) protein markers in the cortical and hippocampal regions of the brain and their respective histograms. β-Actin was used as a loading control. The histograms represented as the means ± SEM (n = 7 mice/group) for three independent repeated and reproducible experiments. Significance = ***p < 0.001; Student’s unpaired t-test. See Supplementary Figure 1 for uncropped and original blots. (B) Representative immunofluorescence images of PSD-95, respectively (green: FITC and blue: DAPI) in the cortical and hippocampal regions of the mouse brain. The histograms represented as the means ± SEM for n = 5 mice per group, and the number of independent experiments = 3. Magnification: 10×. Scale bar = 50 μm. Significance = ***p < 0.001; Student’s unpaired t-test.
Figure 4
Figure 4
Chronic Cd exposure escalated oxidative stress/ROS accumulation. (A,B) Histograms indicated results of ROS assay in the cortical and hippocampal regions of the mouse brain. The results were represented as the means ± SEM (number = 7 mice/group) for three repeated independent and reproducible experiments. Significance = ***p < 0.001; Student’s unpaired t-test. (C,D) Histograms indicated results of LPO assay and MDA analyses in the cortical and hippocampal regions of the mouse brain. The results were represented as the means ± SEM (number = 7 mice/group) for three repeated independent and reproducible experiments. Significance = ***p < 0.001. Student’s unpaired t-test. (E,F) Histograms indicated results of GSH assay in the cortical and hippocampal regions of the mouse brain. The results were represented as the means ± SEM (number = 7 mice/group) for three repeated independent and reproducible experiments. Significance = ***p < 0.001; Student’s unpaired t-test.
Figure 5
Figure 5
Cd exposure perturbed antioxidant Nrf2/HO-1 pathways. (A) The Western blot images against Nrf2 and HO-1 in the cortical and hippocampal regions of the brain and their respective histograms. β-Actin was used as a loading control. The histograms represented as the means ± SEM (n = 7 mice/group) for three repeated independent and reproducible experiments. Significance = **p < 0.01, ***p < 0.001; Student’s unpaired t-test. See Supplementary Figure 2 for uncropped and original blots. (B) Representative immunofluorescence images of Nrf2 (red: TRITC and blue: DAPI) in the cortical and hippocampal regions of the mouse brain. The histograms represented as the means ± SEM for n = 5 mice per group, and the number of independent experiments = 3. Magnification: 10×. Scale bar = 50 μm. Significance = ***p < 0.001.
Figure 6
Figure 6
Cd exposure increased the expression of p-JNK and BACE-1. (A) Western blot images against p-JNK and BACE-1 in the cortical and hippocampal regions of the brain and their respective histograms. β-Actin was used as a loading control. The histograms represented as the means ± SEM (n = 7 mice/group) for three repeated independent and reproducible experiments. Significance = ***p < 0.001; ###p < 0.001 Student’s unpaired t-test. See Supplementary Figure 3 for uncropped and original blots. (B) Representative immunofluorescence images of p-JNK (green: FITC and blue: DAPI) in the cortical and hippocampal regions of the mouse brain. The histograms represented as the means ± SEM for n = 5 mice per group, and the number of independent experiments = 3. Magnification: 10×. Scale bar = 50 μm. Significance = ***p < 0.001; ###p < 0.001. (C) The double immunofluorescence and co-localization of p-JNK (green: FITC and blue: DAPI) and BACE-1 (red: TRITC and blue: DAPI) in the hippocampal neuronal HT22 cells exposed to Cd (10 μM) and SP600125 (20 μM). The data are indicated as the ±SEM for n = 5 images per group, and the number of independent experiments = 3.
Figure 7
Figure 7
Cd exposure escalated the amyloidogenic pathway through activation of p-JNK. (A) Western blot images against Aβ oligomer in the cortical and hippocampal regions of the brain and their respective histograms. β-Actin was used as a loading control. The histograms represented as the means ± SEM (n = 7 mice/group) for three repeated and reproducible independent experiments. Significance = ***p < 0.001; Student’s unpaired t-test. See Supplementary Figure 4 for uncropped and original blots. (B) Representative immunofluorescence images of Aβ (green: FITC and blue: DAPI) in the cortical and hippocampal regions of the mouse brain. The histograms represented as the means ± SEM for n = 5 mice per group, and the number of independent experiments = 3. Magnification: 10×. Scale bar = 50 μm. Significance = ***p < 0.001; Student’s unpaired t-test. (C) The ELISA results for Aβ1–42 in the homogenates of the cortical and hippocampal regions of the brain. The histograms represented as the means ± SEM (n = 7 mice/group) for three repeated and reproducible independent experiments. Significance = ***p < 0.001; Student’s unpaired t-test. (D) The immunofluorescence images of Aβ (green: FITC and blue: DAPI) in the hippocampal neuronal HT22 cells exposed to Cd (10 μM) and SP600125 (20 μM). The data are indicated as the ±SEM for n = 5 images per group, and the number of independent experiments = 3. Significance = ***p < 0.001; ##p < 0.01; one way ANOVA followed by Tukey’s test. (E) The ELISA results for Aβ1–42 in the cell lysates of hippocampal neuronal HT22 cells exposed to Cd (10 μM) and SP600125 (20 μM). The data are indicated as the ± SEM for n = 5 per group, and the number of independent experiments = 3. Significance = ***p < 0.01; ##p < 0.01; one way ANOVA followed by Tukey’s test.
Figure 8
Figure 8
Represents the generalized overview and possible mechanistic approach of subacute Cd administration which induced Alzheimer’s disease (AD)-associated pathologies in the aged mice’s brain. Represented that direct correlation and mechanism between the Nrf2 and p-JNK as well as theirrelationship with BACE-1 should be determined comprehensively in in vitro and in vivo models.

References

    1. Agnihotri S. K., Agrawal U., Ghosh I. (2015). Brain most susceptible to cadmium induced oxidative stress in mice. J. Trace Elem. Med. Biol. 30, 184–193. 10.1016/j.jtemb.2014.12.008 - DOI - PubMed
    1. Ahmad A., Shah A. S., Badshah H., Kim M. J., Ali T., Yoon G. H., et al. (2016). Neuroprotection by vitamin C against ethanol-induced neuroinflammation associated neurodegeneration in the developing rat brain. CNS Neurol. Disord. Drug Targets 15, 360–370. 10.2174/1871527315666151110130139 - DOI - PubMed
    1. Ahmed S. M., Luo L., Namani A., Namani A., Wang X. J., Tang X., et al. (2017). Nrf2 signaling pathway: Pivotal roles in inflammation. Biochim. Biophys. Acta Mol. Basis Dis. 1863, 585–597. 10.1016/j.bbadis.2016.11.005 - DOI - PubMed
    1. Ali T., Rehman S. U., Shah F. A., Kim M. O. (2018). Acute dose of melatonin via Nrf2-dependently prevents acute ethanol-induced neurotoxicity in the developing rodent brain. J. Neuroinflammation 15:119. 10.1186/s12974-018-1157-x - DOI - PMC - PubMed
    1. Ali T., Rehman S. U., Khan A., Bashah H., Abid M. B., Kim M. W., et al. (2021). Adiponectin-mimetic novel nonapeptide rescues aberrant neuronal metabolic-associated memory deficits in Alzheimer’s disease. Mol. Neurodegener. 16:23. 10.1186/s13024-021-00445-4 - DOI - PMC - PubMed