

The Vagus Nerve and Spleen: Influence on White Adipose Mass and Histology of Obese and Non-obese Rats
- PMID: 34248663
- PMCID: PMC8269450
- DOI: 10.3389/fphys.2021.672027
The Vagus Nerve and Spleen: Influence on White Adipose Mass and Histology of Obese and Non-obese Rats
Abstract
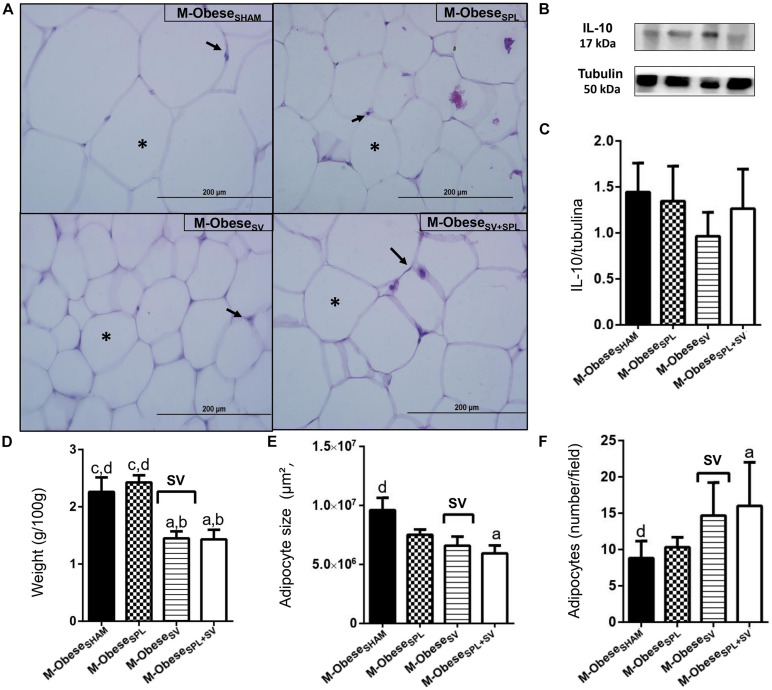
The vagus nerve (VN) and spleen represent a complex interface between neural and immunological functions, affecting both energy metabolism and white adipose tissue (WAT) content. Here, we evaluated whether vagal and splenic axis participates in WAT mass regulation in obese and non-obese male Wistar rats. High doses of monosodium glutamate (M; 4 g/Kg) were administered during the neonatal period to induce hypothalamic lesion and obesity (M-Obese rats). Non-obese or Control (CTL) rats received equimolar saline. At 60 days of life, M-Obese and CTL rats were randomly distributed into experimental subgroups according to the following surgical procedures: sham, subdiaphragmatic vagotomy (SV), splenectomy (SPL), and SV + SPL (n = 11 rats/group). At 150 days of life and after 12 h of fasting, rats were euthanized, blood was collected, and the plasma levels of glucose, triglycerides, cholesterol, insulin, and interleukin 10 (IL10) were analyzed. The visceral and subcutaneous WAT depots were excised, weighed, and histologically evaluated for number and size of adipocytes as well as IL10 protein expression. M-Obese rats showed higher adiposity, hyperinsulinemia, hypertriglyceridemia, and insulin resistance when compared with CTL groups (p < 0.05). In CTL and M-Obese rats, SV reduced body weight gain and triglycerides levels, diminishing adipocyte size without changes in IL10 expression in WAT (p< 0.05). The SV procedure resulted in high IL10 plasma levels in CTL rats, but not in the M-Obese group. The splenectomy prevented the SV anti-adiposity effects, as well as blocked the elevation of IL10 levels in plasma of CTL rats. In contrast, neither SV nor SPL surgeries modified the plasma levels of IL10 and IL10 protein expression in WAT from M-Obese rats. In conclusion, vagotomy promotes body weight and adiposity reduction, elevating IL10 plasma levels in non-obese animals, in a spleen-dependent manner. Under hypothalamic obesity conditions, VN ablation also reduces body weight gain and adiposity, improving insulin sensitivity without changes in IL10 protein expression in WAT or IL10 plasma levels, in a spleen-independent manner. Our findings indicate that the vagal-spleen axis influence the WAT mass in a health state, while this mechanism seems to be disturbed in hypothalamic obese animals.
Keywords: adipocyte; autonomic nervous system; hypothalamic obesity; splenectomy; vagotomy.
Copyright © 2021 Kuchler, Siqueira, Ceglarek, Chasko, Moura, Sczepanhak, Vettorazzi, Balbo and Grassiolli.
Conflict of interest statement
The authors declare that the research was conducted in the absence of any commercial or financial relationships that could be construed as a potential conflict of interest.
Figures


Similar articles
-
Vagal Splenic-Dependent Effects Influence Glucose Homeostasis, Insulin Secretion, and Histopathology of the Endocrine Pancreas in Hypothalamic Obese Male Rats: Vagus Nerve and Spleen Interactions Affect the Endocrine Pancreas.ScientificWorldJournal. 2025 Apr 17;2025:9910997. doi: 10.1155/tswj/9910997. eCollection 2025. ScientificWorldJournal. 2025. PMID: 40276696 Free PMC article.
-
Phenylhydrazine-induced anaemia reduces subcutaneous white and brown adipose tissues in hypothalamic obese rats.Exp Physiol. 2022 Jun;107(6):575-588. doi: 10.1113/EP089883. Epub 2022 May 6. Exp Physiol. 2022. PMID: 35396880
-
Splenic participation in glycemic homeostasis in obese and non-obese male rats.Obes Res Clin Pract. 2020 Sep-Oct;14(5):479-486. doi: 10.1016/j.orcp.2020.07.009. Epub 2020 Aug 29. Obes Res Clin Pract. 2020. PMID: 32868251
-
Interleukin-1 beta: a potential link between stress and the development of visceral obesity.BMC Physiol. 2012 Jun 27;12:8. doi: 10.1186/1472-6793-12-8. BMC Physiol. 2012. PMID: 22738239 Free PMC article. Review.
-
Energy fuel and hormonal profile in experimental obesities.Experientia Suppl. 1983;44:57-76. doi: 10.1007/978-3-0348-6540-1_5. Experientia Suppl. 1983. PMID: 6357849 Review.
Cited by
-
Ferroptosis increases obesity: Crosstalk between adipocytes and the neuroimmune system.Front Immunol. 2022 Nov 21;13:1049936. doi: 10.3389/fimmu.2022.1049936. eCollection 2022. Front Immunol. 2022. PMID: 36479119 Free PMC article. Review.
-
Vagal Splenic-Dependent Effects Influence Glucose Homeostasis, Insulin Secretion, and Histopathology of the Endocrine Pancreas in Hypothalamic Obese Male Rats: Vagus Nerve and Spleen Interactions Affect the Endocrine Pancreas.ScientificWorldJournal. 2025 Apr 17;2025:9910997. doi: 10.1155/tswj/9910997. eCollection 2025. ScientificWorldJournal. 2025. PMID: 40276696 Free PMC article.
References
-
- Almeida V. L., Santana I. T. S., Fontes G. S., Lima I. F. P., Matos A. L. P., Matos F. R., et al. (2019). Influence of interleukins on the prognosis of patients with intraoral squamous cell carcinoma. J. Bras. Patol. Med. Lab. 55 559–567. 10.5935/1676-2444.20190051 - DOI
LinkOut - more resources
Full Text Sources