GLUT4 in Mouse Endometrial Epithelium: Roles in Embryonic Development and Implantation
- PMID: 34248664
- PMCID: PMC8267529
- DOI: 10.3389/fphys.2021.674924
GLUT4 in Mouse Endometrial Epithelium: Roles in Embryonic Development and Implantation
Abstract
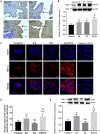
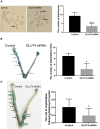
GLUT4 is involved in rapid glucose uptake among various kinds of cells to contribute to glucose homeostasis. Prior data have reported that aberrant glucose metabolism by GLUT4 dysfunction in the uterus could be responsible for infertility and increased miscarriage. However, the expression and precise functions of GLUT4 in the endometrium under physiological conditions remain unknown or controversial. In this study, we observed that GLUT4 exhibits a spatiotemporal expression in mouse uterus on pregnant days 1-4; its expression especially increased on pregnant day 4 during the window of implantation. We also determined that estrogen, in conjunction with progesterone, promotes the expression of GLUT4 in the endometrial epithelium in vivo or in vitro. GLUT4 is an important transporter that mediates glucose transport in endometrial epithelial cells (EECs) in vitro or in vivo. In vitro, glucose uptake decreased in mouse EECs when the cells were treated with GLUT4 small interfering RNA (siRNA). In vivo, the injection of GLUT4-siRNA into one side of the mouse uterine horns resulted in an increased glucose concentration in the uterine fluid on pregnant day 4, although it was still lower than in blood, and impaired endometrial receptivity by inhibiting pinopode formation and the expressions of leukemia inhibitory factor (LIF) and integrin ανβ3, finally affecting embryonic development and implantation. Overall, the obtained results indicate that GLUT4 in the endometrial epithelium affects embryo development by altering glucose concentration in the uterine fluid. It can also affect implantation by impairing endometrial receptivity due to dysfunction of GLUT4.
Keywords: embryonic development; endometrial epithelium; glucose transporter 4; implantation; uterine receptivity.
Copyright © 2021 Long, Wang, Yuan, Dai, Liao, Zhang, Zhang, Ma, Lei, Cui, Zhang, Nie and Yue.
Conflict of interest statement
The authors declare that the research was conducted in the absence of any commercial or financial relationships that could be construed as a potential conflict of interest.
Figures


Similar articles
-
Expression of SGLT1 in the Mouse Endometrial Epithelium and its Role in Early Embryonic Development and Implantation.Reprod Sci. 2021 Nov;28(11):3094-3108. doi: 10.1007/s43032-021-00480-y. Epub 2021 Aug 30. Reprod Sci. 2021. PMID: 34460091
-
Progesterone-induced miR-152 interferes with embryonic implantation by downregulating GLUT3 in endometrial epithelium.Am J Physiol Endocrinol Metab. 2019 Apr 1;316(4):E557-E567. doi: 10.1152/ajpendo.00245.2018. Epub 2019 Jan 22. Am J Physiol Endocrinol Metab. 2019. PMID: 30668148
-
Administration of calcitonin promotes blastocyst implantation in mice by up-regulating integrin β3 expression in endometrial epithelial cells.Hum Reprod. 2012 Dec;27(12):3540-51. doi: 10.1093/humrep/des330. Epub 2012 Sep 20. Hum Reprod. 2012. PMID: 23001774
-
Implantation in the baboon: endometrial responses.Semin Reprod Endocrinol. 1999;17(3):257-65. doi: 10.1055/s-2007-1016233. Semin Reprod Endocrinol. 1999. PMID: 10797944 Review.
-
Endometrial Glucose Transporters in Health and Disease.Front Cell Dev Biol. 2021 Sep 6;9:703671. doi: 10.3389/fcell.2021.703671. eCollection 2021. Front Cell Dev Biol. 2021. PMID: 34552924 Free PMC article. Review.
Cited by
-
Methimazole-Induced Hypothyroidism Increases the Content of Glycogen and Changes the Expression of LDH, GLUT4, and Aromatase in the Pregnant Uterus of Rabbits.Metabolites. 2025 Jan 30;15(2):82. doi: 10.3390/metabo15020082. Metabolites. 2025. PMID: 39997707 Free PMC article.
-
The Treatment of Complementary and Alternative Medicine on Female Infertility Caused by Endometrial Factors.Evid Based Complement Alternat Med. 2022 Sep 7;2022:4624311. doi: 10.1155/2022/4624311. eCollection 2022. Evid Based Complement Alternat Med. 2022. PMID: 36118081 Free PMC article. Review.
-
Membrane progesterone receptors mediate progesterone-stimulated glycogenolysis in the bovine uterine epithelium.Reproduction. 2024 Oct 18;168(6):e240174. doi: 10.1530/REP-24-0174. Print 2024 Dec 1. Reproduction. 2024. PMID: 39226129 Free PMC article.
-
Involvement of glucose transporter 4 in ovarian development and reproductive maturation of Harmonia axyridis (Coleoptera: Coccinellidae).Insect Sci. 2022 Jun;29(3):691-703. doi: 10.1111/1744-7917.12972. Epub 2021 Oct 29. Insect Sci. 2022. PMID: 34516727 Free PMC article.
-
Estrogen-sensitive activation of SGK1 induces M2 macrophages with anti-inflammatory properties and a Th2 response at the maternal-fetal interface.Reprod Biol Endocrinol. 2023 May 24;21(1):50. doi: 10.1186/s12958-023-01102-9. Reprod Biol Endocrinol. 2023. PMID: 37226177 Free PMC article.
References
-
- Augustin R. (2010). The protein family of glucose transport facilitators: it’s not only about glucose after all. IUBMB Life 62 315–333. - PubMed
-
- Azkargorta M., Escobes I., Iloro I., Osinalde N., Corral B., Ibañez-Perez J., et al. (2018). Differential proteomic analysis of endometrial fluid suggests increased inflammation and impaired glucose metabolism in non-implantative IVF cycles and pinpoints PYGB as a putative implantation marker. Hum. Reprod. (Oxford, England) 33 1898–1906. 10.1093/humrep/dey274 - DOI - PubMed
-
- Baack M. L., Wang C., Hu S., Segar J. L., Norris A. W. (2014). Hyperglycemia induces embryopathy, even in the absence of systemic maternal diabetes: an in vivo test of the fuel mediated teratogenesis hypothesis. Reprod. Toxicol. (Elmsford, N.Y.) 46 129–136. 10.1016/j.reprotox.2014.03.013 - DOI - PMC - PubMed
LinkOut - more resources
Full Text Sources
Other Literature Sources

