. 2021 Jun 25:12:705511.
doi: 10.3389/fimmu.2021.705511. eCollection 2021.

Screening and Validation of the Hypoxia-Related Signature of Evaluating Tumor Immune Microenvironment and Predicting Prognosis in Gastric Cancer

Affiliations

Screening and Validation of the Hypoxia-Related Signature of Evaluating Tumor Immune Microenvironment and Predicting Prognosis in Gastric Cancer

Jun-Peng Pei et al. Front Immunol. .

Abstract

Background: Hypoxia is one driving factor of gastric cancer. It causes a series of immunosuppressive processes and malignant cell responses, leading to a poor prognosis. It is clinically important to identify the molecular markers related to hypoxia.

Methods: We screened the prognostic markers related to hypoxia in The Cancer Genome Atlas database, and a risk score model was developed based on these markers. The relationships between the risk score and tumor immune microenvironment were investigated. An independent validation cohort from Gene Expression Omnibus was applied to validate the results. A nomogram of risk score model and clinicopathological factor was developed to individually predict the prognosis.

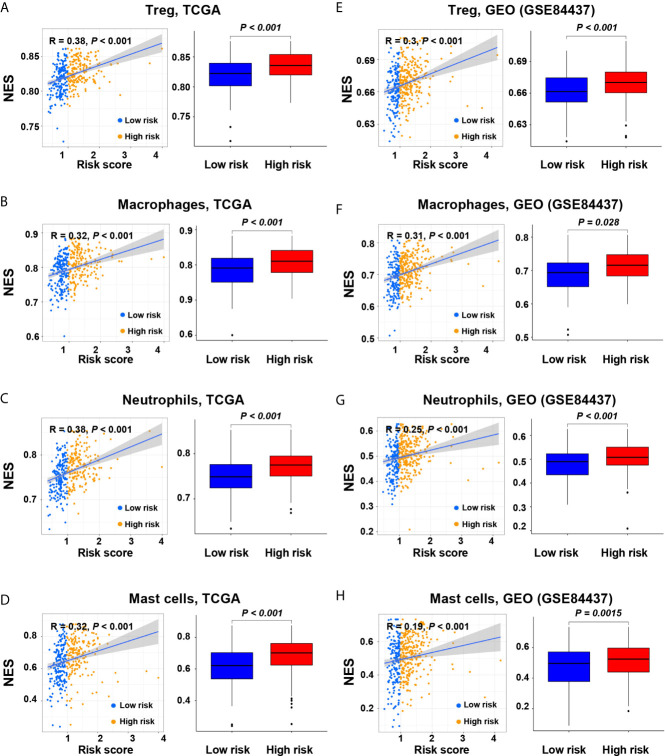
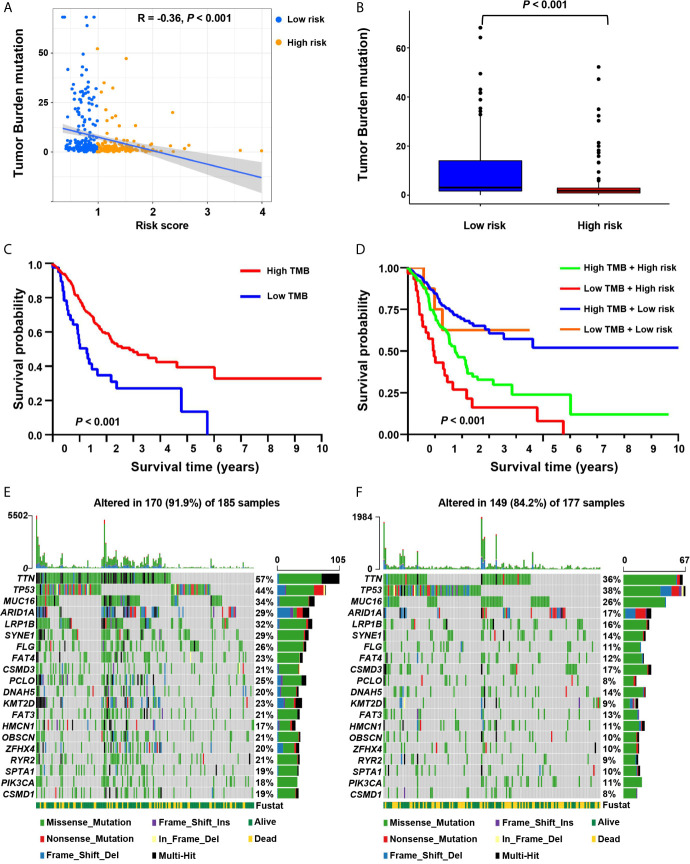
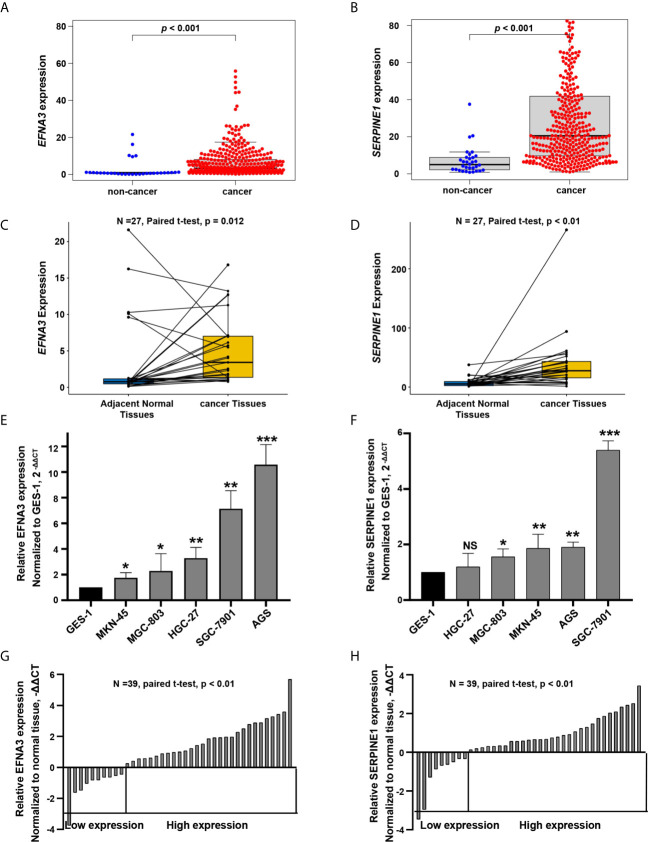
Results: We developed a hypoxia risk score model based on SERPINE1 and EFNA3. Quantified real-time PCR was further applied to verified gene expressions of SERPINE1 and EFNA3 in gastric cancer patients and cell lines. A high-risk score is associated with a poor prognosis through the immunosuppressive microenvironment and immune escape mechanisms, including infiltration of immunosuppressive cells, expression of immune checkpoint molecules, and enrichment of signal pathways related to cancer and immunosuppression. The nomogram basing on the hypoxia-related risk score model showed a good ability to predict prognosis and high clinical net benefits.

Conclusions: The hypoxia risk score model revealed a close relationship between hypoxia and tumor immune microenvironment. The current study potentially provides new insights of how hypoxia affects the prognosis, and may provide a new therapeutic target for patients with gastric cancer.

Keywords: gastric cancer; hypoxia; nomogram; prognosis; tumor immune microenvironment.


Conflict of interest statement

The authors declare that the research was conducted in the absence of any commercial or financial relationships that could be construed as a potential conflict of interest.

Figures

Figure 1
Figure 1
Identification of the hypoxia risk signature. (A) The Venn diagram shows the hypoxia-related genes in TCGA. (B) The Volcano plot for differentially expressed genes (DEGs) in cancer and non-cancer tissues. (C) The heatmap plot for DEGs in cancer and non-cancer tissues. (D) The PPI network visualizes the interaction between these DEGs. (E, F) The LASSO method identified five genes associated with prognosis. (G) The Cox proportional hazards analysis identified the hypoxia risk signature.
Figure 2
Figure 2
Prognostic value of the hypoxia risk signature in gastric cancer. (A, E) Heatmaps of the prognostic signature in the screening (TCGA) and validation (GEO) cohorts. (B, F) Patient risk score in the screening and validation cohorts. (C, G) The status distribution of patients in the high-risk and low-risk groups in the screening and validation cohort. (D, H) Kaplan-Meier analysis of patients in the high-risk and low-risk groups in the screening and validation cohorts.
Figure 3
Figure 3
Enrichment of pathways related to hypoxia and analysis of tumor immune microenvironment. (A, B) The enrichment plots show the signaling pathways related to hypoxia in the screening and validation cohorts. (C, D) The heatmaps show 29 immune-related gene sets, immune score, stromal score, ESTIMATE score and tumor purity in the screening and validation cohorts. (E, F) The relationship between risk score and immune score, stromal score, ESTIMATE score, and tumor purity in the screening and validation cohorts.
Figure 4
Figure 4
Correlation of the risk score with immune cell subtypes in the screening and validation cohorts. (A, E) Regulatory T cells; (B, F) Macrophages; (C, G) Neutrophils; (D, H) Mast cells.
Figure 5
Figure 5
Relationships between hypoxia risk score and immune checkpoint molecules. (A, G) Heatmaps show the expression level of immune checkpoint molecules in high-risk and low-risk groups in the screening and validation cohorts (*P < 0.05; **P < 0.01; ***P < 0.001). Scatter plots and box plots show the relationship between the risk score and the expression level of (B, H) PD-1, (C, I) HAVCR2, (D, J) TGF-β, (E, K) PD-L1, and (F, L) CTLA4 in the screening and validation cohorts.
Figure 6
Figure 6
The correlation between the risk score and somatic variants. (A) The scatter plot depicts the negative correlation between risk score and tumor mutation burden (TMB) in the screening cohort. (B) TMB difference in the high-risk and low-risk groups. (C) Kaplan-Meier curves for high-risk and low-TMB groups of the screening cohort. (D) Kaplan-Meier curves for patients in the screening cohort stratified by both risk score and TMB. (E, F) Waterfall plots display the frequently mutated genes in low-risk and high-risk groups in the screening cohort. The left panel shows the genes ordered by their mutation frequencies. The right panel presents different mutation types.
Figure 7
Figure 7
The correlation between low-risk and high-risk groups and chemotherapeutics. Sensitivity to chemotherapeutic drugs is expressed by the half inhibitory centration (IC50) of chemotherapeutic drugs. (A) Axitinib; (B) Bexarotene; (C) Bortezomib; (D) Bryostatin.1; (E) Dasatinib; (F) Imatinib; (G) Midostaurin; (H) Nilotinib; (I) Pazopanib; (J) Rapamycin; (K) Sunitinib; (L) Temsirolimus; (M) Vinblastine; (N) Methotrexate; (O) Mitomycin.C.
Figure 8
Figure 8
Construction of nomograms. (A) Univariate analysis included risk score, age, gender, grade, M stage, T stage and N stage in the screening cohort. (B) Cox proportional hazards analysis included age, M stage, T stage and N stage in the screening cohort. (C) Cox proportional hazards analysis included risk score, age, M stage, T stage and N stage in the screening cohort. (D) Nomogram 1 based on the clinicopathological characteristics. (E) Nomogram 2 based on the risk score and clinicopathological characteristics.
Figure 9
Figure 9
The areas under the curve (AUC), calibration curve and decision curve analysis (DCA) for predicting patient survival. (A, D) The AUCs assess the accuracy of the nomograms in the screening and validation cohorts. (B, E) The calibration curves assess the consistency of the nomograms in the screening and validation cohorts. (C, F) DCAs assess the clinical usefulness of nomograms in the screening and validation cohorts.
Figure 10
Figure 10
EFNA3 and SERPINE1 are upregulated in gastric cancer cell lines and tissues. (A, B) Bioinformatics analysis of the expression of EFNA3 and SERPINE1 in cancer and non-cancerous tissues in TCGA. (C, D) Bioinformatics analysis of the expression of EFNA3 and SERPINE1 in 27 pairs of gastric cancer and adjacent non-cancerous tissues in TCGA. (E, F) qRT-PCR results of EFNA3 and SERPINE1 expression level in GES-1 and gastric cancer cell lines. (Data are presented as mean ± SD. NS: P ≥ 0.05, *P < 0.05, **P < 0.01, ***P < 0.001). (G, H) qRT-PCR results of EFNA3 and SERPINE1 expression level in 39 pairs of gastric cancer and adjacent non-cancerous tissues. (Data are shown as –ΔΔCT values).

References

    1. Sung H, Ferlay J L, Siegel R, Laversanne M, Soerjomataram I, Jemal A, et al. . Global Cancer Statistics 2020: GLOBOCAN Estimates of Incidence and Mortality Worldwide for 36 Cancers in 185 Countries. CA: Cancer J Clin (2021) 71(3):209–49. 10.3322/caac.21660 - DOI - PubMed
    1. Egner JR. AJCC Cancer Staging Manual. JAMA J Am Med Assoc (2010) 304(15):1726–7. 10.1001/jama.2010.1525 - DOI
    1. Ajani JA, D’Amico TA, Almhanna K, Bentrem DJ, Chao J, Das P, et al. . Gastric Cancer, Version 3.2016, NCCN Clinical Practice Guidelines in Oncology. J Natl Compr Cancer Netw JNCCN (2016) 14(10):1286. 10.6004/jnccn.2016.0137 - DOI - PubMed
    1. Shah MA, Ajani JA. Gastric Cancer—An Enigmatic and Heterogeneous Disease. JAMA J Am Med Assoc (2010) 303(17):1753–4. 10.1001/jama.2010.553 - DOI - PubMed
    1. Noh SH, Park SR, Yang HK, Chung HC, Chung IJ, Kim SW, et al. . Adjuvant Capecitabine Plus Oxaliplatin for Gastric Cancer After D2 Gastrectomy (CLASSIC): 5-Year Follow-Up of an Open-Label, Randomised Phase 3 Trial. Lancet Oncol (2014) 15(12):1389–96. 10.1016/S1470-2045(14)70473-5 - DOI - PubMed

Publication types

MeSH terms

Substances

LinkOut - more resources