. 2021 Jun 23:12:689406.
doi: 10.3389/fgene.2021.689406. eCollection 2021.

Reference Transcriptomes of Porcine Peripheral Immune Cells Created Through Bulk and Single-Cell RNA Sequencing

Affiliations

Reference Transcriptomes of Porcine Peripheral Immune Cells Created Through Bulk and Single-Cell RNA Sequencing

Juber Herrera-Uribe et al. Front Genet. .

Abstract

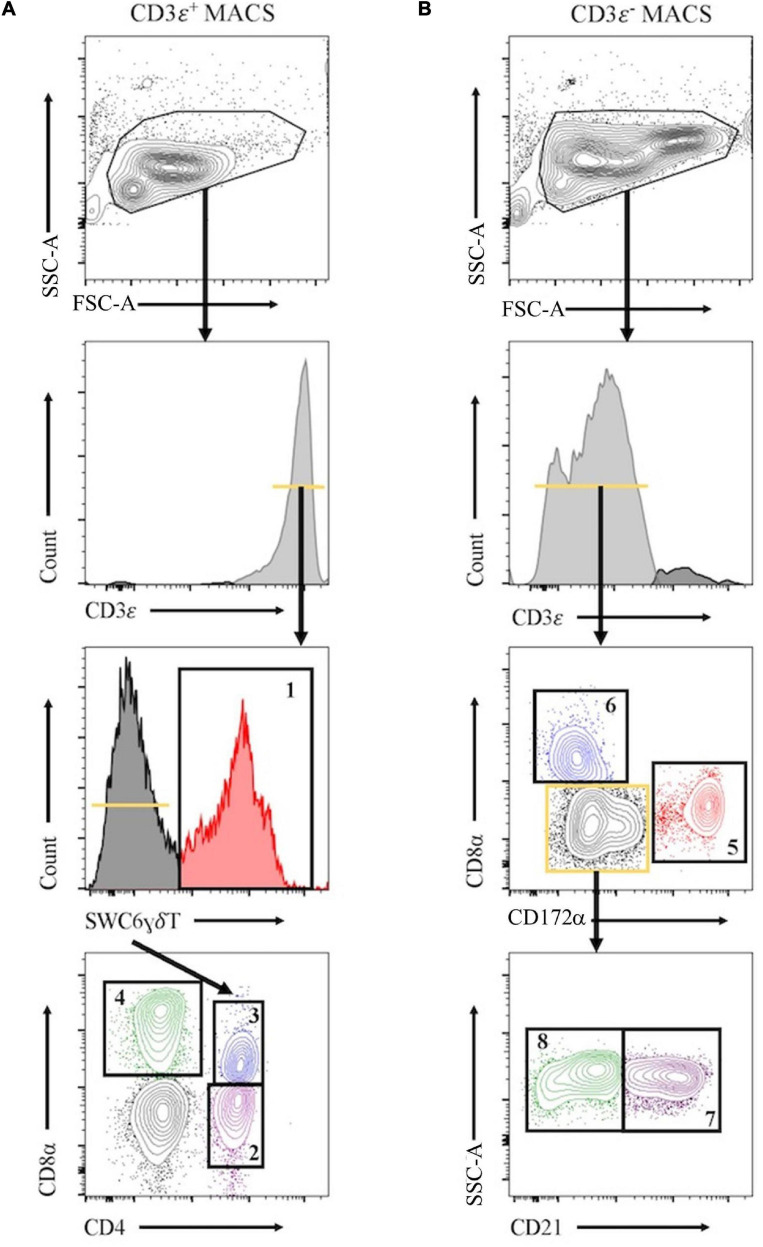
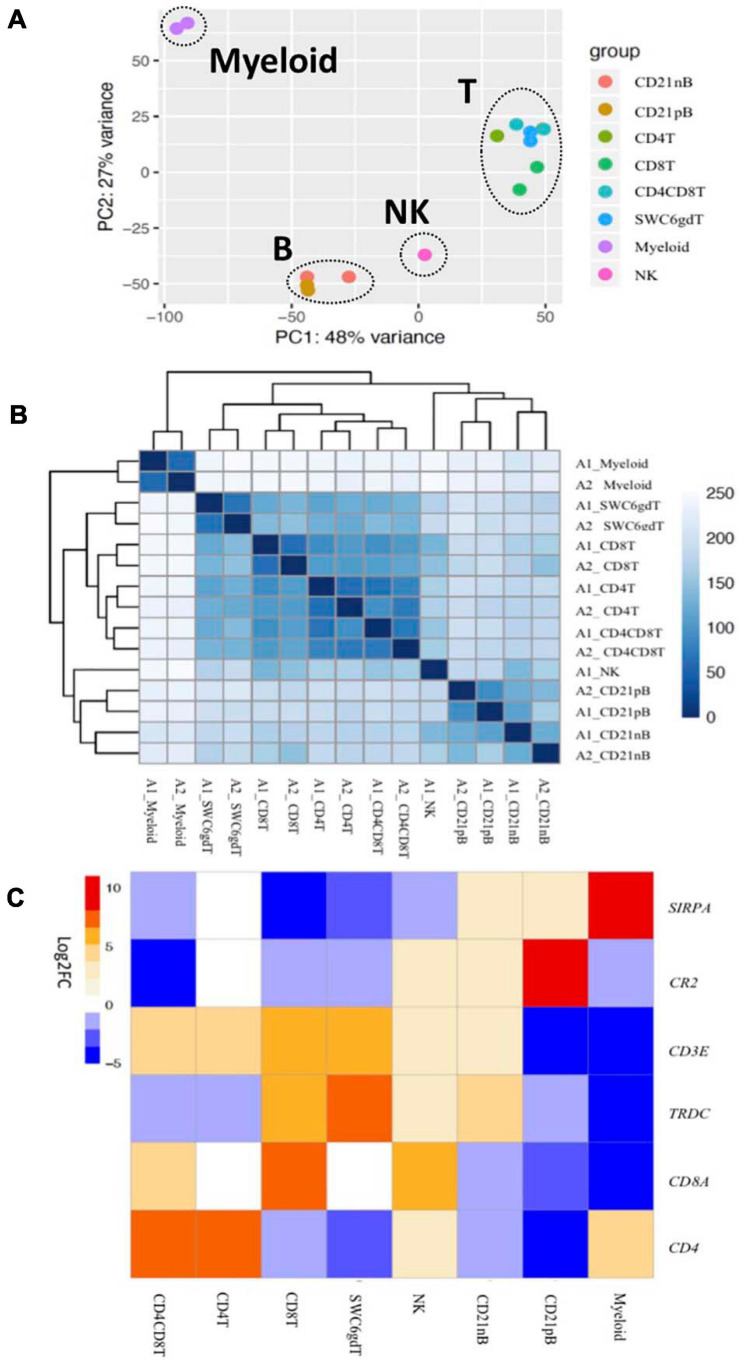
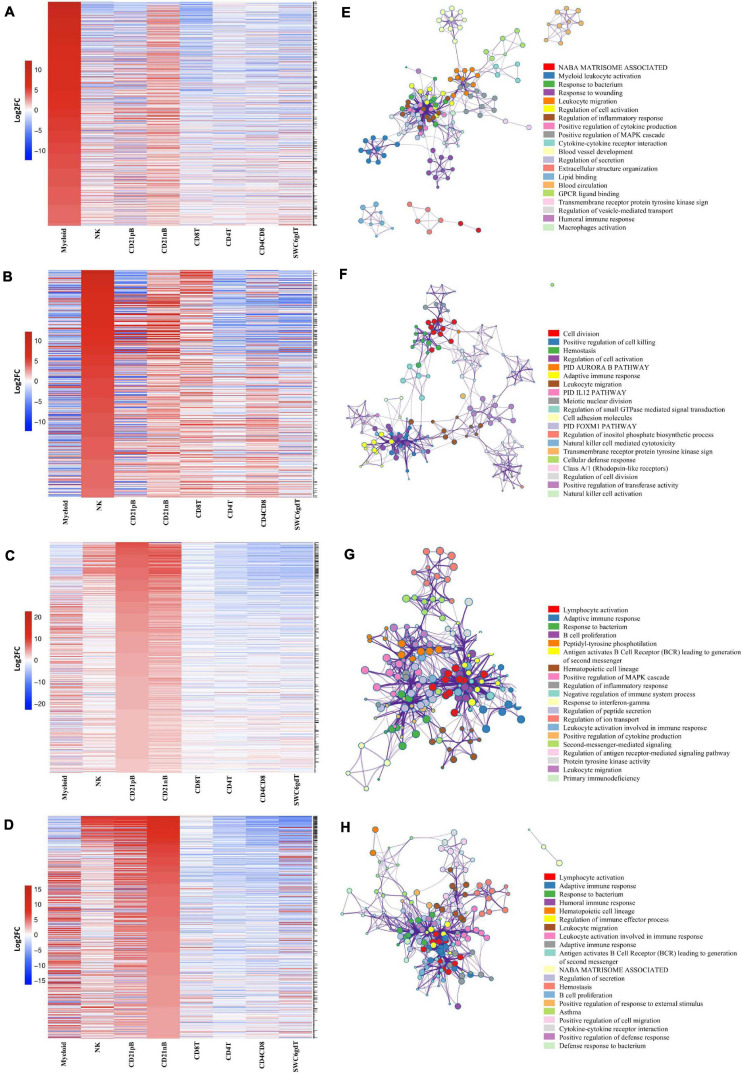
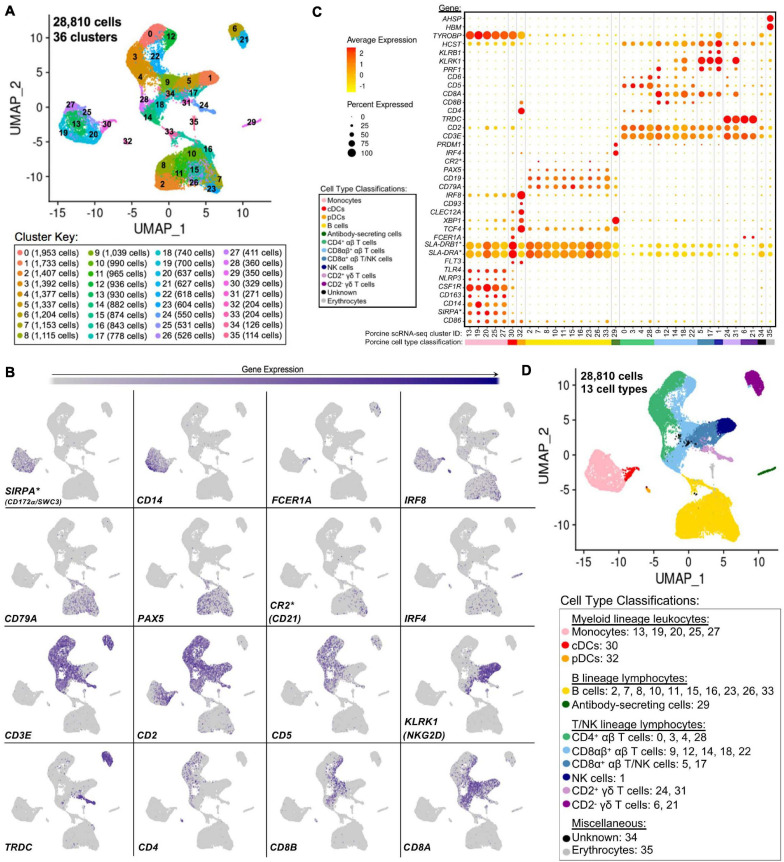
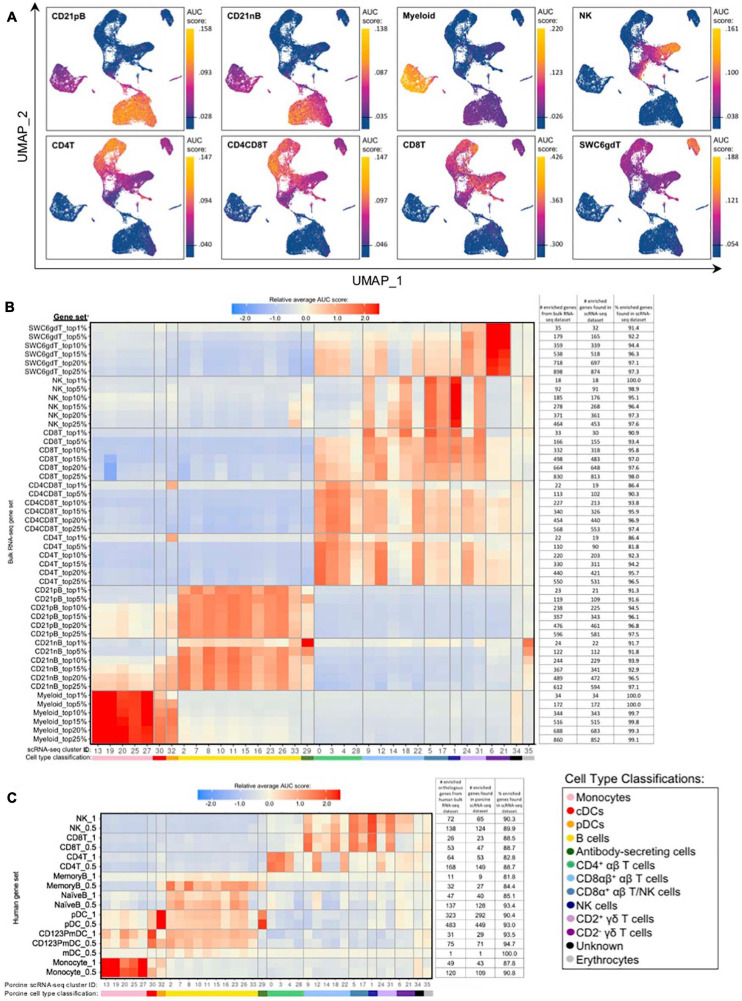
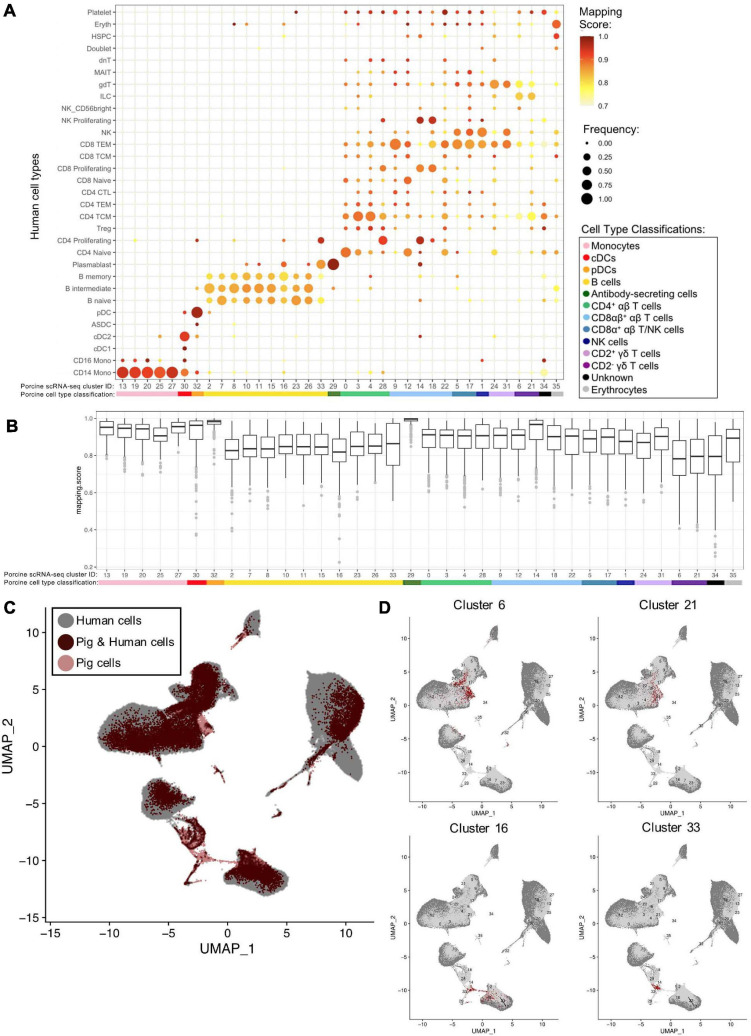
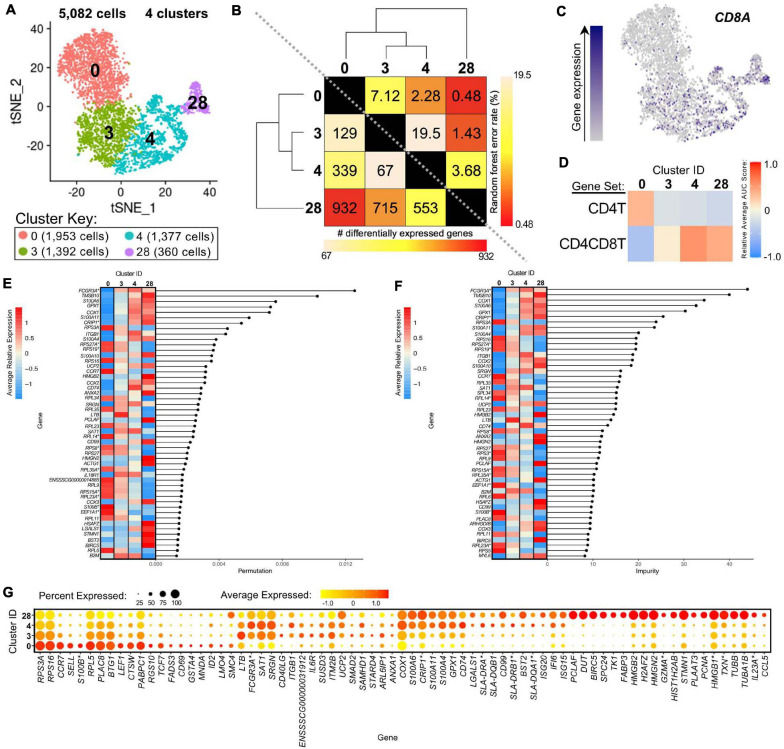
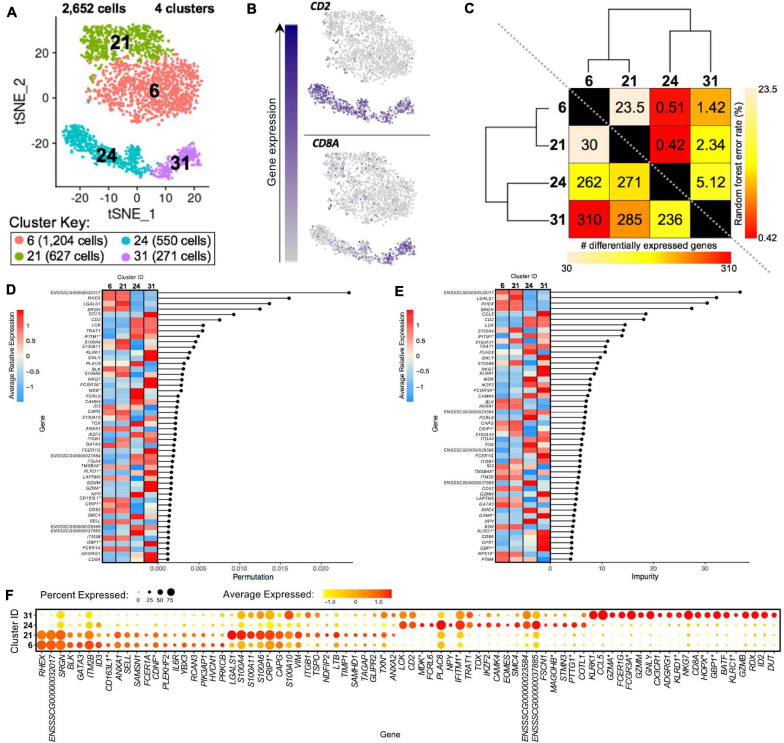
Pigs are a valuable human biomedical model and an important protein source supporting global food security. The transcriptomes of peripheral blood immune cells in pigs were defined at the bulk cell-type and single cell levels. First, eight cell types were isolated in bulk from peripheral blood mononuclear cells (PBMCs) by cell sorting, representing Myeloid, NK cells and specific populations of T and B-cells. Transcriptomes for each bulk population of cells were generated by RNA-seq with 10,974 expressed genes detected. Pairwise comparisons between cell types revealed specific expression, while enrichment analysis identified 1,885 to 3,591 significantly enriched genes across all 8 cell types. Gene Ontology analysis for the top 25% of significantly enriched genes (SEG) showed high enrichment of biological processes related to the nature of each cell type. Comparison of gene expression indicated highly significant correlations between pig cells and corresponding human PBMC bulk RNA-seq data available in Haemopedia. Second, higher resolution of distinct cell populations was obtained by single-cell RNA-sequencing (scRNA-seq) of PBMC. Seven PBMC samples were partitioned and sequenced that produced 28,810 single cell transcriptomes distributed across 36 clusters and classified into 13 general cell types including plasmacytoid dendritic cells (DC), conventional DCs, monocytes, B-cell, conventional CD4 and CD8 αβ T-cells, NK cells, and γδ T-cells. Signature gene sets from the human Haemopedia data were assessed for relative enrichment in genes expressed in pig cells and integration of pig scRNA-seq with a public human scRNA-seq dataset provided further validation for similarity between human and pig data. The sorted porcine bulk RNAseq dataset informed classification of scRNA-seq PBMC populations; specifically, an integration of the datasets showed that the pig bulk RNAseq data helped define the CD4CD8 double-positive T-cell populations in the scRNA-seq data. Overall, the data provides deep and well-validated transcriptomic data from sorted PBMC populations and the first single-cell transcriptomic data for porcine PBMCs. This resource will be invaluable for annotation of pig genes controlling immunogenetic traits as part of the porcine Functional Annotation of Animal Genomes (FAANG) project, as well as further study of, and development of new reagents for, porcine immunology.

Keywords: FAANG; bulkRNA-seq; immune cells; pig; single-cell RNA-seq; transcriptome.


Conflict of interest statement

The authors declare that the research was conducted in the absence of any commercial or financial relationships that could be construed as a potential conflict of interest.

Figures

FIGURE 1
FIGURE 1
Representative plots for fluorescence-activated cell sorting (FACS) isolation of 8 leukocyte populations from pig peripheral blood mononuclear cells (PBMCs). Porcine PBMCs were first subjected to magnetic-activated cell sorting (MACS) to enrich for CD3ε + and CD3ε– fractions. (A) Cells in CD3ε+ MACS fraction were FACS gated on FSC vs. SSC, doublets removed (not shown), and CD3ε+ cells were isolated into 4 population: SWC6+ γδ T-cells (gate 1), and the SWC6 cells sorted as CD4+CD8α (gate 2), CD4+CD8α+ (gate 3), CD4CD8α+ (gate 4) T-cells. (B) Cells in CD3ε MACS fraction were FACS gated on FSC vs. SSC, doublets removed (not shown), and CD3ε cells were isolated into 4 populations: CD172α+ myeloid lineage leukocytes (gate 5), CD8α+CD172 NK cells (gate 6), and the remaining CD8α CD172α, cells were isolated as CD21+ (gate 7) and CD21 (gate 8) B-cells. Table 1 outlines abbreviations and sort criteria for each population.
FIGURE 2
FIGURE 2
Transcriptional expression patterns of immune cells are distinct and cluster more by progenitors. (A) Principal component analysis of transformed RNA-seq reads counts for whole transcriptomes. Axis indicate component scores. (B) Heat map depicting hierarchical clustering of sample-to-sample distance. Gene expression for whole transcriptomes were used to calculate sample to sample Euclidean distance (color scale) for hierarchical clustering. (C) Heatmap showing cell-type enriched gene values (Log2FC) between sorted immune cells. Gene coding proteins that were used for cell sorting were display.
FIGURE 3
FIGURE 3
Top 25% highly enriched genes in CD3 sorted cells. Heatmap showing in decreasing order the top 25% of highly enriched genes in (A) myeloid, (B) NK, (C) CD21pB, and (D) CD21nB-cells. Ontology enrichment clusters of the top 25% highly enriched genes of (E) myeloid, (F) NK, (G) CD21pB, and (H) CD21nB cells. The most statistically significant term within similar term cluster was chosen to represent the cluster. Term color is given by cluster ID and the size of the terms is given by –log10 p-value. The stronger the similarity among terms, the thicker the edges between them.
FIGURE 4
FIGURE 4
Classification of porcine PBMC scRNA-seq clusters based on known cell type-specific gene expression. (A) Two-dimensional UMAP visualization of 28,810 single cells from porcine PBMCs classified into 36 designated clusters. Each point represents a single cell. Color of the point corresponds to transcriptional cluster a cell belongs to. Cells more transcriptionally similar to each other belong to the same cluster. (B) Visualization of selected cell type-specific gene expression overlaid onto two-dimensional UMAP coordinates of single cells. Each point represents a single cell. Color of the point corresponds to relative expression of a specified gene (bottom left of each UMAP plot) within a cell. Gray corresponds to little/no gene expression, while navy corresponds to increased gene expression. (C) Dot Plot visualization of selected cell type-specific gene expression for each single-cell cluster shown in A. Clusters are listed on the x-axis, while selected genes are listed on the y-axis. The size of a dot corresponds to the percent of cells in a cluster that expressed the gene. The color of a dot corresponds to the average relative expression level for the gene in the cells expressing the gene within a cluster. Color bar below the x-axis corresponds to porcine cell type each cluster was classified as. (D) Two-dimensional UMAP visualization of single cells from porcine PBMCs classified into major porcine cell types. Each point represents a single cell. Color of the cell corresponds to porcine cell type the respective cluster was designated as based on gene expression patterns for the cluster it belonged to in (C). Seven PBMC samples used for scRNA-seq analysis were derived from each of three separate experiments (experiment B, n = 2; experiment C, n = 3; experiment D, n = 2). Between 3,042 and 6,518 cells were derived from each PBMC sample. *Refer to ‘Gene name replacement’ methods.
FIGURE 5
FIGURE 5
Enrichment of gene signatures from bulkRNA-seq in porcine single-cell clusters. (A) Gene set enrichment scores calculated by AUCell analysis of enriched gene sets from the top 25% of SEGs in pig bulkRNA-seq sorted populations overlaid onto cells of the porcine scRNA-seq dataset visualized in two-dimensional UMAP plot. Each point represents a single cell. The color of the point corresponds to the AUC score calculated for each respective cell. Higher AUC scores correspond to a greater percentage of cells from a gene set being detected in the top 5% of expressed genes in a cell. A threshold for AUC score detection within each gene set was set as shown in Supplementary Figure 10A and is indicated by a horizontal line on the gradient fill scale for each plot. (B) Relative average gene set enrichment scores of scRNA-seq clusters calculated by AUCell analysis of enriched gene sets from porcine bulkRNA-seq sorted data. Scores are relative to other cells within a single gene set comparison (across a row of the heatmap) and are not calculated relative to scores across different gene sets (across columns in the heatmap). Gene sets were created from the top 1, 5, 10, 15, 20, or 25% of SEGs from sorted populations, as determined by highest log2FC values in the porcine bulkRNA-seq data. The number of genes included from the bulkRNA-seq dataset and the number and percent of genes detected in the scRNA-seq dataset is listed on the right of the heatmap. A color bar under scRNA-seq cluster IDs indicates the cell type classification, as according to Figure 4D. (C) Relative average gene set enrichment scores of scRNA-seq clusters calculated by AUCell analysis of enriched gene sets from human bulkRNA-seq sorted data. Scores are relative to other cells within a single gene set comparison (across a row of the heatmap) and are not calculated relative to scores across different gene sets (across columns in the heatmap). Gene sets were created from genes with high expression scores >0.5 or >1 for each respective sorted population of cells, with a greater high expression score indicating greater enrichment. The number of genes included from the bulkRNA-seq dataset and the number and percent of genes detected in the scRNA-seq dataset is listed on the right of the heatmap. A color bar under scRNA-seq cluster IDs indicates the cell type classification, as according to Figure 4D.
FIGURE 6
FIGURE 6
Integration of porcine and human scRNA-seq datasets to further annotate porcine cells. (A) Mapping scores calculated to determine how well porcine cells were represented by the human dataset. The human cell type specific frequency (size of the circle) and mapping score for that human cell type (color) are shown for each porcine scRNA-seq cluster. Porcine cell type classifications (color) are shown below the porcine scRNA-seq cluster IDs. (B) Mapping scores calculated to determine how well porcine cells were represented by the human dataset. The mapping scores for each porcine scRNA-seq cluster is represented by a box and whiskers plot. Porcine cell type classifications (color) are shown below the porcine scRNA-seq cluster IDs. (C) To identify cells in the porcine dataset that were not well represented in the human dataset, a de novo visualization of the merged porcine and human data was performed. The porcine (pink) and human (gray) were plotted together using UMAP. An overlap of both porcine and human cells is shown as (dark red). Clusters of porcine cells that are not well represented in the human data can be observed by pink regions in the plot. (D) Two primary regions of porcine cells that were not well represented in the human data were identified in (C). In order to clarify which porcine scRNA-seq clusters were represented in these regions, the porcine cluster IDs were projected onto the UMAP and cells from four clusters overlapping the identified regions were colored as dark red.
FIGURE 7
FIGURE 7
Transcriptional heterogeneity of porcine CD4+ αβ T-cells at single-cell resolution. (A) Two-dimensional t-SNE plot of 5,082 cells belonging to clusters designated as CD4+ αβ T-cells (clusters 0, 3, 4, and 28) in Figure 4D. Each point represents a single cell. Color of the cell corresponds to transcriptional cluster a cell belongs to. Cells more transcriptionally similar to each other belong to the same cluster. (B) Transcriptomic relationship amongst CD4+ αβ T-cell clusters as calculated by three methods: hierarchical clustering (as seen by hierarchical trees on both axes), pairwise random forest analyses (as seen on top right diagonal); and pairwise DGE analyses (as seen on bottom left diagonal). Longer branches on the hierarchical tree corresponds to greater hierarchical distance. Lower numbers of DEGs by DGE analysis and higher out-of-bag (OOB) error rates from random forest analyses indicate greater pairwise transcriptional similarity. (C) Visualization of CD8A expression overlaid onto t-SNE coordinates of single CD4+ αβ T-cells. Each point represents a single cell. Color of the point corresponds to relative expression of CD8A within a cell. Gray corresponds to little/no gene expression, while navy corresponds to increased gene expression. (D) Relative average gene set enrichment scores of CD4+ αβ T-cell clusters calculated by AUCell analysis of DEG sets from pairwise DGE analysis of the CD4T and CD4CD8T populations from porcine bulkRNA-seq. Scores are relative to other cells within a single gene set comparison (across a row of the heatmap) and are not calculated relative to scores across gene set (across columns in the heatmap). (E,F) Genes with the largest effects in discriminating CD4+ αβ T-cells by cluster identities were determined, as indicated by high permutation (E) and/or impurity scores (F) calculated from a trained random forest model. Average relative expression for each of these genes within clusters is also depicted by a heatmap. (G) Dot plot of up to the top 20 DEGs having logFC > 0 from overall DGE analysis of only CD4 + ab T-cell clusters. Clusters are listed on the y-axis, while selected DEGs are listed on the x-axis. The size of a dot corresponds to the percent of cells in a cluster that expressed the gene. The color of a dot corresponds to the average relative expression level for the gene in the cells expressing the gene within a cluster. *Refer to ‘Gene name replacement’ methods.
FIGURE 8
FIGURE 8
Transcriptional heterogeneity of porcine γδ T-cells at single-cell resolution. (A) Two-dimensional t-SNE plot of 2,652 cells belonging to clusters designated as CD2 γδ T-cells (clusters 6, 21) or CD2+ γδ T-cells (clusters 24, 31) in Figure 4D. Each point represents a single cell. Color of the cell corresponds to transcriptional cluster a cell belongs to. Cells more transcriptionally similar to each other belong to the same cluster. (B) Visualization of selected gene expression overlaid onto t-SNE coordinates of single γδ T-cells. Each point represents a single cell. Color of the point corresponds to relative expression of a specified gene (top left of each t-SNE plot) within a cell. Gray corresponds to little/no gene expression, while navy corresponds to increased gene expression. (C) Transcriptomic relationship amongst γδ T-cell clusters as calculated by three methods: hierarchical clustering (as seen by hierarchical trees on both axes), pairwise random forest analyses (as seen on top right diagonal); and pairwise DGE analyses (as seen on bottom left diagonal). Longer branches on the hierarchical tree corresponds to greater hierarchical distance. Lower numbers of DEGs by DGE analysis and higher out-of-bag (OOB) error rates from random forest analyses indicate greater pairwise transcriptional similarity. (D,E) Genes with the largest effects in discriminating γδ T-cells by cluster identities were determined, as indicated by high permutation (D) and/or impurity scores (E) calculated from a trained random forest model. Average relative expression for each of these genes within clusters is also depicted by a heatmap. (F) Dot plot of up to the top 20 DEGs having logFC > 0 from overall DGE analysis of only γδ T-cell clusters. Clusters are listed on the y-axis, while selected DEGs are listed on the x-axis. The size of a dot corresponds to the percent of cells in a cluster that expressed the gene. The color of a dot corresponds to the average relative expression level for the gene in the cells expressing the gene within a cluster. *Refer to ‘Gene name replacement’ methods.

Similar articles

Cited by

References

    1. Aibar S., González-Blas C. B., Moerman T., Huynh-Thu V. A., Imrichova H., Hulselmans G., et al. (2017). SCENIC: single-cell regulatory network inference and clustering. Nat. Methods 14, 1083–1086. 10.1038/nmeth.4463 - DOI - PMC - PubMed
    1. Alter G., Malenfant J. M., Altfeld M. (2004). CD107a as a functional marker for the identification of natural killer cell activity. J. Immunol. Methods 294 15–22. 10.1016/j.jim.2004.08.008 - DOI - PubMed
    1. Alvarez J. I., Kébir H., Cheslow L., Charabati, Chabarati M., Larochelle C., et al. (2015). JAML mediates monocyte and CD8 T cell migration across the brain endothelium. Ann. Clin. Transl. Neurol. 2 1032–1037. 10.1002/acn3.255 - DOI - PMC - PubMed
    1. Andersson L., Archibald A. L., Bottema C. D., Brauning R., Burgess S. C., Burt D. W., et al. (2015). Coordinated international action to accelerate genome-to-phenome with FAANG, the Functional Annotation of Animal Genomes project. Genome Biol. 16:57. 10.1186/s13059-015-0622-4 - DOI - PMC - PubMed
    1. Andrews T. S., Kiselev V. Y., McCarthy D., Hemberg M. (2021). Tutorial: guidelines for the computational analysis of single-cell RNA sequencing data. Nat. Protoc. 16 1–9. 10.1038/s41596-020-00409-w - DOI - PubMed