. 2021 Jun 15;11(6):3002-3020.
eCollection 2021.

Screening and diagnosis of colorectal cancer and advanced adenoma by Bionic Glycome method and machine learning

Affiliations

Screening and diagnosis of colorectal cancer and advanced adenoma by Bionic Glycome method and machine learning

Yiqing Pan et al. Am J Cancer Res. .

Abstract

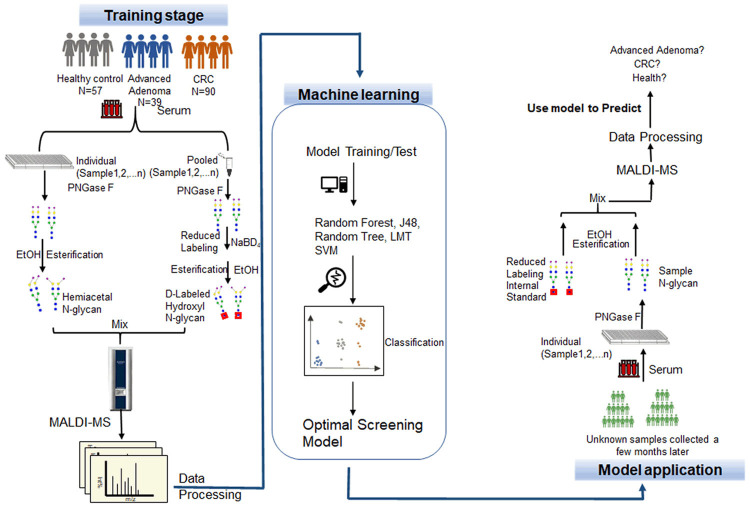
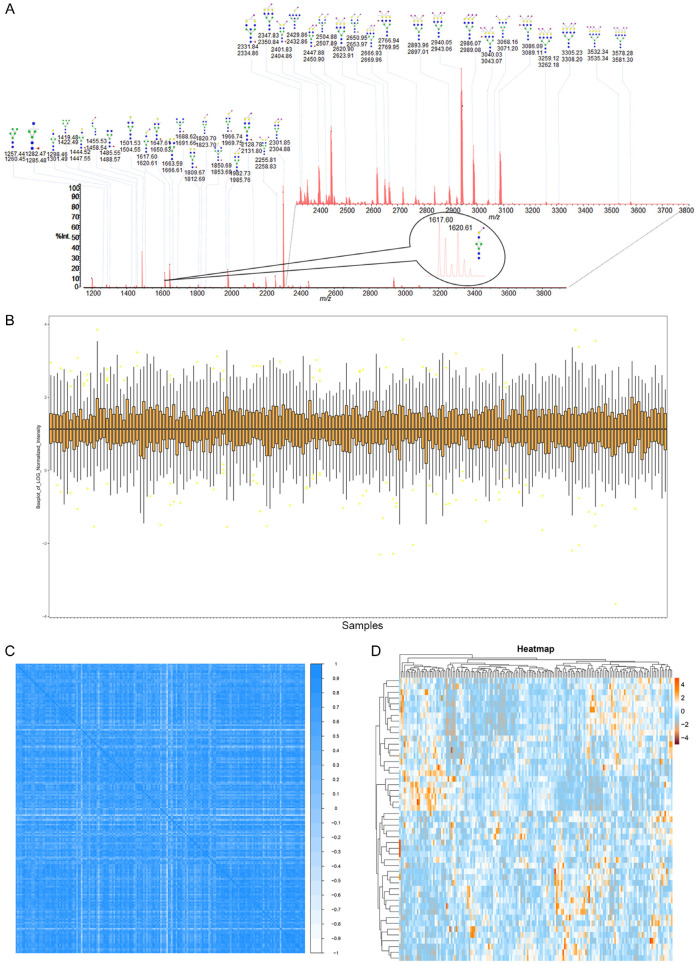
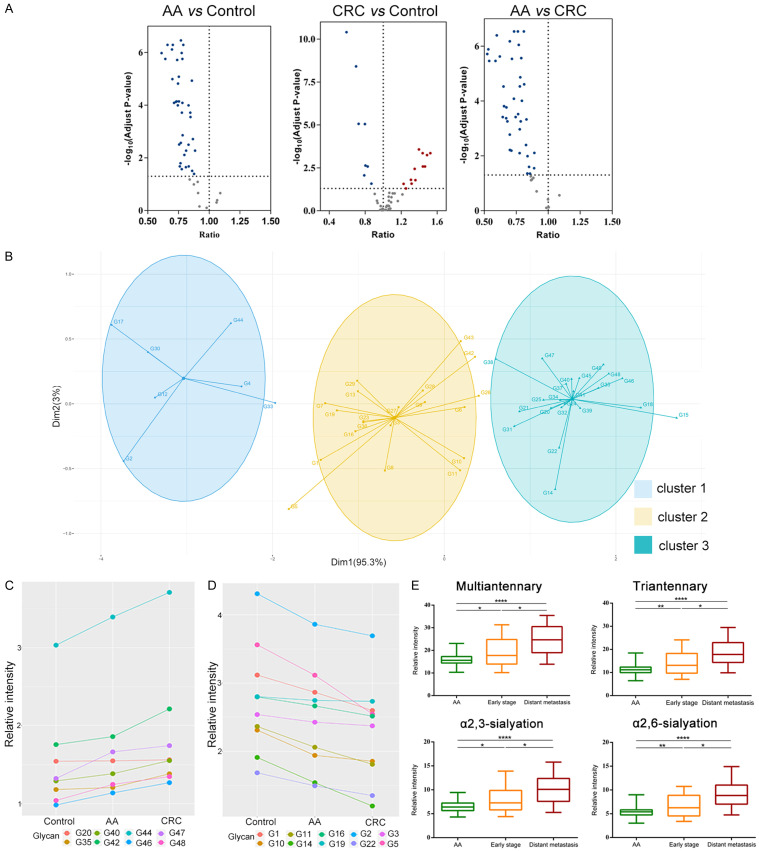
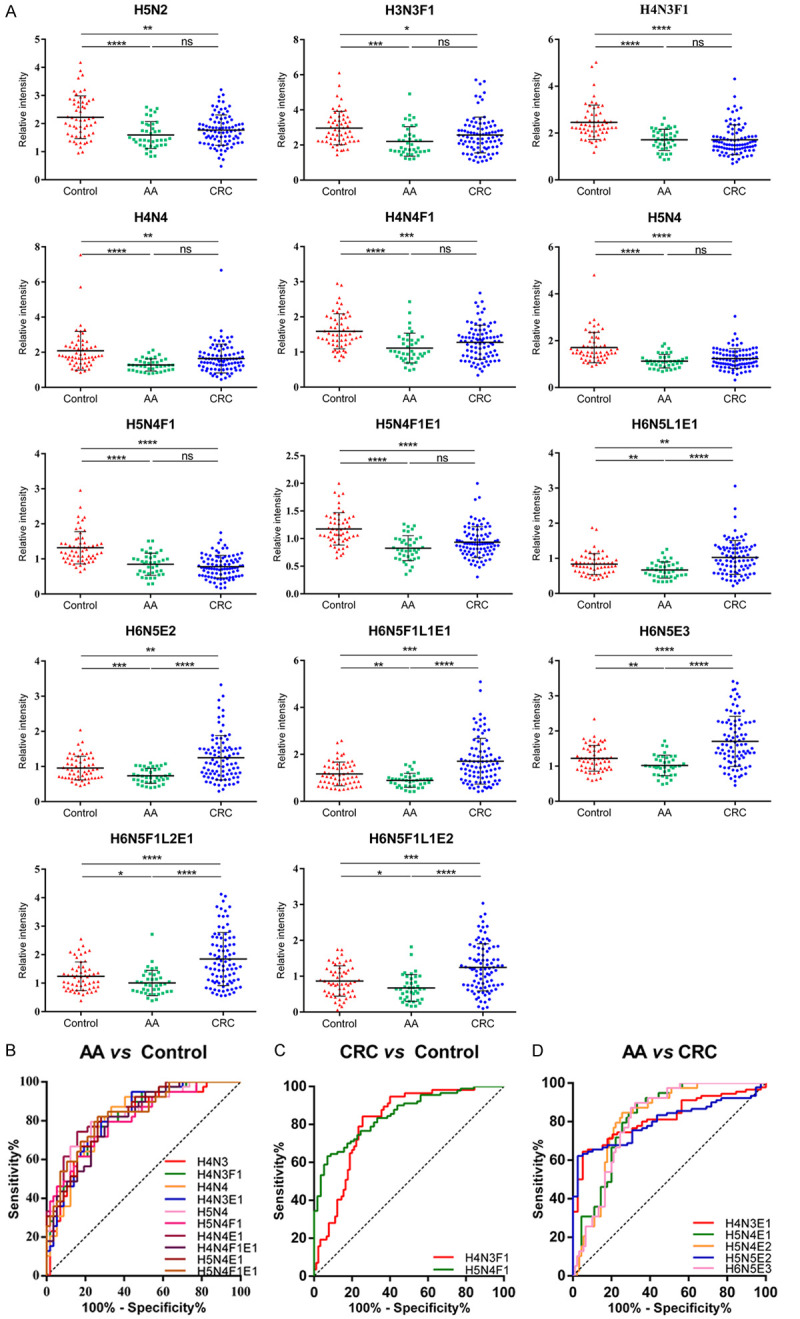
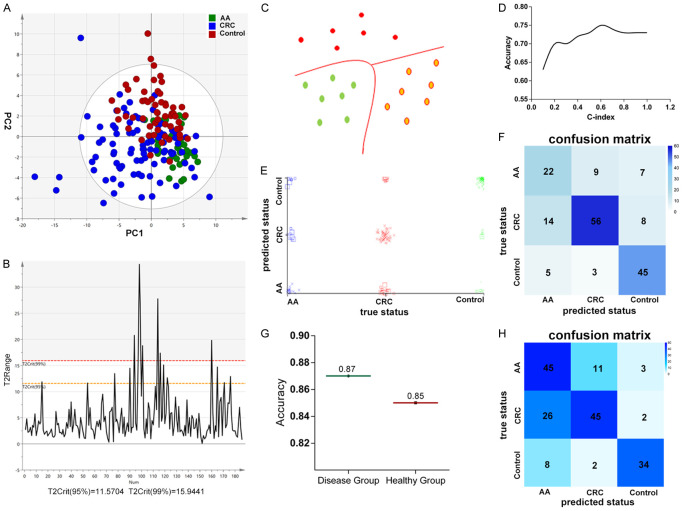
Colorectal cancer (CRC), one of the major health problems worldwide, mostly develops from colorectal adenomas. Advanced adenomas are generally considered as precancerous lesions and patients are recommended to remove the adenomas. Screening for colorectal cancer is usually performed by fecal tests (FOBT or FIT) and colonoscopy, however, their benefits are limited by uptake and adherence. Most CRC develops from colorectal advanced adenomas, but there is currently a lack of effective noninvasive screening method for advanced adenomas. N-glycans in human serum hold the great potentials as biomarker for diagnosis of human cancers. Our aim was to discover blood-based markers for screening and diagnosis of advanced adenomas and CRC, and to ascertain their efficiency in classifying healthy controls, patients with advanced adenomas and CRC by incorporating machine learning techniques with reliable and simple quantitative method with "Bionic Glycome" as internal standard based on the high-throughput Matrix-assisted Laser Desorption/Ionization Mass Spectrometry (MALDI-MS). The quantitative results showed that there is a positive correlation between multi-antennary, sialylated N-glycans and CRC progress, while bi-antennary core-fucosylated N-glycans are negatively correlated with CRC progress. Machine learning is a powerful classification tool, suitable for mining big data, especially the large amount of data generated by high-throughput technologies. Using the predictive model constructed by machine learning, we obtained the classification accuracy of 75% for classification of 189 samples including CRC, advanced adenomas and healthy controls, and the accuracy of 87% for detection of the disease group that required treatment, including CRC and advanced adenomas. To our delight, the model successfully applied to the prediction of 176 samples collected a few months later, and five samples were wrongly predicted in the disease group. Overall, this diagnostic model we constructed here has valuable potential in the clinical application of detecting advanced adenomas and colorectal cancer and could compensate for the limitations of the current screening methods for detection of CRC and advanced adenomas.

Keywords: Colorectal cancer; advanced adenoma; biomarker; internal standard; machine learning; mass spectrometry; serum N-glycome quantification.


Conflict of interest statement

None.

Figures

Figure 1
Figure 1
Overview of the whole workflow of the study. Screening and diagnosis of colorectal cancer and advanced adenoma by Bionic Glycome method and machine learning. CRC, colorectal cancer; LMT, logistic model trees; SVM, support vector machine.
Figure 2
Figure 2
Serum N-glycan information in the training cohort. A. The presentative MALDI-MS spectrum of the mixture of N-glycome from human serum and its Bionic Glycome as internal standard. All the m/z values of glycan peaks were single sodium adducts ([M+Na]+). A total of 49 doublets with a 3 Da mass difference was detected and the inset is an enlarged spectrum of one doublet at m/z 2301.85/2304.88. Green circle, Man; yellow circle, Gal; blue square, GlcNAc; red triangle, Fuc; clockwise purple diamond, α2,6-linked sialic acid; anticlockwise purple diamond, α2,3-linked sialic acid. B. Relative intensity box plot of N-glycome for all samples in the training cohort. C. Person correlation analysis of N-glycome for all samples in the training cohort. D. Heatmap of serum N-glycans in Healthy control, Advanced Adenoma and Colorectal Cancer.
Figure 3
Figure 3
Changes of serum N-glycome in patients with CRC and advanced adenomas. (A) Volcano plots showed the differentially expressed N-glycans in three groups (AA vs Control, CRC vs Control, AA vs CRC; AA, Colorectal Advanced Adenoma; CRC, Colorectal Cancer; x axis, ratio of the N-glycans between two groups; y axis, adjust p-value). Adjust p-value <0.05 was considered statistically significant and the ratio between the two groups less than 1 was considered to be a decrease while greater than 1 was considered to be an increase. The dotted lines show the threshold for statistical significance. Red dots represent the increased, and blue dots represent the decreased. (B) Unsupervised cluster analysis of the N-glycome in three groups by K-means clustering algorithm. (C, D) The correlations between the glycans and CRC progress. The glycans that were positively (C) or negatively (D) related to the progression of CRC. The threshold of the Pearson’s correlation coefficient was set to be r>0.9. (E) Changes of the relative intensity of four derived glycosylation traits (multiantennary, triantennary, α2,3-sialyation, α2,6-sialyation) in advanced adenoma, early stage and late stage CRC (Early stage, TNM = 1; Distant metastasis, TNM = 4. * The equivalent of P<0.05, ** the equivalent of P<0.01, *** the equivalent of P<0.001, **** the equivalent of P<0.0001).
Figure 4
Figure 4
Relative intensity of the N-glycans with significant differences and their ROC analysis. (A) Scatter plot depicting the different relative intensity of fourteen N-glycans structure in AA and CRC compared with healthy controls. (B-D) Receiver operating characteristic (ROC) curve analyses for the the N-glycans with AUC above 0.8 of AA vs Control (B), CRC vs Control (C) and AA vs CRC (D). H = hexose, N = N-acetylhexosamine, F = fucose, L = lactonized N-acetylneuraminic acid (α2,3-linked), E = ethyl esterified N-acetylneuraminic acid (α2,6-linked). * The equivalent of P<0.05, ** the equivalent of P<0.01, *** the equivalent of P<0.001, **** the equivalent of P<0.0001.
Figure 5
Figure 5
Disease classification with N-glycome combining machine learning. A. O2PLS-DA of the three groups. B. Hotelling’s T2Range Line Plot of the samples. C. Schematic diagram of SVM. D. Schematic diagram of optimizing c-index. E, F. Classification performance of the model constructed by machine learning with Support Vector Machine in training cohort. E. Scatter plot depicting the prediction results of the model on samples, with each point representing one sample. F. Confusion matrix indicating classification result. G. The diagnostic accuracy of the disease group (advanced adenoma and colorectal cancer) and the healthy group in training cohort. H. Confusion matrix indicating the classification performance in validation cohort.

References

    1. Bray F, Ferlay J, Soerjomataram I, Siegel RL, Torre LA, Jemal A. Global cancer statistics 2018: GLOBOCAN estimates of incidence and mortality worldwide for 36 cancers in 185 countries. CA Cancer J Clin. 2018;68:394–424. - PubMed
    1. Bjerrum A, Lindebjerg J, Andersen O, Fischer A, Lynge E. Long-term risk of colorectal cancer after screen-detected adenoma: experiences from a Danish gFOBT-positive screening cohort. Int J Cancer. 2020;147:940–947. - PubMed
    1. Etzioni R, Urban N, Ramsey S, McIntosh M, Schwartz S, Reid B, Radich J, Anderson G, Hartwell L. The case for early detection. Nat Rev Cancer. 2003;3:243–252. - PubMed
    1. Malila N, Senore C, Armaroli P. European guidelines for quality assurance in colorectal cancer screening and diagnosis. First edition--organisation. Endoscopy. 2012;44(Suppl 3):SE31–48. - PubMed
    1. Bretthauer M. Colorectal cancer screening. J Intern Med. 2011;270:87–98. - PubMed

LinkOut - more resources