. 2021 Jun 28;10(1):1939601.
doi: 10.1080/2162402X.2021.1939601. eCollection 2021.

A novel miR1983-TLR7-IFNβ circuit licenses NK cells to kill glioma cells, and is under the control of galectin-1

Affiliations

A novel miR1983-TLR7-IFNβ circuit licenses NK cells to kill glioma cells, and is under the control of galectin-1

Diana Shah et al. Oncoimmunology. .

Abstract

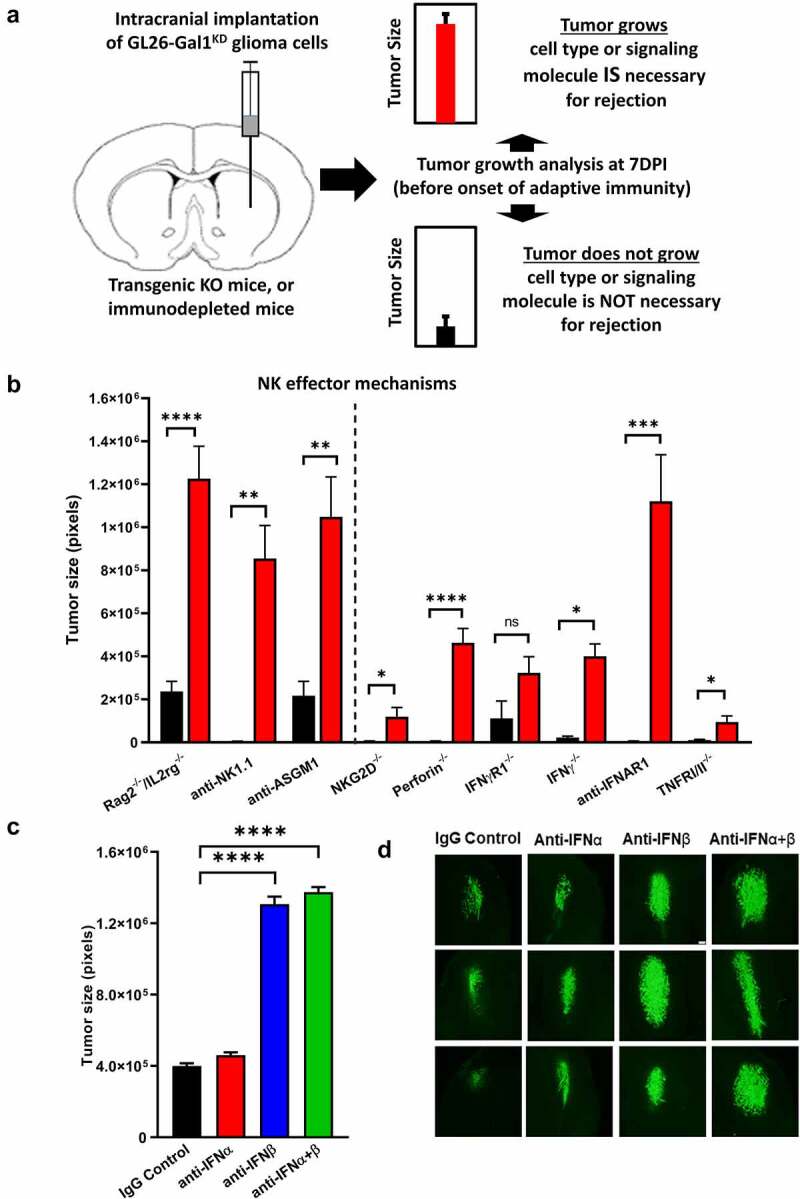
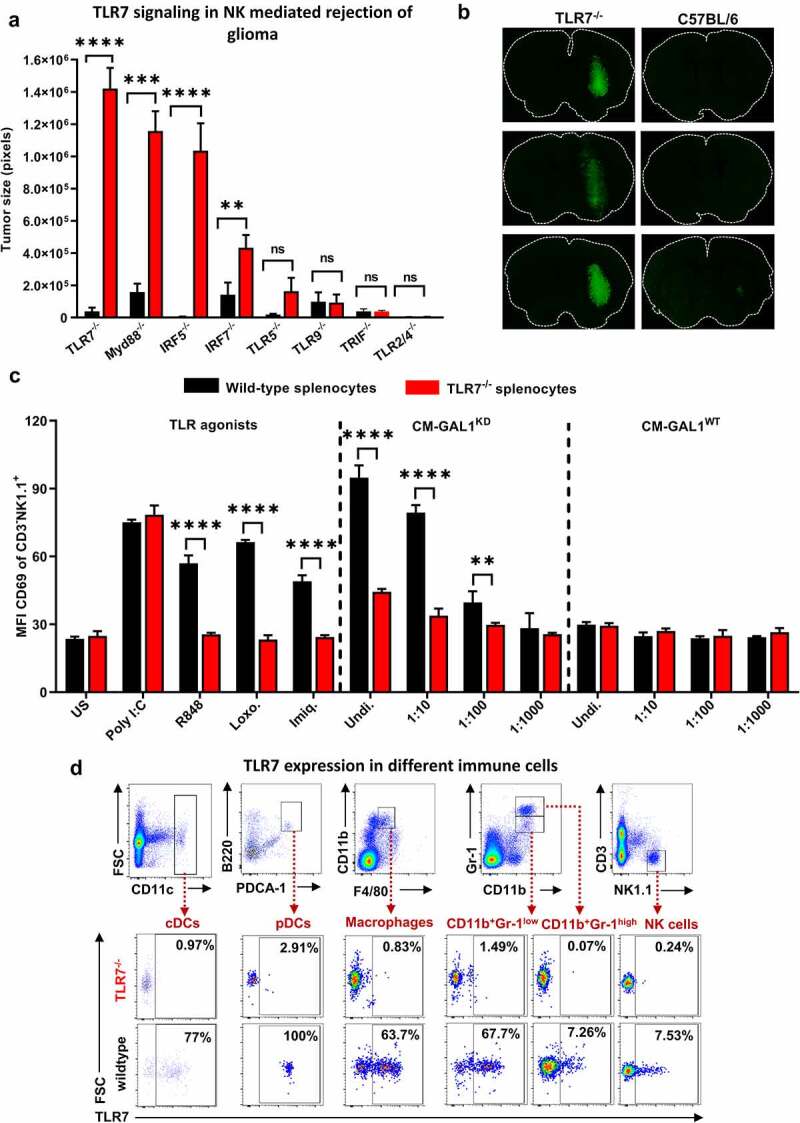
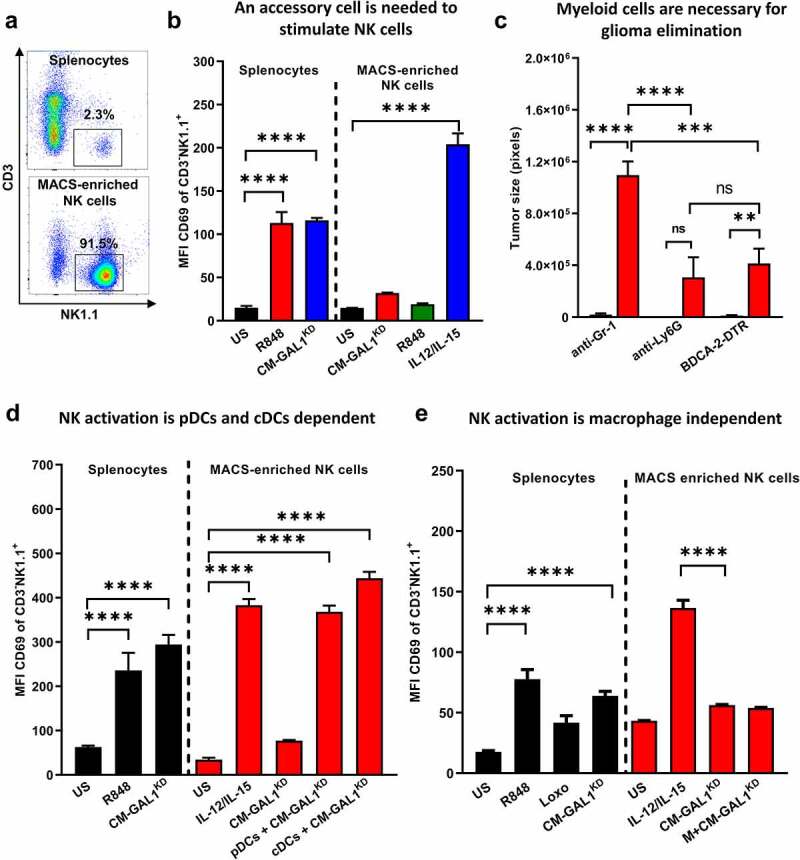
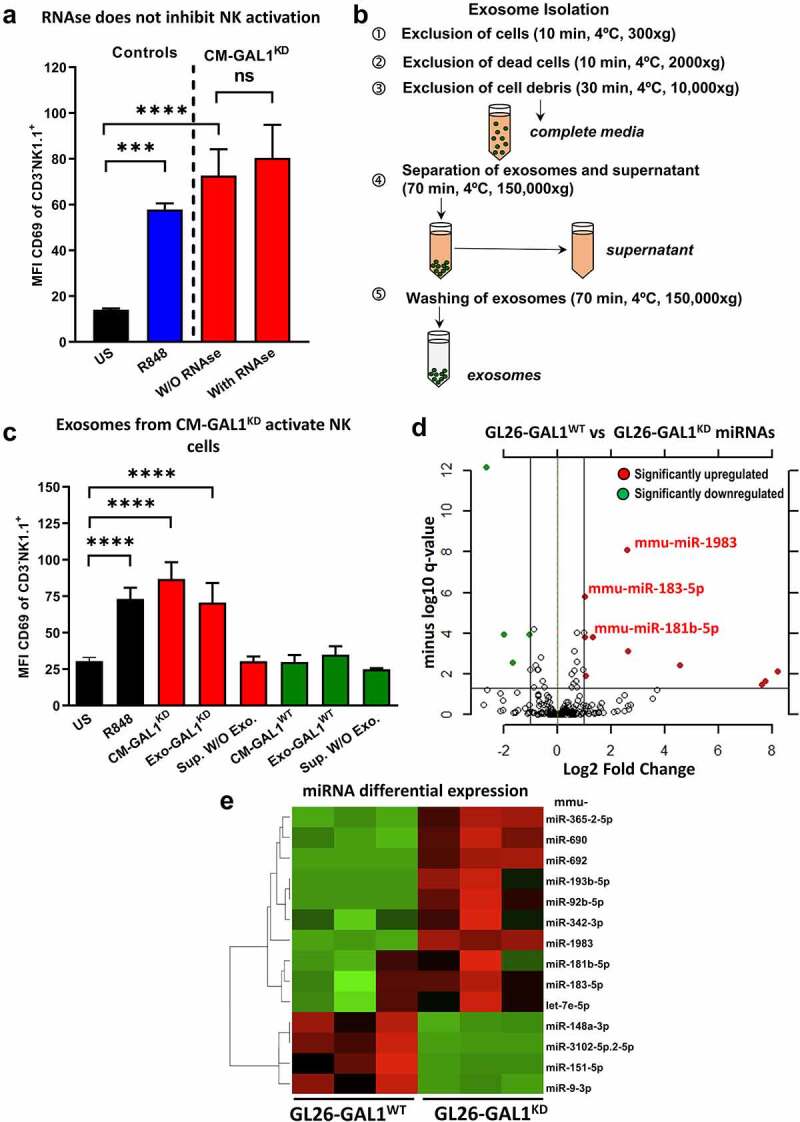
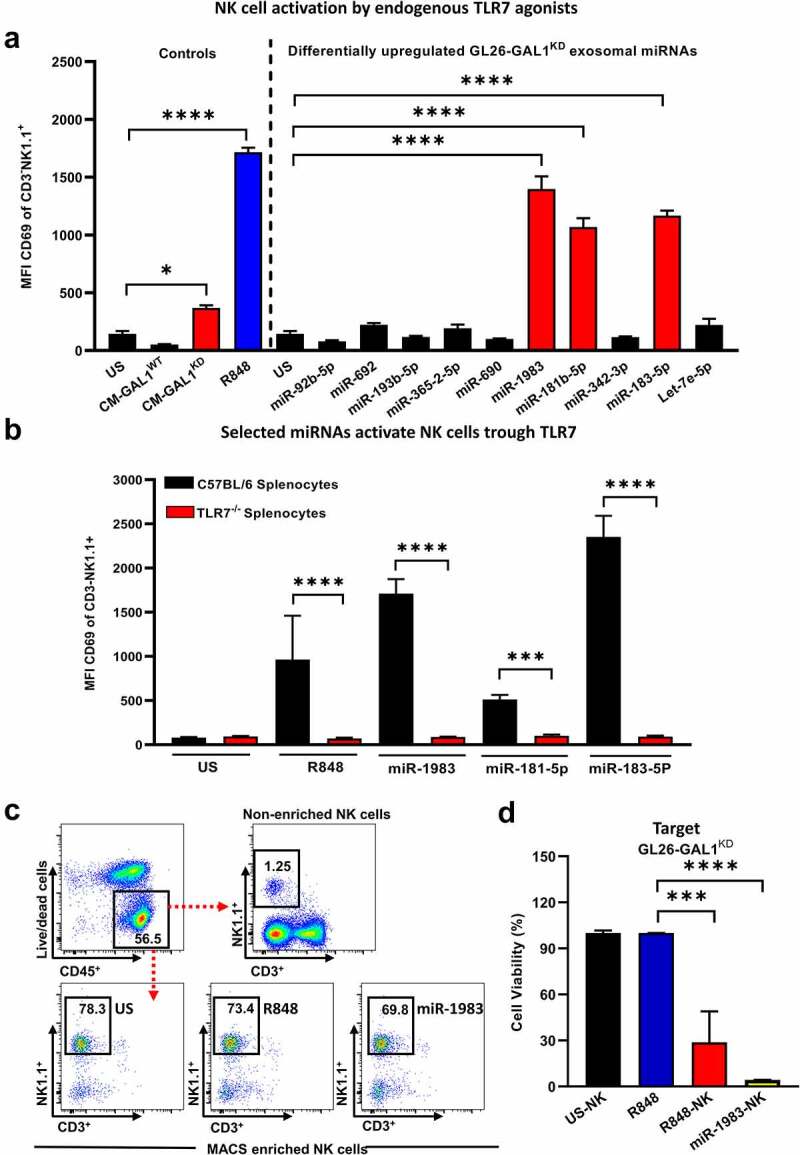
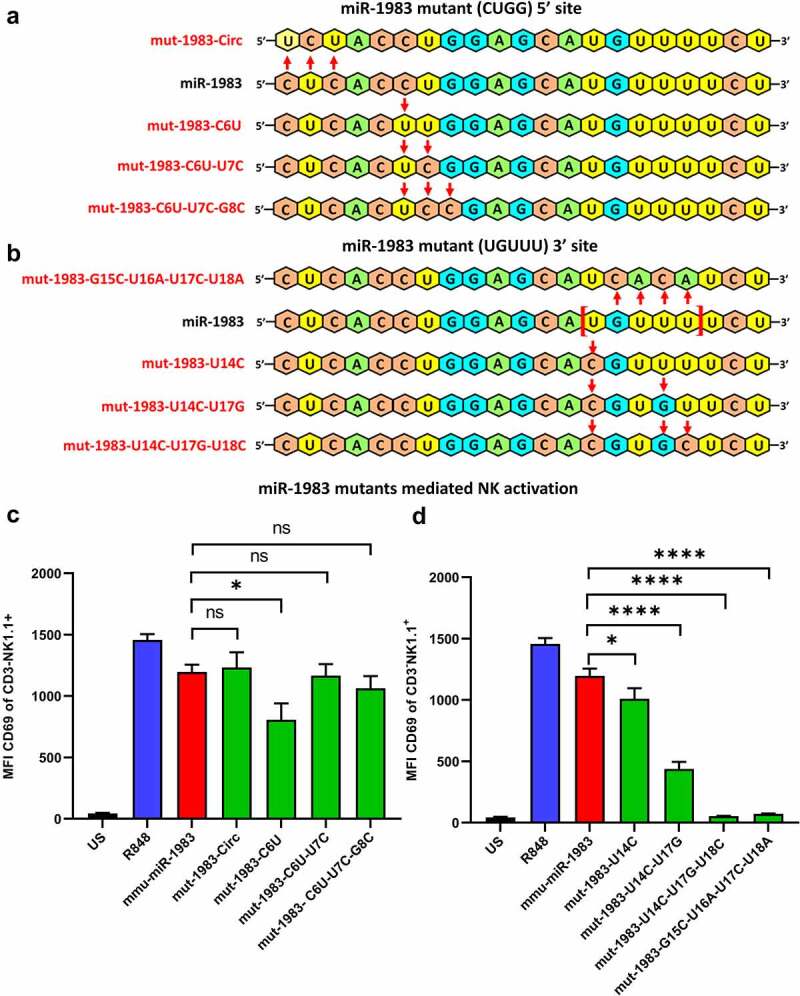
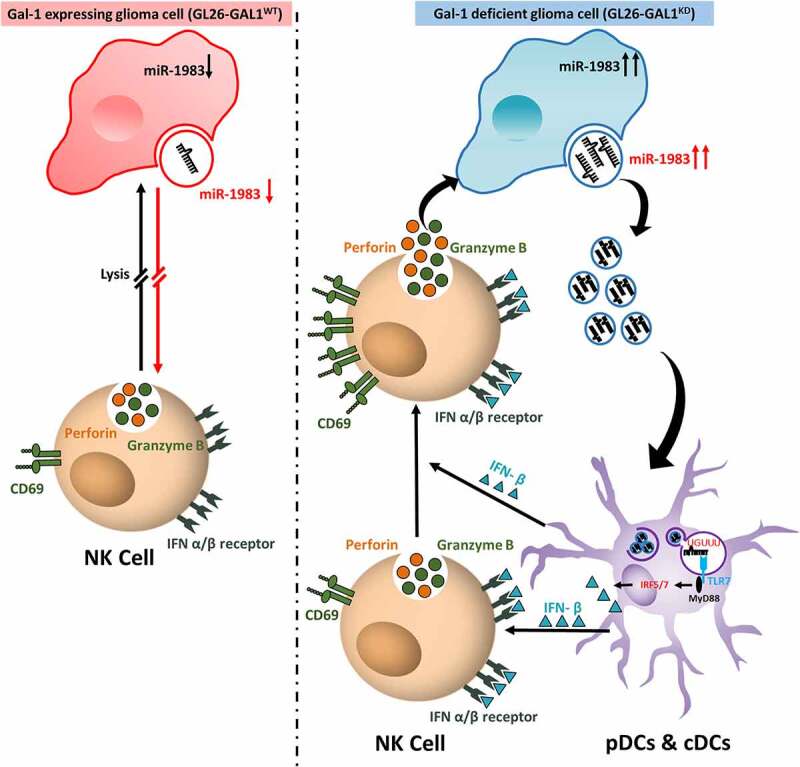
Although pharmacological stimulation of TLRs has anti-tumor effects, it has not been determined whether endogenous stimulation of TLRs can lead to tumor rejection. Herein, we demonstrate the existence of an innate anti-glioma NK-mediated circuit initiated by glioma-released miR-1983 within exosomes, and which is under the regulation of galectin-1 (Gal-1). We demonstrate that miR-1983 is an endogenous TLR7 ligand that activates TLR7 in pDCs and cDCs through a 5'-UGUUU-3' motif at its 3' end. TLR7 activation and downstream signaling through MyD88-IRF5/IRF7 stimulates secretion of IFN-β. IFN-β then stimulates NK cells resulting in the eradication of gliomas. We propose that successful immunotherapy for glioma could exploit this endogenous innate immune circuit to activate TLR7 signaling and stimulate powerful anti-glioma NK activity, at least 10-14 days before the activation of anti-tumor adaptive immunity.

Keywords: Glioblastoma; IFN-β; IRF5; IRF7; MyD88; NK cells; TLR7; galectin-1; miR-1983.


Figures

Figure 1.
Figure 1.
Gal-1 deficient glioma is rejected by NK cells through IFN-β/IFNAR1 signaling. (a) Illustration of experimental design to analyze galectin-1 deficient (GL26-GAL1KD) glioma growth in transgenic knockout or immunodepleted mice. (b) Quantification of tumor size (in pixels) in Rag2−/-/IL2rg−/- mice (which lack B cells, T cells, as well as functional NK cells), NK- immunodepleted mice with anti-NK1.1 or anti-ASGM1, or mice lacking the specific molecule of NK effector signaling pathway (i.e., NKG2D−/-, perforin−/-, IFNγR1−/-, IFNγ−/-, TNFRI/II−/-), and IFNAR1 immunodepleted mice after 7DPI. Control mice (C57BL/6 J) are shown in black while transgenic and immunodepleted mice are shown in red. Data are shown as mean ± SEM. *p < .05, **p < .01, ***p < .001, and ****p < .0001 versus respective control groups (one-way ANOVA). (c) Quantification of tumor size (in pixels) in immunodepleted mice for IFN-α or IFN-β or both IFN-α + IFN-β compared to IgG isotype treated control group. Data are represented as mean ± SEM. *p < .05, **p < .01, ***p < .001, and ****p < .0001 versus respective control group (one-way ANOVA). (d) Representative fluorescence micrograph of GL26-GAL1KD glioma growth implanted in immunodepleted mice for IFN-α or IFN-β or both IFN-α + IFN-β
Figure 2.
Figure 2.
NK cells eradicate GL26-GAL1KD glioma through TLR7 signaling. (a) Quantification of GL26-GAL1KD glioma tumor size (in pixels) in transgenic mice lacking one particular (TLR7, TLR5 or TLR9) or a combination of two different (TLR2 and TLR4) MyD88-dependent TLRs or IRF5−/- or IRF7−/- or in TRIF−/- mice in red and respective wt controls (C57BL/6 J) are shown in black. Data are represented as mean ± SEM. *p < .05, **p < .01, ***p < .001, and ****p < .0001 versus respective control group (one-way ANOVA) after 7DPI. (b) Representative fluorescence micrographs of GL26-GAL1KD glioma growth implanted in the striatum of TLR7−/- mice vs C57BL/6 J as a wt control after 7DPI. Glioma growth is seen in each TLR7−/- transgenic mouse (green fluorescent), conversely, only a scar at the initial tumor implantation site is observed in C57BL/6 J. (c) Flow cytometric analysis of CD69 expression on CD3-NK1.1+ NK cells after co-culture of splenocytes from (C57BL/6 J) wt or TLR7−/- mice with CM-GAL1KD or CM-GAL1WT. Control groups are either stimulated with TLR7 agonists (R848, Loxoribine, or Imiquimod) which served as a positive control or with fresh media (unstimulated controls). To demonstrate functionality of NK cells from both splenocytes preparations, we included a control group that was stimulated with a TLR3 agonist (poly I:C). NK cells of wt as well as TLR7−/- mice responded with increased CD69 expression to TLR3-specific stimulation, compared to US. Middle panel shows the co-culture of splenocytes with a serial dilution of CM-GAL1KD with fresh medium at 1:10, or 1:100, or 1:1000. Right panel shows the co-culture of splenocytes with a serial dilution of CM-GAL1WT with fresh medium at 1:10, or 1:100, or 1:1000. Wt splenocytes are shown in black while TLR7−/- are shown in red. CD69 expression is shown as mean fluorescent intensity (MFI) in the bar graph. Data are represented as mean ± SEM. *p < .05, **p < .01, ***p < .001, and ****p < .0001 versus respective control group (one-way ANOVA). (d) Representative flow cytometric plots of TLR7 expression on CD3NK1.1+ NK cells, or CD45+CD11c+PDCA1+B220+ pDCs, or CD45+CD11c+PDCA1B220 cDCs or in monocytic Gr-1lowCD11b+ expressing myeloid cells, or CD11b+F4/80+ macrophages or Gr-1highCD11b+ cells from wt C57BL/6 J controls vs TLR7−/- splenocytes
Figure 3.
Figure 3.
pDCs and cDCs are essential for the activation of NK cells. (a) Representative flow cytometry plots of CD3NK1.1+ NK cells population in splenocytes vs magnetically activated cell sorting (MACS) enriched NK cells. (b) Flow cytometric analysis of CD69 expression on CD3NK1.1+ NK cells within whole splenocytes preparations or on MACS enriched NK cells. Whole splenocytes or MACS enriched NK cells was incubated with CM-GAL1KD or R848, a TLR7 agonist. (R848) served as a positive control for whole splenocytes while fresh medium treated served as unstimulated controls (US). IL12/IL15 treatment served as a positive control for NK cells alone (MACS enriched). CD69 expression is shown as mean fluorescent intensity (MFI) in the bar graph. Data are represented as mean ± SEM. *p < .05, **p < .01, ***p < .001, and ****p < .0001 versus respective control group (one-way ANOVA). (c) Quantification of GL26-GAL1KD glioma tumor size (in pixels) in immunodepleted Gr-1 expressing myeloid cells by repeated administration of an anti-Gr-1 antibody mice or immunodepleted Ly6G-expressing myeloid or in BDCA-2-DTR transgenic mice. Depletion of plasmacytoid dendritic cells (pDCs) in BDCA-2-DTR mice was performed by intraperitoneal injections of 100 ng diphtheria toxin on days −1, 1, 3, 5 DPI. Wt C57BL/6 J controls are shown in black while immunodepleted or transgenic mice are shown in red. (d-e) To identify the essential accessory cells, we co-cultured MACS-enriched NK cells with pDCs or cDCs (d) or macrophages (e) in the presence of CM-GAL1KD. R848, a TLR7 agonist. (R848) served as a positive control for whole splenocytes while fresh medium treated served as unstimulated controls (US). IL12/IL15 treatment served as a positive control for NK cells alone (MACS enriched). CD69 expression is shown as mean fluorescent intensity (MFI). Data are represented as mean ± SEM. *p < .05, **p < .01, ***p < .001, and ****p < .0001 versus respective control group (one-way ANOVA)
Figure 4.
Figure 4.
TLR7 ligands are enclosed within exosomes, which show differential miRNA expression. (a) Flow cytometric analysis of CD69 expression on CD3NK1.1+ NK cells in the different experimental conditions. CM-GAL1KD pre-treated with RNAse at a dose of 5 U/ml for 30 minutes at 37°C and then inactivated with RNAse OUT solution used at 40 U/ml. Splenocytes of wt C57BL/6 J mice were then incubated with pre-treated CM-GAL1KD for 18 h to determine the CD69 expression on NK cells. CD69 expression is shown as mean fluorescent intensity (MFI) in the bar graph. Data are represented as mean ± SEM. *p < .05, **p < .01, ***p < .001, and ****p < .0001 versus respective control group (one-way ANOVA). (b) Schematic representation of the protocol used for exosome isolation from media conditioned by GL26-GAL1KD or GL26-GAL1WT glioma cells. (c) Flow cytometric analysis of CD69 expression on CD3NK1.1+ NK cells in the different experimental conditions. For the control condition splenocytes from wt mice (C57BL/6) were incubated with fresh medium (US), or R848, a TLR7 agonist. To assess if exosomes could be transporting the NK-stimulating factor, splenocytes were stimulated with complete conditioned medium (CM-GAL1KD or CM-GAL1WT), or isolated exosomes (Exo-GAL1KD or Exo-GAL1WT), or supernatant depleted of exosomes (Sup W/O Exo.) derived either from GL26-GAL1KD or GL26-GAL1WT cells. Data are represented as mean ± SEM corresponding to four technical replicates. *p < .05, **p < .01, ***p < .001, and ****p < .0001 versus respective control group (one-way ANOVA). (d) Volcano plot which illustrates differentially expressed (DE) miRNA isolated from exosomes derived from GL26-GAL1KD or GL26-GAL1WT glioma cells. Differentially expressed genes (n = 14) were selected by fold change ≥ 2 (log2 fold change of ≥1 or ≤-1) and a q-value (FDR corrected p-value) ≤0.05 (-log10 FDR of ≥1.30103). Data is plotted as – log10 of the false discovery rate (FDR, y-axis) and the log2 fold change between the compared groups (log2foldchange, x-axis). Upregulated genes are shown in red dots (n = 10) and downregulated genes in green dots (n = 4). The FDR-adjusted significance q-values were calculated using a two-sided moderated Student’s t-test. (e) Heat map of supervised analysis using Top 50 Variable microRNAs from exosomes derived from GL26-GAL1KD or GL26-GAL1WT glioma conditioned media. Heat map shows miRNA expression pattern within the exosomes. Three biological replicates per group were analyzed. Upregulated genes are represented in red and downregulated genes are represented in green (q-value ≤ 0.05 and fold change ≥ 2). The differential expression of miRNA genes in both conditions is clearly visible
Figure 5.
Figure 5.
miR-1983 pre-activated NK cells induces GL26-GAL1KD glioma cytotoxicity. (a) Differentially expressed miRNAs from miRNA-seq data were tested for their ability to induce an increase in CD69 expression on NK cells in the whole splenocytes. Splenocytes from C57BL/6 J mice were stimulated with 1 μM of differentially upregulated miRNAs agonists for 18 h. CD69 expression on CD3NK1.1+ NK cells was analyzed using flow cytometry. We also included a comparison between the conditioned media from the galectin-1 expressing (CM-GAL1WT) and deficient cells (CM-GAL1KD). R848, a TLR7 synthetic agonist treated group served as positive control while fresh medium treated served as unstimulated controls (US). Data are represented as mean ± SEM corresponding to four technical replicates. *p < .05, **p < .01, ***p < .001, and ****p < .0001 versus respective control group (one-way ANOVA). (b) We considered the three miRNAs that have the strongest effect viz., miR-1983, miR-183-5p, and miR-181b-5p for determining its TLR7 specificity. We also included an unstimulated control group (fresh-media, US) as well as a positive control group receiving R848, a TLR7-specific synthetic agonist. Wt C57BL/6 J splenocytes are shown in black while TLR7−/- splenocytes are shown in red. Data are represented as mean ± SEM corresponding to four technical replicates. *p < .05, **p < .01, ***p < .001, and ****p < .0001 versus respective control group (one-way ANOVA). (c) Representative flow cytometry plots illustrating the CD3NK1.1+ NK cells in the unsorted population or MACS sorted NK cells. Splenocytes were treated either with fresh medium (US) or R848, or miR-1983 and after 18 h of incubation, MACS-enrichment was performed. (d) GL26-GAL1KD glioma cells were incubated for 72 hr with the MACS-enriched NK cells pretreated either with fresh medium (US-NK) or R848, a TLR7 agonist (R848-NK), or 1 μM of miR-1983 in DOTAP liposomal transfection reagent. Cell viability was evaluated by performing the CellTiter-Glo (CTG) assay and data are represented as % viability normalized to R848 treated gliomas cells (R848 only). Data are represented as mean ± SEM corresponding to three technical replicates. *p < .05, **p < .01, ***p < .001, and ****p < .0001 versus respective control group (one-way ANOVA)
Figure 6.
Figure 6.
miR-1983 binds to TLR7 through a UGUUU motif to stimulate NK cell activation. To identify the TLR7 binding motif, we mutated various nucleosides within miR-1983, and tested their capacity to stimulate NK cell activation. (a-b) represent the schematics of nucleoside sequence present in parent miR-1983 and corresponding mutations in the CUGG motif toward 5ʹ end (a), and in the UGUUU motif toward 3ʹ end (b). Mutation incorporation site was indicated by the red arrow with respect to the sequence of parent miR-1983. (c-d) Flow cytometric analysis of CD69 expression on CD3NK1.1+ NK cells in response to incubation with various miR-1983 mutants. Panel (c) shows the activation in response to CUGG motif mutants while Panel (d) shows the UGUUU motif mutant mediated NK activation. R848, a TLR7 synthetic agonist treated group served as positive control while fresh medium treated served as unstimulated controls (US). Data are represented as mean ± SEM corresponding to four technical replicates. *p < .05, **p < .01, ***p < .001, and ****p < .0001 versus respective control group (one-way ANOVA)
Figure 7.
Figure 7.
Summary: Schematic of the innate anti-glioma immune circuit mediated by miR-1983-TLR7-NK axis. We discovered the existence of a TLR7-dependent anti-glioma NK-mediated innate immune circuit which is regulated by exosomal miR-1983 and is under the regulation of Gal-1. Right panel shows that GL26-GAL1KD glioma cells release miRNAs within the exosomes that can act as endogenous TLR7 ligands and bind to TLR7 through a UGUUU motif in miR-1983, in a myeloid cell population, such as cDCs and pDCs. TLR7 activation and downstream signaling through MyD88 activates IRF5 and IRF7 which in turn increase release of IFNβ. The release of IFNβ stimulates NK cells to kill glioma cells by releasing the Perforin and Granzyme B. Left panel shows that galectin-1 expressing GL26-GAL1WT glioma cells produces low level of miR-1983 which makes them unable to trigger the innate immune circuit. Altogether, we found the existence of a novel miR1983-TLR7-IFNβ-NK axis which triggers an anti-glioma NK-mediated innate immune circuit in GL26-GAL1KD glioma cells

References

    1. Zhang AS, Ostrom QT, Kruchko C, Rogers L, Peereboom DM, Barnholtz-Sloan JS.. Complete prevalence of malignant primary brain tumors registry data in the United States compared with other common cancers, 2010. Neuro Oncol. 2017;19(5):726–19. doi:10.1093/neuonc/now252. - DOI - PMC - PubMed
    1. Perillo NL, Pace KE, Seilhamer JJ, Baum LG. Apoptosis of T cells mediated by galectin-1. Nature. 1995;378(6558):736–739. doi:10.1038/378736a0. - DOI - PubMed
    1. Rubinstein N, Alvarez M, Zwirner NW, Toscano MA, Ilarregui JM, Bravo A, Mordoh J, Fainboim L, Podhajcer OL, Rabinovich GA. Targeted inhibition of galectin-1 gene expression in tumor cells results in heightened T cell-mediated rejection; A potential mechanism of tumor-immune privilege. Cancer Cell. 2004;5(3):241–251. doi:10.1016/S1535-6108(04)00024-8. - DOI - PubMed
    1. Baker GJ, Chockley P, Yadav VN, Doherty R, Ritt M, Sivaramakrishnan S, Castro MG, Lowenstein PR. Natural killer cells eradicate galectin-1-deficient glioma in the absence of adaptive immunity. Cancer Res. 2014;74(18):5079–5090. doi:10.1158/0008-5472.CAN-14-1203. - DOI - PMC - PubMed
    1. Baker GJ, Chockley P, Zamler D, Castro MG, Lowenstein PR. Natural killer cells require monocytic Gr-1 + /CD11b + myeloid cells to eradicate orthotopically engrafted glioma cells. Oncoimmunology. 2016;5(6):e1163461. doi:10.1080/2162402X.2016.1163461. - DOI - PMC - PubMed

Publication types

LinkOut - more resources