

COVID-19 Community Temporal Visualizer: a new methodology for the network-based analysis and visualization of COVID-19 data
- PMID: 34249598
- PMCID: PMC8253246
- DOI: 10.1007/s13721-021-00323-5
COVID-19 Community Temporal Visualizer: a new methodology for the network-based analysis and visualization of COVID-19 data
Abstract
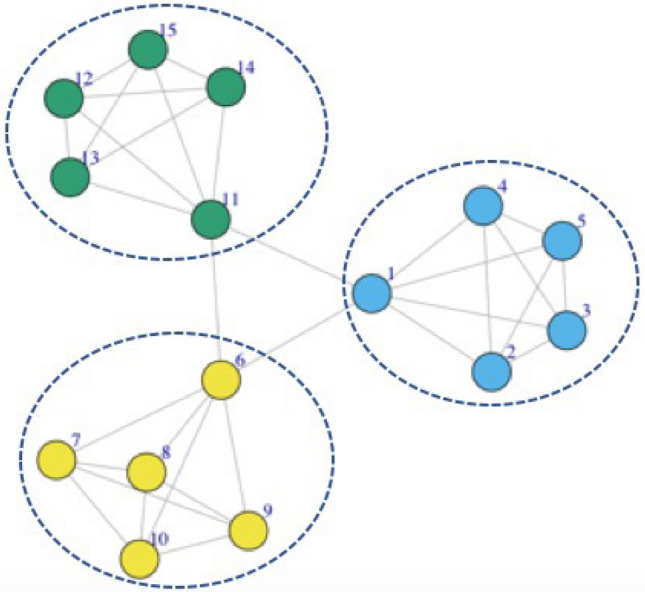
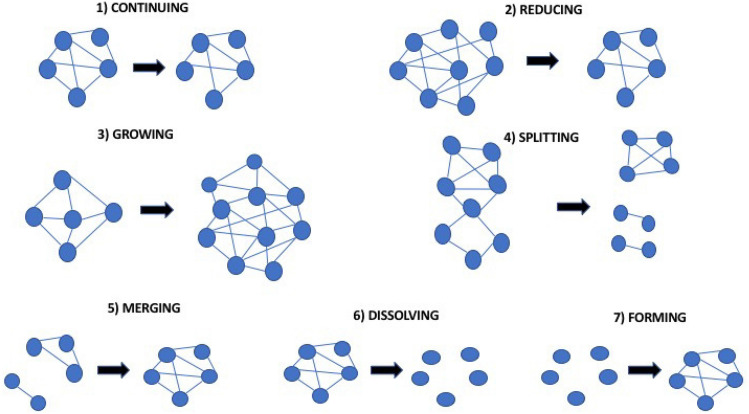
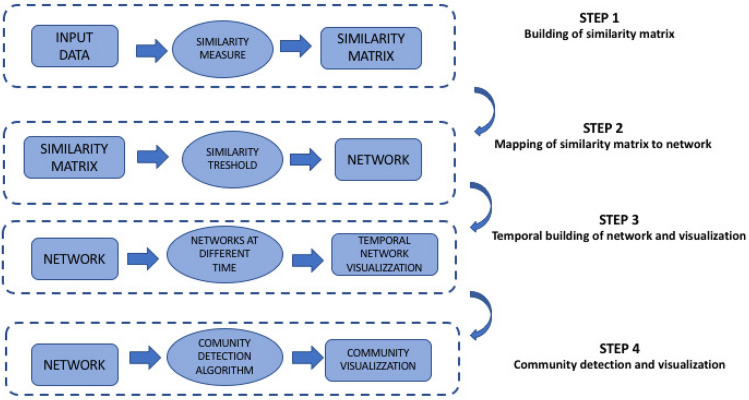
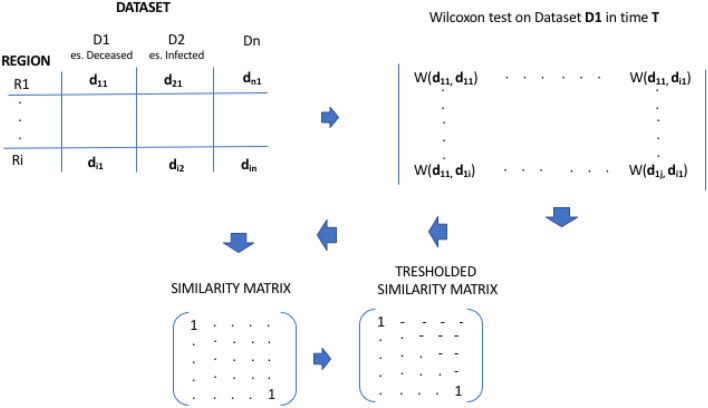
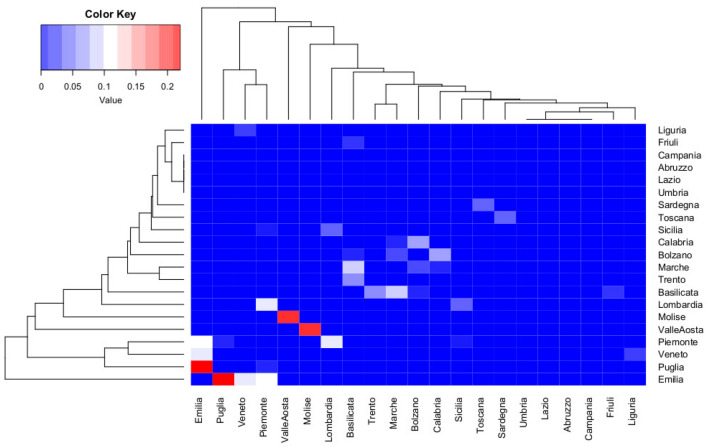
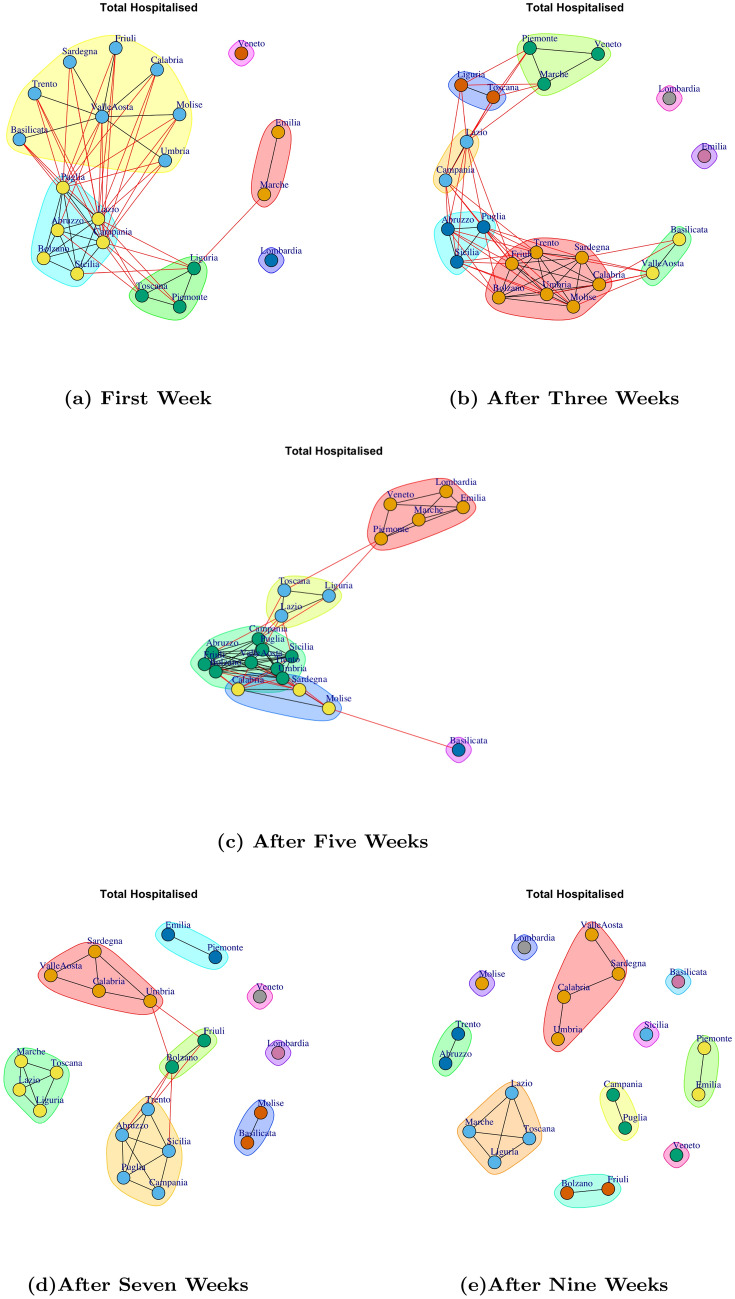
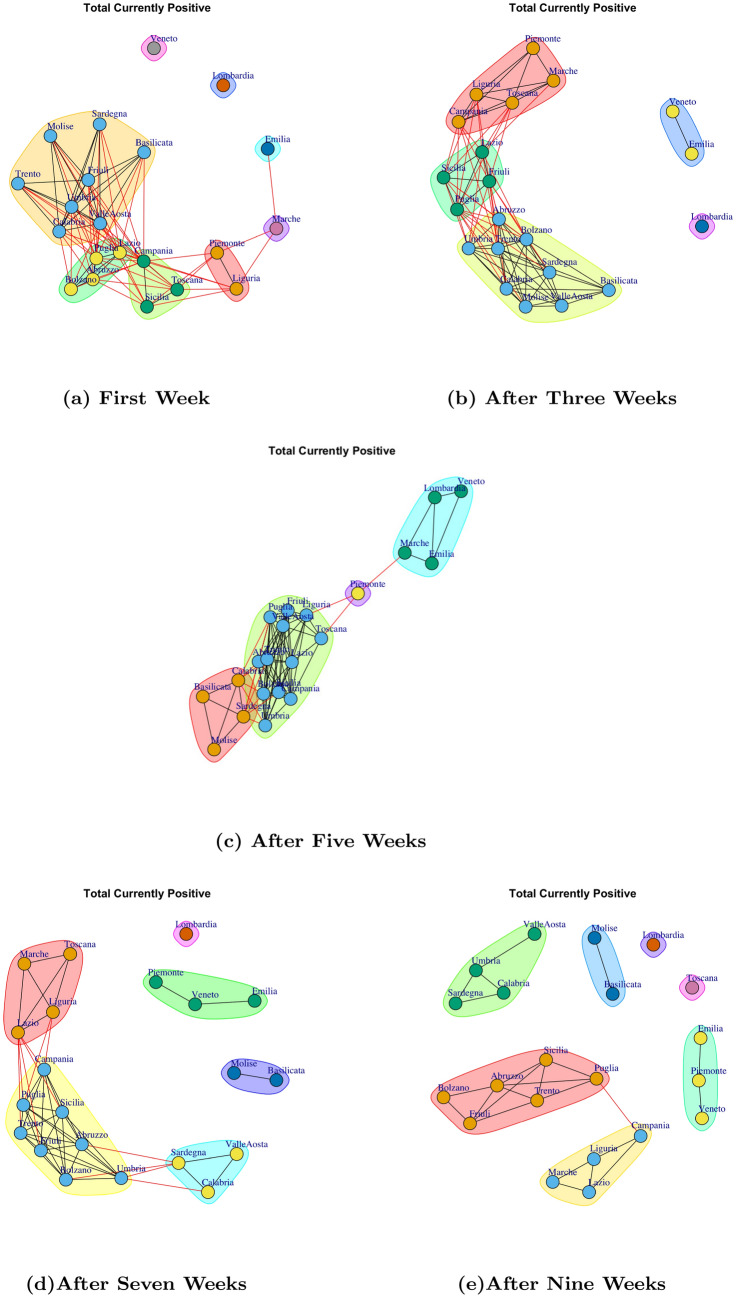
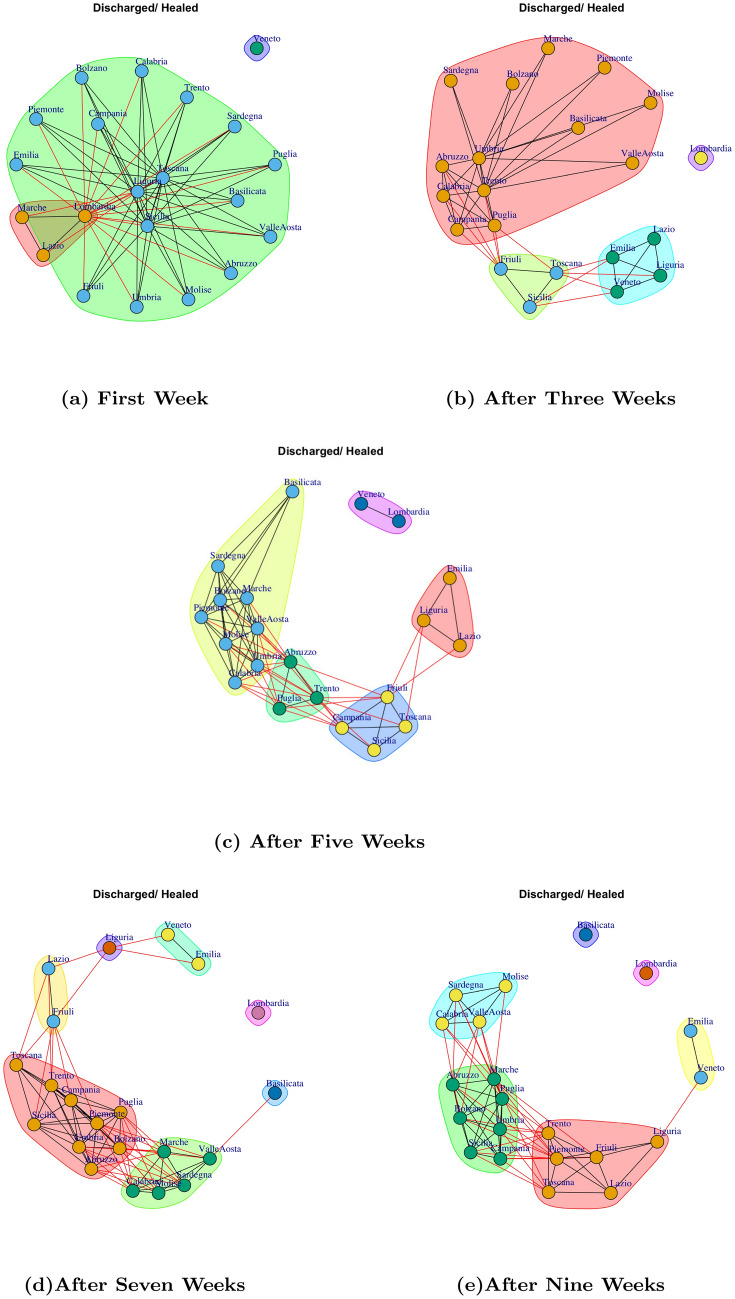
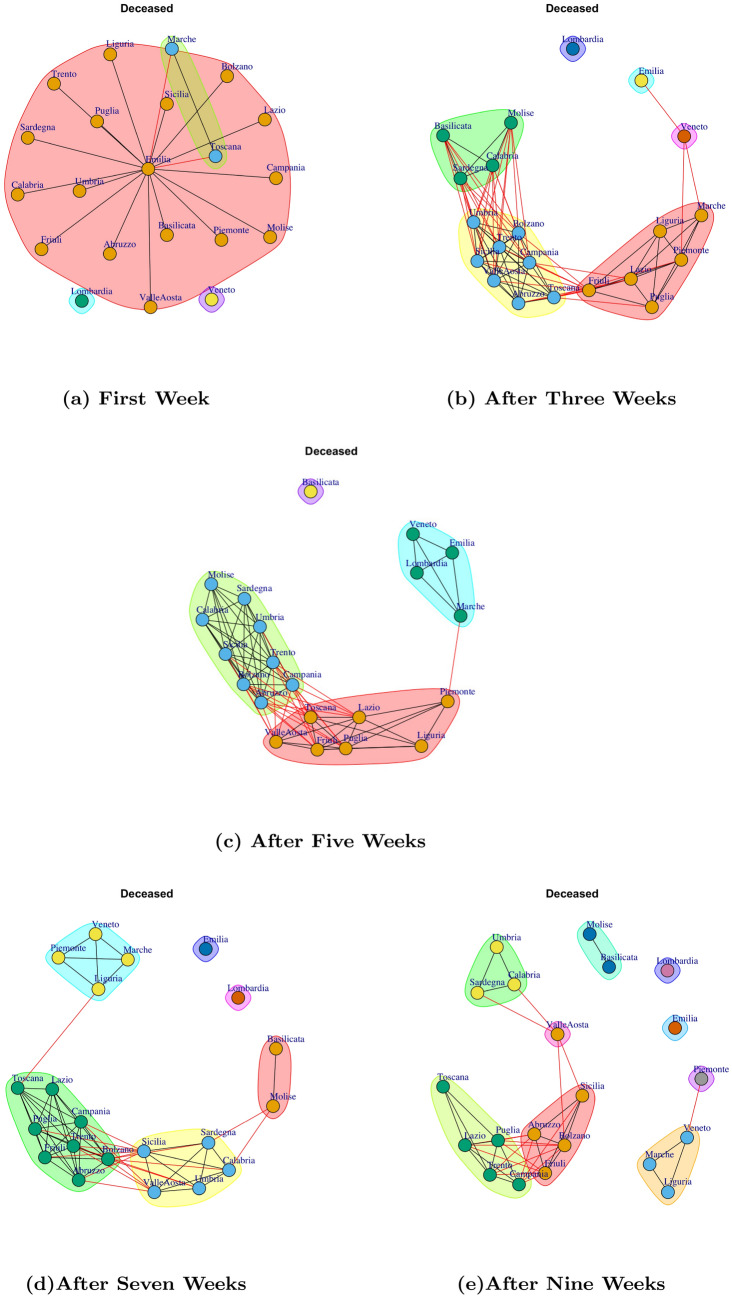
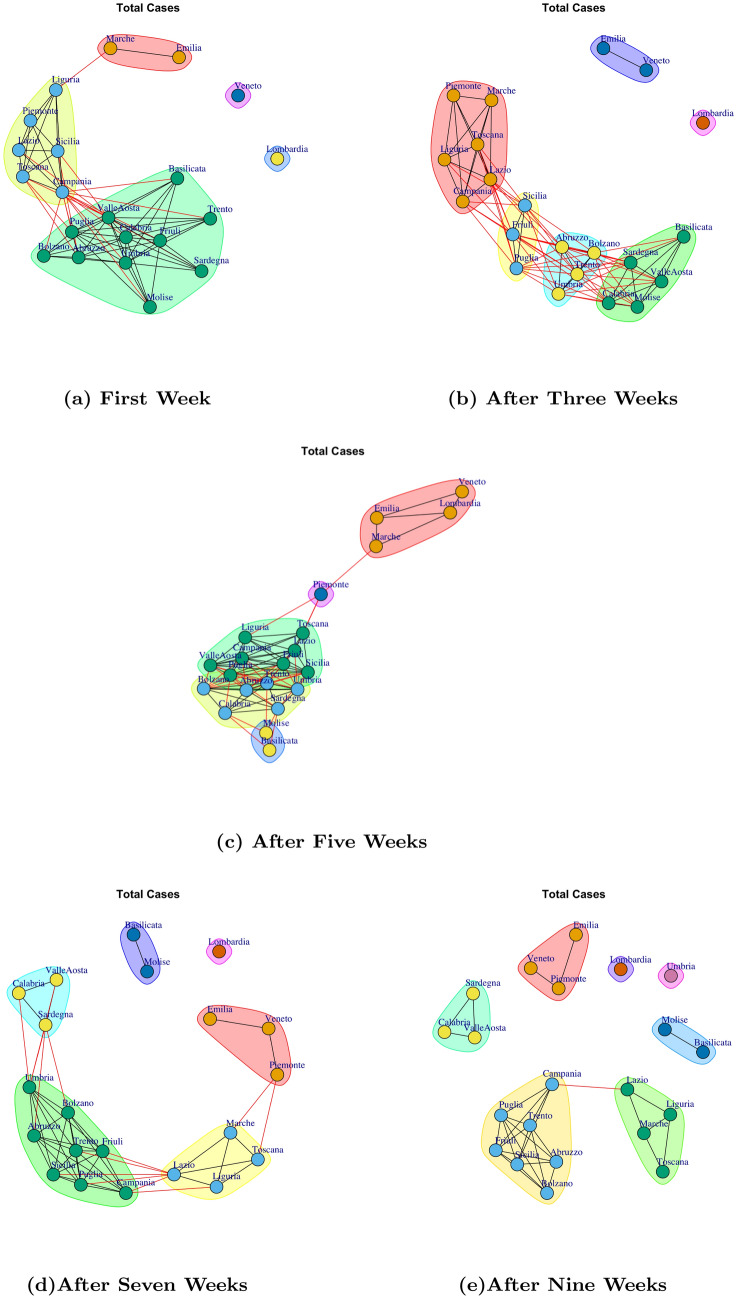
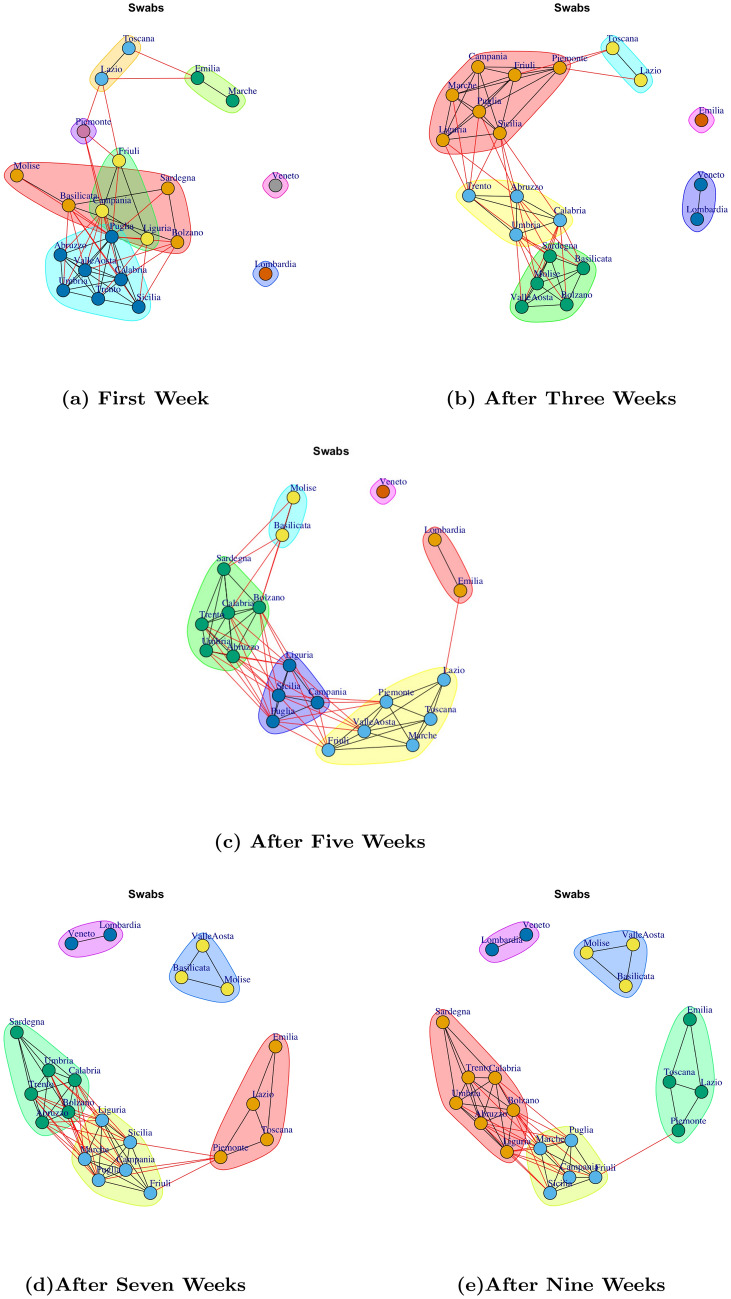
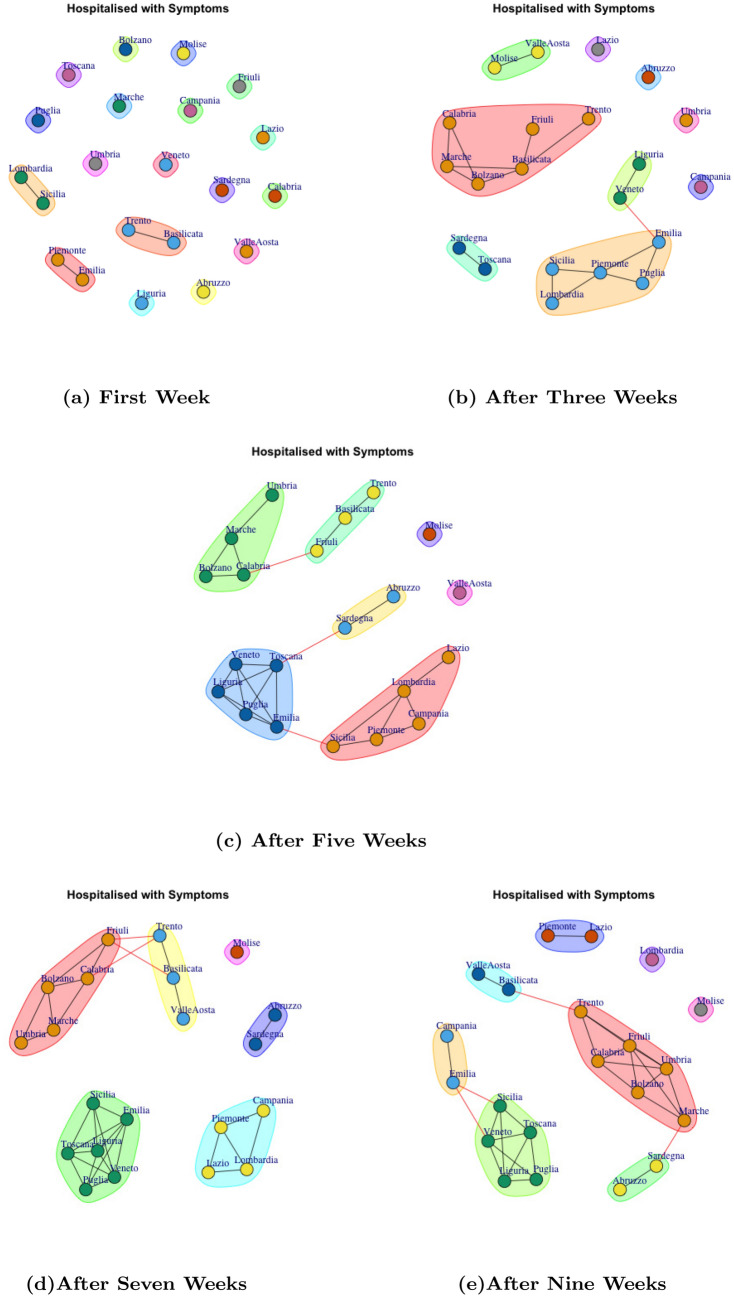
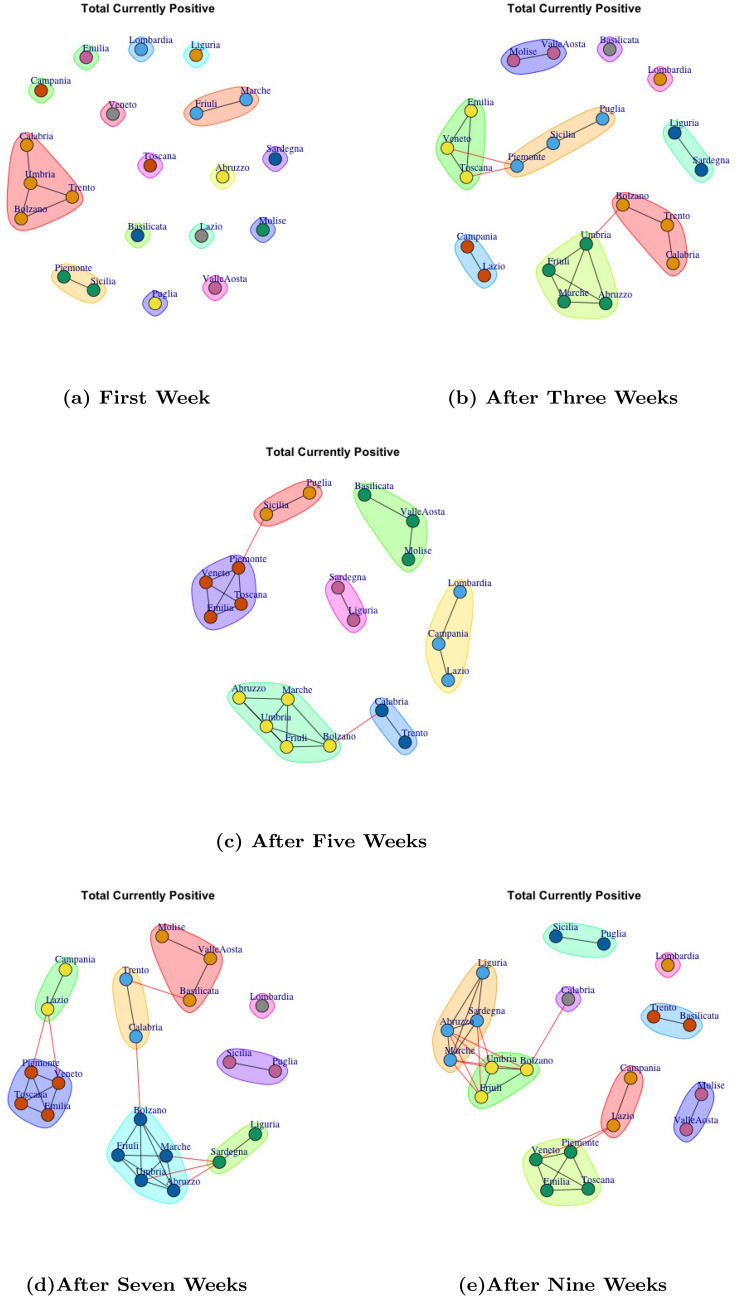
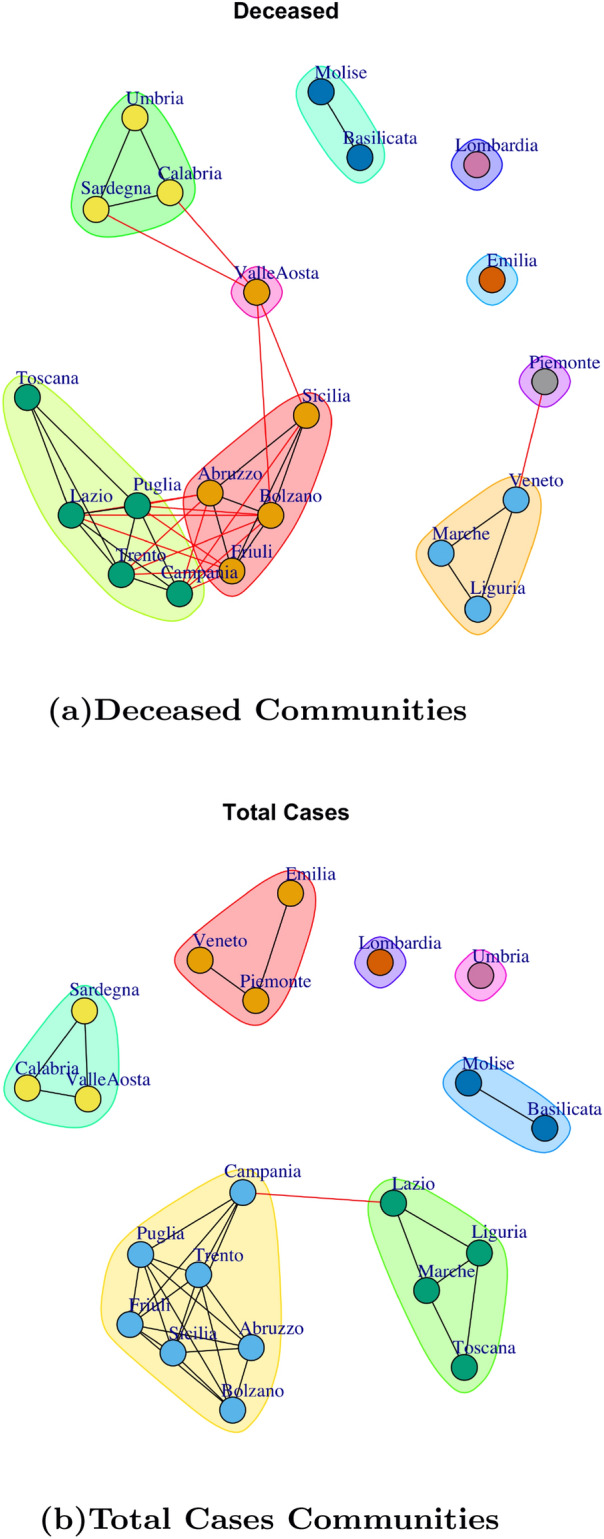
Understanding the evolution of the spread of the COVID-19 pandemic requires the analysis of several data at the spatial and temporal levels. Here, we present a new network-based methodology to analyze COVID-19 data measures containing spatial and temporal features and its application on a real dataset. The goal of the methodology is to analyze sets of homogeneous datasets (i.e. COVID-19 data taken in different periods and in several regions) using a statistical test to find similar/dissimilar datasets, mapping such similarity information on a graph and then using a community detection algorithm to visualize and analyze the spatio-temporal evolution of data. We evaluated diverse Italian COVID-19 data made publicly available by the Italian Protezione Civile Department at https://github.com/pcm-dpc/COVID-19/. Furthermore, we considered the climate data related to two periods and we integrated them with COVID-19 data measures to detect new communities related to climate changes. In conclusion, the application of the proposed methodology provides a network-based representation of the COVID-19 measures by highlighting the different behaviour of regions with respect to pandemics data released by Protezione Civile and climate data. The methodology and its implementation as R function are publicly available at https://github.com/mmilano87/analyzeC19D.
Keywords: COVID-19; Community detection; Network analysis.
© The Author(s), under exclusive licence to Springer-Verlag GmbH Austria, part of Springer Nature 2021.
Conflict of interest statement
Conflict of interestThe authors declare that they have not conflict of interests.
Figures


References
-
- Agapito G, Guzzi PH, Cannataro M. Challenges and opportunities for visualization and analysis of graph-modeled medical data. Preprints. 2017;1:1. doi: 10.20944/preprints201710.0018.v1. - DOI
-
- Asur S, Parthasarathy S, Ucar D. An event-based framework for characterizing the evolutionary behavior of interaction graphs. ACM Trans Knowl Disc Data (TKDD) 2009;3(4):1–36. doi: 10.1145/1631162.1631164. - DOI
-
- Blondel VD, Guillaume J-L, Lambiotte R, Lefebvre E. Fast unfolding of communities in large networks. J Stat Mech. 2008;10:P10008. doi: 10.1088/1742-5468/2008/10/P10008. - DOI
LinkOut - more resources
Full Text Sources